Introduction
Cameras have become increasingly important as tools for inspection and quality control, solving problems especially within industrial applications. Early systems were based on single or three channel (RGB) cameras; however, recent advances in technology have led to systems capable of delivering high-resolution multispectral images. Here, each pixel-element in the image contains values expressing the reflected (or absorbed) light from the surface of an object, across different wavelengths. These spectra are known to be directly related to the chemistry on (and below) the surface.
Multispectral image analysis has already been proposed as a useful tool in seed quality testing (Olesen et al., Reference Olesen, van Duijn and Boelt2014) and has been used to determine the presence of fungal spores on seeds (Olesen et al., Reference Olesen, Carstensen and Boelt2011), to predict viability (Olesen et al., Reference Olesen, Nikneshan, Shrestha, Tadayyon, Deleuran, Boelt and Gislum2015) and for variety (including transgenic) identification (Liu et al., Reference Liu, Liu, Lu, Chen, Yang and Zheng2014; Shrestha et al., Reference Shrestha, Deleuran, Olesen and Gislum2015). To evaluate the application of multispectral seed phenotyping as a tool for managing genebank accessions, we took seeds from 20 diverse rice varieties and used a multispectral vision system to take images and then extract feature information from the images. Multivariate analysis of the feature data was used to see whether it was possible to classify seed phenotypes according to accession.
Experimental
Seeds of 20 diverse Oryza sativa L. accessions (McNally et al., Reference McNally, Child, Bohnert, Davidson, Zhao, Ulat, Zeller, Clark, Hoen, Bureau, Stokowski, Ballinger, Frazer, Cox, Padhukasahasram, Bustamante, Weigel, Mackill, Bruskiewich, Rätsch, Buell, Leung and Leach2009) were selected for this study. The seeds were regenerated and processed following normal genebank procedures (harvesting at 38 days after peak flowering) in March and April 2013 at the International Rice Research Institute. They were sent to Videometer A/S, Hørsholm, Denmark in November 2013.
A VideometerLab vision system was used to capture images of the seeds containing spectra of (reflectance) values at 19 different wavelengths from 365 to 970 nm, each with a resolution of 2056 × 2056 pixels (44.5 μm per pixel). In addition, three low-pass filters (500, 600 and 700 nm; Andover Corporation, NH, USA) were added. For each filter, the LEDs above the cut-off frequency were used to excite any fluorescence that could be measured below the cut-off. Each pixel thus contains 46 bands, representing the chemistry of a small area on (and below) the surface of the seed. Before image acquisition, the VideometerLab was calibrated with respect to intensity and geometric distortions, followed by a light setup, where two single seeds representing the lightest and darkest phenotypes (accessions IRGC 117274 and IRGC 117283, respectively) were used to set the strobe times. A sample of approximately 30 seeds for each of the 20 accessions were placed evenly into 90-mm diameter Petri dishes. All images were acquired in one sequence, resulting in 20 images (760 MB each).
Using VideometerLab version 3.0 software, images (i.e. Petri dish containing the seed images) were labelled into areas with background (the dish) and foreground (seed) (Fig. 1(a)). Canonical discriminant analysis (CDA) was then used to calculate between and within covariance matrices for pixel spectra belonging to the two different classes, creating a score image (Fig. 1(b)) that was used for segmentation (identification of seeds within the image; Fig. 1(c)). Following segmentation, we ended up with a total of 598 binary-labelled objects (BLOBs) for the 20 accessions, each containing an individual rice seed (BLOB) (Fig. 1(d)).
‘Blob’ detection. (a) Seed (marked in red) and background (green) regions are labelled manually. (b) Using canonical discriminant analysis (CDA), a linear combination of wavelengths is determined that maximizes the difference between seed and background. (c) The transformation is thresholded such that foreground (rice) is segmented from the background. In case individual seeds are touching each other, an additional segmentation using the threshold as a label image is added as a watershed segmentation algorithm, to identify individual seeds. (d) Individual (segemented) rice seeds (‘blobs’) are numbered and saved for further analysis.

The set of 177 features extracted from each BLOB was placed into a matrix,
 $$X\in R^{598\times 177}. $$
Some of these features are related to the reflectance values of the rice seeds at various wavelengths, some are (linear) CDA projections created to discriminate and enhance differences in colour for the whole seed and for morphologies. Each feature was tested by a pair-wise test across all accessions and features showing no segregative power were removed. This reduced the number of features to 90. A further 50 features were removed due to high correlation with other features (r>0.99; P< 0.05), resulting in a matrix,
 $$X\in R^{598\times 40}. $$
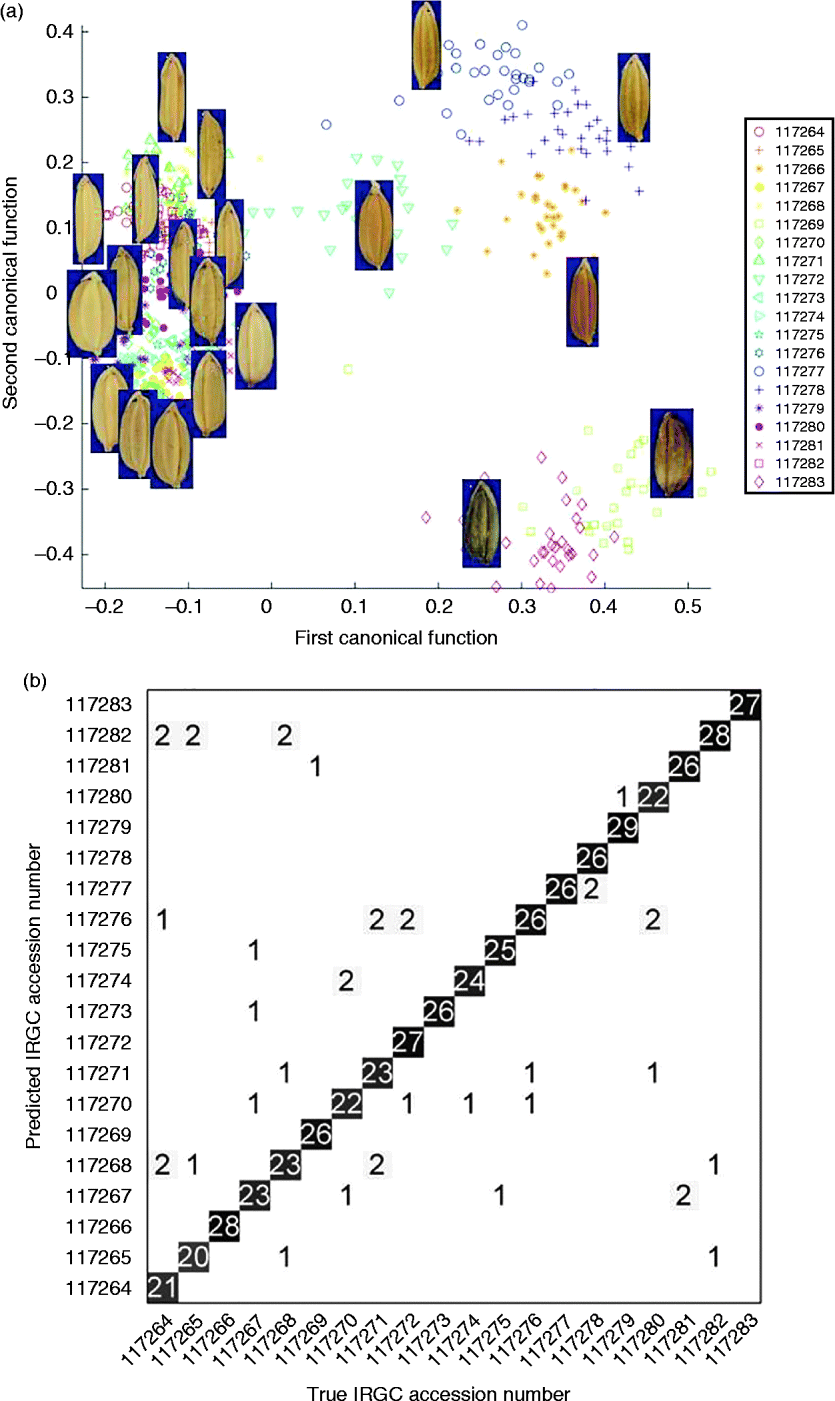
Matlab® Release 2014a (MathWorks, Natick, MA, USA) was used for modelling, using a k-nearest neighbour (k-NN) classifier combined with a multiclass CDA (Altman, Reference Altman1992; Gonzalez and Woods, Reference Gonzalez and Woods2007). A cross-validation scheme was used to validate the model, in which the data were split into N equal parts, and iteratively, a model created using a proportion, (N− 1)/N of the data. The model was validated using the remaining 1/N of data. During the iterations, prediction performance concerning classification rates for all N test fractions was accumulated. The analysis was executed for each combination of k∈ [1, 30] and N∈ [2, 50]. The optimal values of k and N that gave a minimum number of classification errors were 6 and 13, respectively, giving a classification error of 7% (Fig. 2).
(a) Scatter plot of the first two CDA functions, overlayed with example rice images for the accession. Numbers shown in the box are the International Rice Genebank Collection (IRGC) accession numbers. (b) The resulting error matrix after applying the optimized model. The shaded numbers along the diagonal indicate the number of BLOBs (rice seeds) was correctly assigned (predicted class = true class). The other numbers show the number of BLOBs was incorrectly assigned. The total proportion of correctly classified seeds was 93%.

Discussion
In this study we have shown, that it is possible to use multivariate imaging (combined with fluoresence) to perform a correct classification of 20 accessions with a high (93%) accuracy. Visual inspection of the images indicated some obvious ‘off-types’ that would normally be removed during (manual) seed sorting, suggesting that the result (correct classification) could have been higher – or indeed that the analysis was able to identify potential off-types within the seed lots of each accession. This result is consistent with that of Shrestha et al. (Reference Shrestha, Deleuran, Olesen and Gislum2015) who found that multispectral image analysis was able to identify seeds of diffferent tomato varieties with an error rate of 7%.
We conclude that multispectral image analysis may indeed be useful in managing genebank accessions, with three potential applications. First, with pressures to avoid maintaining material that does not represent novel genetic diversity, each incoming seed sample (potentially new accession) is checked by origin, name and seed phenotype to see if the sample appears to match an existing accession. Evaluation of seed phenotype is done by eye by a highly experienced staff, but could be done by machine vision. Similarly, a sample donated to the genebank may contain different phenotypes, in this case the seeds will be separated into distinct seed phenotypes to cultivate individually and determine whether each seed type produces different plant types (which will be accessioned individually) or a similar mixture of seed types (one accession). The identification of seed types is again done by eye, but could be done using multispectral image analysis. Finally, while DNA barcoding has been suggested as the ultimate way for ensuring regenerated material matches of the original material, the cost of genotyping multiple samples (the IRRI genebank regenerates thousands of accessions each year), is still too high to be a feasible proposition. Hence, precise multispectral seed phenotyping could play a key role in ensuring that the genetic integrity of accessions is maintained through cycles of regeneration.
Acknowledgements
This project is supported by the Seventh Framework Programme of EU, Industry – Academia Partnerships and Pathways (IAPP) – Marie Curie Actions (grant number 324433).