

The “historical alternatives” approach argues that at any point in history various patterns of business organizations and different combinations of production factors are viable. These might be complementary or competing for inputs and markets.Footnote 1 This article focuses on industrial districts (henceforth districts), a form of business organization that was dominant until the advent of mass production in the nineteenth century and that reemerged during the volatile economic conditions of the 1970s and 1980s.Footnote 2
In explaining the revival of districts in the 1970s and 1980s, identified as the Second Industrial Divide, national industrial policies appeared insignificant, mainly because they were rare and, in some cases, detrimental. Even when central governments introduced successful policies for small businesses, these were portrayed as either short lived or failing to keep pace with rapidly changing economic conditions.Footnote 3 However, it cannot be ignored that governments in various Western economies introduced policies in favor of small and medium-sized enterprises (SMEs) in the second half of the twentieth century. The diffusion of such policies calls for research into their impact on districts, and Italy is an ideal case study given the importance of districts to its economy and the scant research on the role of national institutions in the growth of districts.Footnote 4
This article focuses on a specific tool of government intervention—financial subsidies in the form of soft loans and grants for SMEs—and discusses their importance for two districts: Barletta and San Mauro Pascoli (San Mauro). Both specialized in footwear, one of the “Made in Italy” sectors typical of Italian districts that are also important sources of export revenues.Footnote 5 Barletta is located in southern Italy, whereas San Mauro is in the classical area of industrial districts, the Northeast and Center also called “Third Italy” because its pattern of industrialization, small businesses organized in districts, distinguished it from the northwestern industrial triangle and the underindustrialized South.Footnote 6 The geographical locations of the two districts enable comparison of subsidies within the framework of regional policy—termed the “Extraordinary Intervention for the South”—with national industrial policy. Furthermore, this research investigates the much less studied perspective of firms receiving such subsidies rather than solely the institutional viewpoint.Footnote 7
The 1970s and 1980s were of critical importance for both policies and districts in Italy. Various factors exacerbated the well-known financial constraints of small businesses: instabilities in the credit market, increased prices of inputs, and restrictive monetary policies in the 1970s as well as the regime of adjustable pegged exchange rates of the European Monetary System in the 1980s. In this context, policymakers perceived subsidized credit as an important compensating mechanism. These were also crucial decades in the regional program for southern Italy, which peaked in the mid-1970s, faced instability in the 1980s, and was finally abandoned in 1993, after the funds allocated to regional policy dried up. Thus, the census year 1991 closes the research.
After providing an overview of the enduring nature of industrial districts and a contextualization of the research question, we discuss major financial schemes for small concerns introduced in Italy in the second half of the twentieth century. We then analyze the importance of financial subsidies for the two district cases.
Industrial Districts as Production Systems
Alfred Marshall observed that late-Victorian British districts were characterized by a concentration of small firms, which could offset their disadvantages, as compared to large firms, through external economies and economies of specialization.Footnote 8 The concept of districts or clusters has evolved since its Marshallian formulation and has been discussed from a variety of perspectives.Footnote 9 Districts can be broadly defined as spatial concentrations of interconnected firms, mostly SMEs, specializing in the same industry or producing related goods. This system of production is typically embedded in the local sociocultural context, creating a mutually reinforcing dynamic.Footnote 10
The district pattern of business organization, which Philip Scranton defines as “the other side of the Second Industrial Revolution,” waned with the emergence of mass production. For instance, networked textile producers in Philadelphia declined because they could not compete with large-scale distribution via department stores and chains. Such a “buyer's market” led to a decline in products’ style and technical advantages, a separation of design from manufacturing, and the relegation of specialists to niches.Footnote 11 In other instances, such as bicycle manufacturing in Birmingham, small independent workshops moved to mass production in search of new markets following the Great Depression. The blueprints for standardized goods were provided by the dominant firms, and thus the metalworking workshops lost their ability to design and produce independently.Footnote 12
Other districts thrived, however. This was the case for furniture manufacturing in Grand Rapids and the machine-tool industry in Cincinnati. Both districts were hit by the Great Depression, but managed to prosper, developing innovative processes and products.Footnote 13 Although experiencing economic downturns, the district of Oyonnax in France, a production center of boxwood combs in the early nineteenth century, burgeoned to become a center specializing in the production of plastic molds, with customers all over the world.Footnote 14 The silk-weaving districts of Kiryu in Japan, where the manufacture of high-quality silk dates to the seventeenth century, overcame challenges through constant innovation of products and processes and an effective governance structure.Footnote 15
Since the “First Industrial Divide” in the late nineteenth century, the two systems of flexible specialization and mass production have competed, monitored, and learned from each other, producing hybrid forms such as flexible mass production.Footnote 16 However, victories on either side proved only temporary. When districts declined, supporters of flexible specialization claim this was not due to the exhaustion of technological possibilities and lack of competitiveness but rather to social, political, and economic forces that favored mass production.Footnote 17 This interpretation is not uncontroversial, as critics claim that reducing production costs per unit is necessary to meet the limited purchasing power of the majority of consumers. Furthermore, economies of scale are fundamental in various heavy industries that are major contributors to industrialization and growth.Footnote 18
A clear manifestation of forces favorable to mass production occurred in the post–World War II period, when national governments supported the diffusion of mass production techniques and the paradigmatic American organization of production. These were considered essential for the international competitiveness of national economies.Footnote 19 States used fiscal and monetary policies to stabilize demand to induce firms to expand and increase investment and output.Footnote 20 Michael J. Piore and Charles F. Sabel attribute to national governments an important role in forging mass markets and favoring mass-producing firms, particularly in Japan, Germany, Italy, and France.Footnote 21 However, mass production techniques were not the only possible path toward economic growth and international competitiveness. In the postwar decades, many firms and regions enjoyed economic success by basing their competitive strengths on economies of specialization, and strategies of flexible specialization, by adjusting output and introducing new products (or versions of products) in response to changing demand and in an effort to increase demand through constant innovation.Footnote 22
The resilience of the district as a pattern of business organization and its economic importance became particularly noticeable in the unstable economic conditions of the 1970s and 1980s, when districts proved able to thrive in a market characterized by segmented and fluctuating demand.Footnote 23 It was at this stage that districts in Italy, as well as in other European countries and in Japan, attracted scholarly attention, focused not only on established historical districts but also on districts that had emerged more recently and that contributed to outstanding regional economic growth, such as the Correggio plastic district near Reggio Emilia (Northeast region of Italy) and the medical instruments district in Mannheim (Baden-Wuttemberg region in Germany).Footnote 24
An underinvestigated factor in this revival is that a number of countries introduced policy measures in favor of small businesses. In Japan, specialized financing institutions began to operate after World War II when the government launched schemes providing financial assistance and training to SMEs in the automotive and machine tools industries.Footnote 25 West Germany's government provided low-interest loans for small enterprises under the European Recovery Program. These funds, which were repaid and re-lent, continued to be important for SMEs even in the 1980s.Footnote 26 Moreover, subsequent years saw the introduction of additional schemes, which were extended to the whole country after its reunification.Footnote 27 Similarly, the French government encouraged the establishment of the Companies for Regional Development, which acquired minority interests in regional SMEs and provided long-term loans. Later it introduced direct financial subsidies, such as soft loans and tax breaks, in addition to supporting the development of SMEs’ technological capabilities.Footnote 28
The U.S. government also introduced measures in favor of small businesses: the Small Business Administration (SBA) was established in 1953, resulting from the amalgamation of preexisting federal agencies. Congress passed the Small Business Investment Act in 1958, which placed small business investment corporations (SBICs) under the SBA's control.Footnote 29 The purpose of SBICs was to ensure a supply of long-term and equity capital to SMEs, being aware that the limited availability of capital hampered SMEs’ growth.Footnote 30
Received wisdom has overlooked the role of national policies for SMEs, which have been generally regarded as too broad in scope to explain districts' emergence in specific locations.Footnote 31 This does not seem a valid reason to dismiss a priori a possible policy contribution to the growth of district firms. Industrial districts interact dynamically with the broader institutional and economic environment, and this interaction requires further investigation.Footnote 32 Recent work has examined the role of institutions in shaping the governance and structure of clusters in developing countries, while a rich contemporary literature in economic geography, policy, and entrepreneurship analyzes the impact of government policies on the development of clusters.Footnote 33
Nevertheless, the historical role of national policies in the paradigmatic case of Italian districts has attracted little attention, as Jonathan Zeitlin points out.Footnote 34 Researchers have stressed the importance of local banks, not only for the provision of capital but also as coordinators of the local financial system and of circuits of credit within districts.Footnote 35 However, criticisms have been leveled at other types of government policies, such as granting favorable legal conditions to small concerns. These policies provided perverse incentives to firms to remain small rather than to pursue growth opportunities, thus distorting the country's industrial structure.Footnote 36 This article focuses on a specific type of government intervention: financial subsidies in the form of soft loans and grants. These were major policy instruments aimed at stimulating recipient firms’ investment and growth and were therefore a form of government intervention that might have contributed directly to the growth of district firms.Footnote 37
Government Subsidies for Small Businesses
Italy was not exceptional in relying on large corporations to assure the international competitiveness of the national economy in the late 1940s and early 1950s.Footnote 38 However, policymakers were also aware of the weight of small businesses in the country's industrial structure, although not every political party saw them as an asset. The ruling Christian Democratic Party (DC [Democrazia Cristiana]) supported SMEs for economic and sociopolitical reasons. It considered small concerns as a path to economic development, capable of adopting new technologies, and essential for a cohesive society.Footnote 39 The Italian Communist Party (PCI [Partito Comunista Italiano]) regarded small firms as economically inefficient and as the initial stage of enterprises, which would either grow or eventually fold; nevertheless, their presence avoided economic stagnation. Moreover, supporting the middle class was instrumental in preventing it from being influenced by a rightist ideology.Footnote 40 Furthermore, SMEs had produced intermediate institutions such as the Italian Confederation of Small and Medium Firms (CONFAPI) in 1947, which was effective in promoting the interests of its members and expressing their difficulties in accessing market finance.Footnote 41
The DC support, and the skepticism of the PCI and the Italian Socialist Party (PSI [Partito Socialista Italiano]), informed parliamentary debate on the bill that established regional medium-term credit institutions (RMCIs) in 1950. These specialized in providing SMEs with medium-term credit, defined as longer than one year.Footnote 42 DC representatives articulated the economic rationale of small industrial concerns and of a financial system geared toward them.Footnote 43 The DC Minister of Industry, Giuseppe Togni, stressed the socioeconomic purpose of credit and its importance in achieving “the common good.”Footnote 44 In opposition, representatives of the PSI stressed that small businesses were not competitive and were destined to be absorbed into large concerns. The law very often mentions “small and medium-sized business” but without specifying their size. The scheme, aimed at directing credit to SMEs, established a ceiling of 15 million lire (US$360,600 in 2010 prices; all subsequent price conversions are in 2010 U.S. dollars; for details about the conversions please see the online supplementary material) for loans, which increased to 50 million lire in 1954 ($1 million).Footnote 45 The financial structure of the RMCIs reached completion two years later, with the establishment of their refinancing institution, the Mediocredito Centrale, supported especially by the DC government led by Alcide De Gasperi, the Association of Industrialists (Confindustria), and Donato Menichella, the governor of the Bank of Italy (1947 to 1960).Footnote 46
The DC Minister of Industry, Emilio Colombo, proposed a generous soft-loan scheme for SMEs in 1959. Various political parties, including the PCI and PSI, agreed on the aims of the bill, and debate focused on effective means of implementing the scheme, such as targeting only SMEs. Initially, fixing a ceiling on the loans addressed this issue.Footnote 47 Subsequent decrees specified the size limit of SMEs, defined as having fewer than five hundred workers and 3 billion lire in fixed and circulating capital ($60.3 million), but with ad hoc criteria for the South.Footnote 48
The disadvantages faced by small businesses in accessing market finance were even more pronounced in the South, since capital scarcity is a typical feature of underdevelopment. Subsidies to southern SMEs began in 1957 through the regional policy for southern Italy, managed by a dedicated institution, the Cassa per il Mezzogiorno (Cassa). The post–World War II plan of promoting industrialization in southern regions had as its advocates both managers and economists at the state-owned Institute for Industrial Reconstruction and the Bank of Italy, as well as the Socialist Minister of Industry, Rodolfo Morandi.Footnote 49 The program gained domestic and international support. The International Bank for Reconstruction and Development actively participated in its design and implementation because it considered the development of southern Italy essential to the reconstruction and modernization of the country's economy.Footnote 50
Cassa's subsidies, grants, and soft loans initially targeted SMEs that met the defined size limits, (fewer than 500 workers and fixed capital below 3 billion lire, equivalent to $58.7 million), but soon those limits disappeared, so that by 1959 any firm could benefit from financial subsidies on the first 6 billion lire ($120.6 million) of their investment. This change marked a diversion of the regional policy's initial intention to develop an organic network of SMEs, in order to attract modern industries and large investment from the North. In addition to the major national programs, schemes addressing specific and sectoral problems appeared in subsequent years. The lack of a coherent industrial policy is one interpretation of the proliferation of subsidies, later called a “jungle of incentives,” by which the same firm could benefit from several schemes.Footnote 51
The Central Bank also introduced measures to shelter small businesses from credit squeezes. This was the case in the 1970s when, due to high inflation and negative interest rates between 1973 and 1975, banks preferred lending at higher interest rates on the short-term market.Footnote 52 To redirect money into the medium-term market, the Central Bank introduced measures such as the “portfolio obligation” in 1973 and, from 1973 to 1978, imposed ceilings on loans, except for those below 500 million lira ($5.2 million), to ensure a flow of credit toward small firms.Footnote 53
Subsidized credit acquired greater importance as a corrective mechanism to facilitate firms’ access to credit in the deteriorating economic conditions following the first oil shock.Footnote 54 A simplification of the soft-loan system followed the 1975 recession, when Italy's GDP fell by 2.1 percent—the first fall since World War II.Footnote 55 One single scheme (law 902/76) supplanted various earlier ones and provided subsidized credit throughout the country with progressively preferential conditions for less developed regions. The DC government, led by Prime Minister Giulio Andreotti, proposed the bill, gaining support from other political parties. Members of Parliament across the political spectrum raised issues concerning the administration of subsidies and the need for a clear definition of the size of beneficiary firms, to prevent larger concerns from accessing this scheme. Thus, the bill fixed the upper limit of eligible firms to 1.2 billion lire in fixed assets ($6.6 million) and up to three hundred employees.Footnote 56
The 1980s saw an emphasis on measures promoting innovation, particularly with laws 46/1982 and 696/1983, which subsidized technological innovation within firms of any size and the adoption of high-tech equipment in SMEs, respectively. The widely supported SME scheme, proposed by various ministers of the coalition government led by the Socialist prime minister Bettino Craxi, provided grants for the purchase and leasing of high-tech equipment. Precise identification of the beneficiaries was one of the issues raised with the consequent decision of adopting the SME definition specified in previous schemes.
The extraordinary intervention for the South underwent a period of instability between 1980 and 1986, when eleven ministerial decrees prolonged the program. Political parties agreed to maintain an additional flow of resources to the South, but there was disagreement concerning the institutional framework of these funds. In 1986 the regional program received further financing extending its life until 1993, when domestic and external pressures halted the flow of funding. There was resentment in the North about the level of public expenditure in the South. The policy appeared as a drain on the northern economy and had achieved few tangible results over forty years. The European Commission also influenced the course of events by refusing to approve the 1992 bill to refinance the program. In December 1992 the Italian Parliament decided to abolish the extraordinary intervention and its institutions, replacing the policy with a national program of assistance for depressed areas.Footnote 57
The Importance of Subsidies for Barletta and San Mauro Pascoli
A handicraft tradition in footwear emerged in the districts of Barletta, in the southern region of Puglia, and San Mauro, in the north-eastern region of Emilia Romagna, at the beginning of the twentieth century.
Over time the two areas specialized in different segments of the industry: medium- and high-priced segments of leather footwear in San Mauro, and low- and medium-priced segments of leisure footwear in Barletta, where firms specialized in rubber-soled footwear mainly because of a scarcity of leather. This was the case for Cofra, one of the currently largest firms (included in the sample analyzed in this article), established in 1938 by Ruggiero Cortellino. Industrial production began in Barletta after World War II with Calzaturificio Giuseppe Damato Ltd. (also in the sample). The success of the firm was evident in the district and had a demonstration effect. Barletta and surrounding municipalities developed additional specializations in clothing and textiles, which had started in the interwar period and benefited from World War II military orders. The industry grew in the 1950s and 1960s and numerous spinoffs occurred, particularly in the fast-growth period of the 1970s and 1980s. Among these spinoffs were the firms Ripatex and Magia, both included in the data sample.Footnote 58
The 1970s and 1980s were Barletta's “golden age,” when new equipment and raw material were introduced that led to additional specializations in the medium-low segment of sport and leisure footwear. Firms were able to purchase new equipment owing to suppliers’ favorable payment terms and subsidies extended in the context of the regional policy. This was crucial at a time of restrictive monetary policy in the late 1970s and diminishing competitiveness of Italian exports in the 1980s, after Italy joined the European Monetary System.Footnote 59
As with Barletta, shoemaking skills existed in San Mauro in the early twentieth century (drawing workers on account of military exemption for artisanal labor in the sector during World War I). In the interwar period local shoemakers established a cooperative under the patronage of the Fascist government, and Mussolini himself donated 88,000 lire ($77,583) to promote mechanization of local production in 1939. Various families started their businesses after World War II and introduced industrial techniques in the second half of the 1950s. By the end of that decade some of those firms that would later become industry leaders, such as Casadei, Pollini, and Sergio Rossi (all included in the sample analyzed in this article), had established their workshops or small factories.Footnote 60
The 1970s and 1980s were also important decades for San Mauro. Producers strengthened their positions in domestic and international markets and abandoned the fierce competition in the medium-low segments to focus on medium-high and luxury products. Emphasis was placed on product innovation, high-quality raw materials, and partnerships with fashion designers, in addition to local labor skill upgrading via establishment of a vocational training center, the International Footwear School and Research Centre (CERCAL), in 1984.Footnote 61
For a comparison of the two districts we can consider that in 1971, in the sectors of specialization (footwear and leather goods, and clothing and textiles), Barletta had more than 4,286 employees whereas San Mauro had 3,318. By 1981 the corresponding figures were 9,610 and 4,735, respectively, and, in 1991, 14,122 and 4,804.Footnote 62 The much lower employment growth in the northeastern district does not indicate stagnation. Barletta's sectors of specialization included footwear and garments, whereas San Mauro remained focused on footwear only. Moreover, the area and workforce of the Barletta district was greater than those of its northeastern counterpart. In spite of the difference in size, the value of the two districts’ exports is similar.Footnote 63 This suggests that San Mauro's production has a higher value added and that a greater share serves foreign markets.
To assess the role of government financial subsidies in the critical decades of the 1970s and 1980s, the records of two samples of companies located in each district at the relevant Chambers of Commerce were collected (Bari for Barletta and Forlì for San Mauro).Footnote 64 The two relatively small samples of companies (fifty-three overall) consist of family-owned enterprises whose legal status is either limited liability or a public company, as these are the only ones legally obliged to disclose their records. The inclusion of those companies alone creates bias in the samples, as the smallest companies in the districts are unlikely to go public and therefore their records would not have been available. The data set also includes reports and balance sheets of companies in other comparable manufacturing sectors, so as to obtain samples of appropriate size (see supplementary online appendix for details).
The Barletta and San Mauro samples include thirty-two and twenty-one manufacturing companies, respectively, that were active or public at various times over the two decades. These provide 681 observations (annual balance sheets): 460 for southern companies and 221 for the northeastern sample. The latter is smaller, as the district and its sectors of specialization are smaller. Moreover, companies in the northeastern sample did not have public status or were not trading during the period from 1971 to 1991; most incorporated as public companies, or went public in the 1980s.
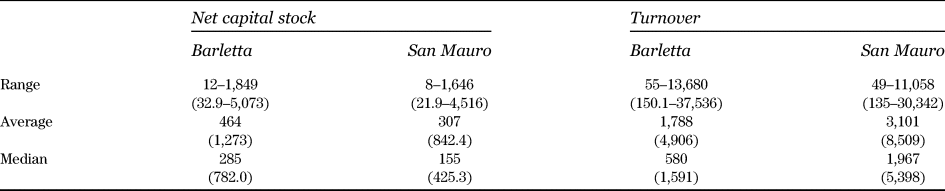
Table 1 displays information about the size of the sample firms. The values in dollars at 2010 prices indicate that all companies fall within the 1970s definition of an SME (scheme 902/76), having fixed net assets below 1.2 billion lire or 6.6 millon dollars in 2010 prices. Even the largest companies in the samples—Cofra in Barletta, with fixed assets of 5.1 million dollars, and Pollini in San Mauro, with fixed assets of 4.5 million dollars in 2010 prices—are below the threshold. Moreover, in converting the values in Table 1 into euros it would be evident that the sample firms fall into the European definition of SMEs in terms of financial criteria: small firms with fixed net assets and turnover below 10 million euros, and medium-sized firms with fixed net assets of 10 to 43 million euros and turnover of 10 to 50 million euros.
Net Capital Stock and Turnover of Firms in the Samples, 1971–1991 (in 1980 lire [millions] and corresponding values in 2010 US$ [thousands] in parentheses)

Source: Company records in Chamber of Commerce in Bari and Chamber of Commerce in Forlì. See the suppelementary online Appendix for full archival references.
The firms in the samples are owned by the founders or their descendants. Even public companies did not trade their shares on the stock exchange in the years under analysis, as shown in their balance sheets. This means that these firms comply with the EU's “independence” criterion: no more than 25 percent of the SMEs’ capital should be controlled by partner enterprises or public bodies.Footnote 65 Moreover, firms in the samples are “family businesses” in that the founders or their descendants are the sole equity owners and are directly involved in their management.Footnote 66
Companies in the Barletta sample are, on average, larger in terms of fixed net assets but have a lower turnover, which may reflect the different market segments in which the two districts specialize. The higher level of fixed assets is consistent with the findings of larger studies, which have interpreted this feature of southern SMEs as a distortion caused by the subsidies, as these lowered the cost of capital relative to labor.Footnote 67
An analysis of the samples’ capital structure highlights that government subsidies, including grants and soft loans, are clearly more important for firms in the southern sample than for their northeastern counterparts. Subisidies amounted on average to 11 percent of total capital of the Barletta sample and 1 percent of total capital in the San Mauro sample (see Figure 2 in the supplementary online material for further details). The greater relative importance in the former sample reflects the more generous subsidies available in the South and the limited availability of market medium-term finance. The literature assessing the importance and impact of government subsidies is extensive, and certain studies have focused on SMEs. A study by the Mediocredito, including a sample of 3,852 across all manufacturing sectors between 1989 and 1991, found that, overall, 53 percent of firms in the sample received subsidies, with the South being above the national average at 58.9 percent.Footnote 68 Other researchers have examined additional impacts of financial subsidies on small businesses.Footnote 69 However, none of these studies differentiates between SMEs located within districts and those elsewhere, nor do they clarify whether district firms have preferential access to subsidies. Moreover, no studies have yet provided insight into the importance of subsidies for firms within districts, which is a gap this research aims to fill.
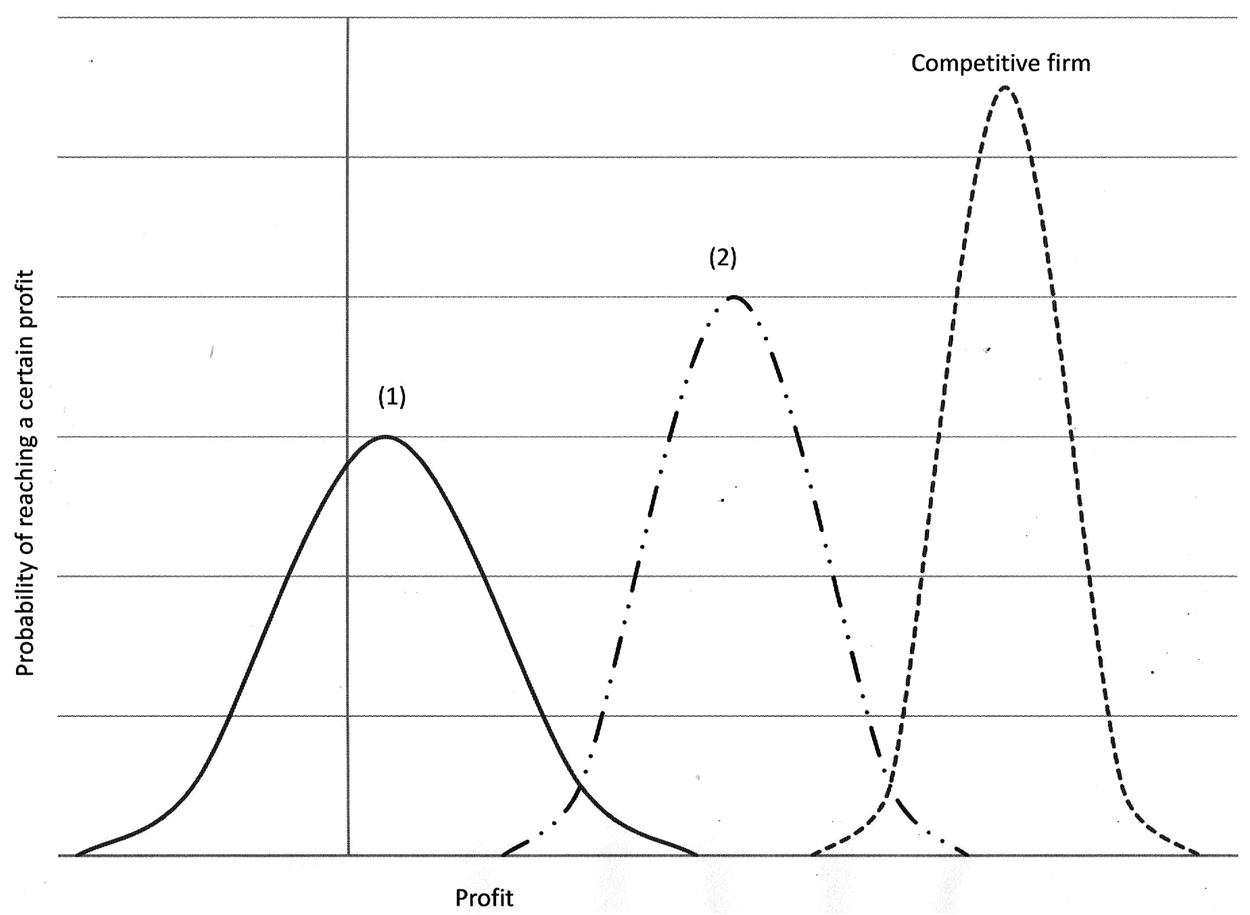
Michele Bagella and Andrea Caggese argue that soft loans and grants can be considered effective if the profitability of recipient firms increases not only while they receive the subsidies but also subsequently, when they are no longer subsidized. Firms should move from position 1 in Figure 1, characterized by low and highly variable profit, to position 2, with higher and less variable profit, when receiving subsidies. This should happen because subsidies increase the recipient companies’ profits and reduce the variability of profits—an indicator of risk—by providing an additional, less variable, inflow of funds.Footnote 70 Furthermore, firms are learning organizations, and recipient companies should learn how to better conduct their business while in the subsidized stage.Footnote 71 This methodology has never been applied in full because of insufficient longitudinal company records, which is something this historical research provides.
Profitability and risk of subsidized and nonsubsidized firms: The ideal scenario.
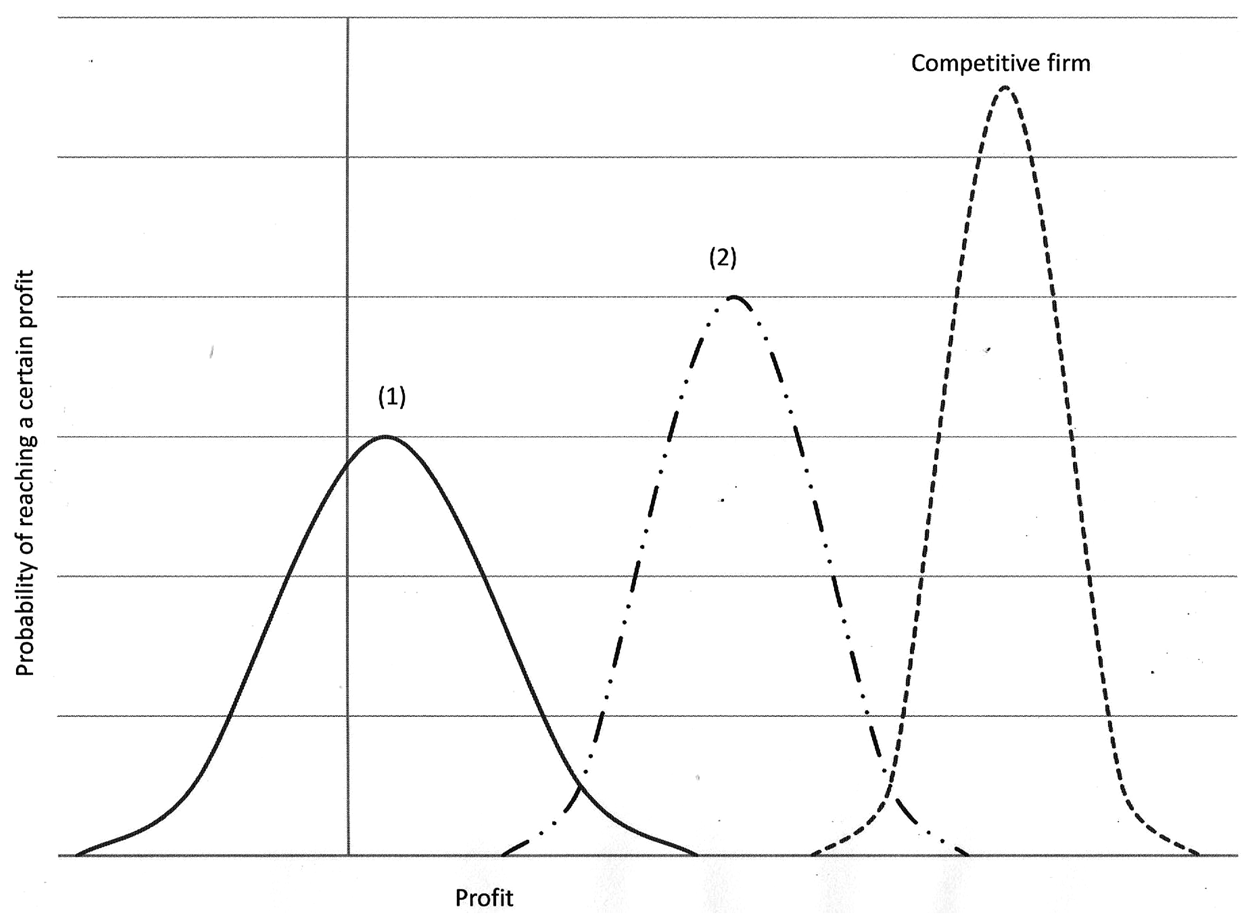
The companies’ performance in the postsubsidy stage is of critical importance. For them to return to position 1 would mean that their profitability could improve only through constant subsidies, entailing a permanent capture of government funds and, in extreme cases, the bailing out of troubled firms, which are unwanted policy outcomes. Moreover, if the company returned to position 1 it would be perceived by banks as a “bad company” and would be credit-rationed, whereas if it remained in position 2 or moved to the ideal position of “competitive firm” it would not be credit-rationed again. A caveat related to this methodology is that it does not account for factors other than subsidies in the performance of recipient firms and does not aim to quantify a cause-effect relationship between subsidies and firms’ performance.
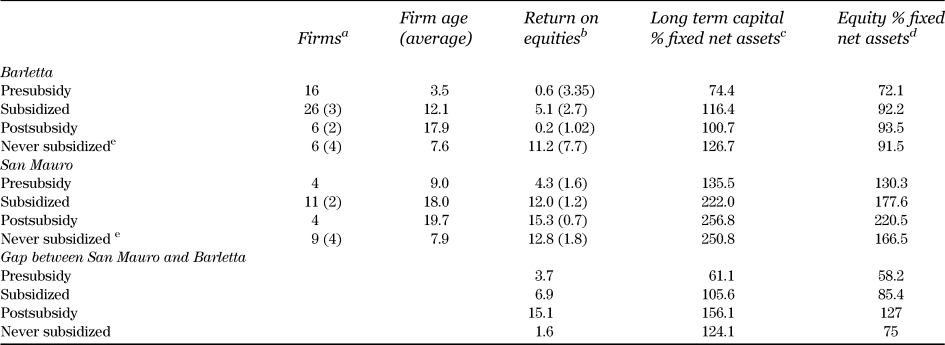
Table 2 looks at the profitability of firms in the two samples, using two measures: return on equity and rate of return. The variability of these financial ratios, indicated by the coefficients of variation in parentheses, is a standard indicator of risk.Footnote 72
Profitability, Barletta and San Mauro Samples, 1971–1991 (weighted averages, with coefficients of variation in parentheses)

Source: Company records in Chamber of Commerce in Bari and Chamber of Commerce in Forlì. See the supplementary online Appendix for full archival references.
Note: Differences in means have been tested for significance: in the subsidized and postsubsidy groups the level of significance is either 1% or 5% depending on the specific ratio and percentage; in the presubsidy and never-subsidized groups the levels of significance are either 5% or 10%.
The gap between San Mauro and Barletta has been computed as the difference between the weighted averages of the two samples.
a Number of companies in each group (number of failed companies in parentheses).
b Return on equities defined as profit or losses divided by equities (coefficients of variation in parentheses).
c Long-term capital as a percentage of fixed net assets.
d Equity as a percentage of fixed net assets.
e “Never subsidized” companies (excluding bankrupt companies’ final year of activity).
Companies in the subsidized stage are older, indicating the difficulty of securing subsidies in the early stage of their activity. This is confirmed by previous studies and reflects the involvement of credit institutions in handling subsidies and their preference for lending to companies with a proven track record.
Overall, firms in the southern sample display lower and more variable profits—that is, higher risk—than their northeastern counterparts, a result confirmed by studies based on larger samples.Footnote 73 This is not surprising, considering that firms in the Barletta district trade in lower-value-added products. The annual reports of the southern firms often mentioned low or declining growth in local and national markets, which limited their ability to exploit economies of scale and, in turn, might have dictated a lower utilization of production capacity.Footnote 74 Only the largest companies in the southern sample, such as Damato and Cofra, mentioned exporting to Britain, whereas the reports of northeastern firms such as Casadei, Rossi, and Pollini frequently mentioned exporting to northern Europe, Japan, and the United States.Footnote 75 The southern textile firms Tucci and Ripatex also mentioned owning obsolete equipment and having related expenses for repairs, as well as facing difficulties in procuring spare parts.Footnote 76 Other studies have taken an “ecosystem” approach and pointed out the detrimental effects on the southern economy of macroeconomic and institutional factors: poorer infrastructure, inefficiency of the public administration, and rigidities in the labor market, such as national wages.Footnote 77
Southern sample companies shift from low profitability and high risk before subsidies to higher profitability and lower risk when subsidized. In the postsubsidy stage they become much less profitable and less risky, displaying values below those of the presubsidy stage. Therefore, from position 2 in Figure 1, they do not progress to the ideal position of the “competitive firm” but retreat beyond the initial position 1 occupied in the presubsidy stage.
Companies in the northeastern sample display the “ideal” behavior. They move from position 1 before subsidies to position 2 when subsidized, and in the postsubsidy stage they move closer to the “competitive firm” position. Thus, the profitability gap between firms in the two samples not only increases when they receive subsidies but increases even further in the postsubsidy period. The never-subsidized groups display the smallest profitability gap, due to the high-profit and high-risk strategy of the southern sample. This strategy clearly entails a higher probability of failure, as also indicated by the high number of failed companies (in parentheses in the Firms column in Table 2). Despite not relying on subsidies, these firms display high levels of long-term capital as a percentage of fixed net assets. Their main sources of long-term borrowed capital are the partners themselves.
The comparison in Table 2 casts doubt on the effectiveness of subsidies. Southern companies with access to subsidies seem to pursue a “survival” strategy, whereas unsubsidized ones pursue a “profit maximizing” strategy. It could be argued that southern entrepreneurs prefer to reap benefits from institutions and abandon the market rationale in a particularly difficult market owing to competition from various fronts, including the black economy.Footnote 78 However, this may not be necessarily the case, and the behavior of firms in the southern sample may be economically rational. The low capitalization of southern companies and particularly the scarcity of company-owned capital (indicated by equity as a percentage of fixed net assets in Table 2) suggest that southern companies would have very little capital to cover possible losses from riskier, though more profitable, projects. Therefore, as long as they can increase their profits artificially through subsidies, undertaking low-profit and low-risk projects can be the most economically rational choice, where the economic rationale is the survival of the firm. The propensity for a low-profit and low-risk strategy also aligns with various studies on developing economies that have documented how the shortage of liquid assets, such as cash that can be drawn on in case of emergency, makes households in developing economies choose a low-risk and low-return crop. Moreover, firms faced with high, and to some extent uninsurable, risk trade off lower for more stable profits.Footnote 79
The literature on family businesses sheds further light on the low-profit and low-risk strategy observed here. Family firms facing a high-risk ecosystem may prioritize survival over profit maximization, to ensure continuity of the family legacy for themselves and future generations. This priority leads to a long-term orientation in investment decisions, even though it may result in lower short-term returns.Footnote 80
Conclusion
This article challenges the thesis that national policies have had a negligible, if not detrimental, influence on the growth of districts in the second half of the twentieth century. Focusing on Italy, this research explores the importance of financial subsidies for recipient firms in two districts in the 1970s and 1980s. Soft loans and grants represented a greater source of finance in the southern sample of Barletta than in the northeastern district of San Mauro. Considering that the second half of the 1970s and the early 1980s were years of restructuring in both districts, it can be concluded that in the case of the northeastern district, government subsidies contributed to growth, but in the case of the southern district, these subsidies played a critical role in financing the restructuring that led to growth. Nevertheless, government funds were more effective in San Mauro than in Barletta, in that the profitability of recipient firms increased there in the postsubsidy period and not in Barletta. Small firms in the southern sample became less risky and more profitable when subsidized, but they reverted to lower profitability when no longer subsidized. An even more striking indication is displayed by the never-subsidized group, which shows higher levels of both profitability and risk than the other southern groups, suggesting that firms, when subsidized, pursue a “survival” strategy that can be economically rational in the high-risk ecosystem they face.
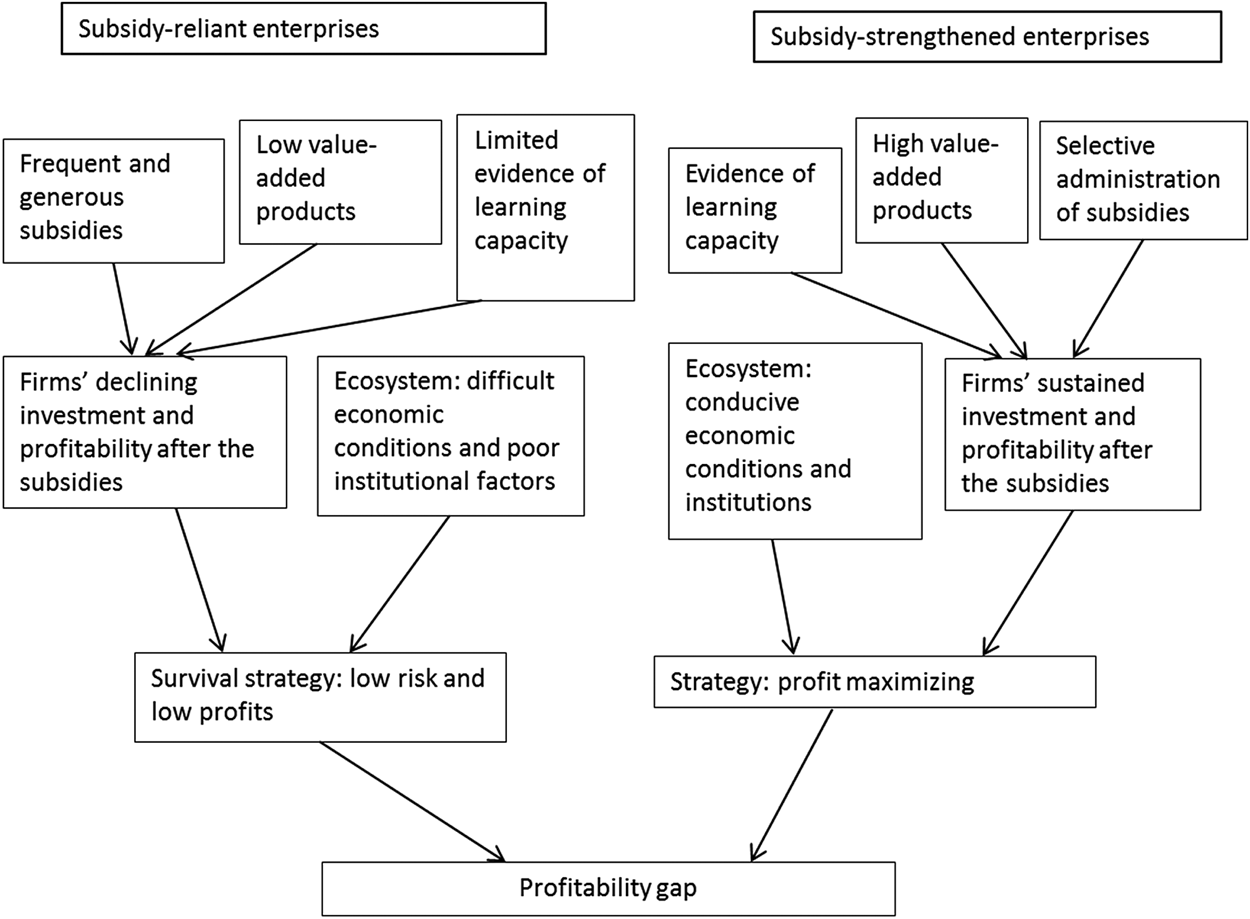
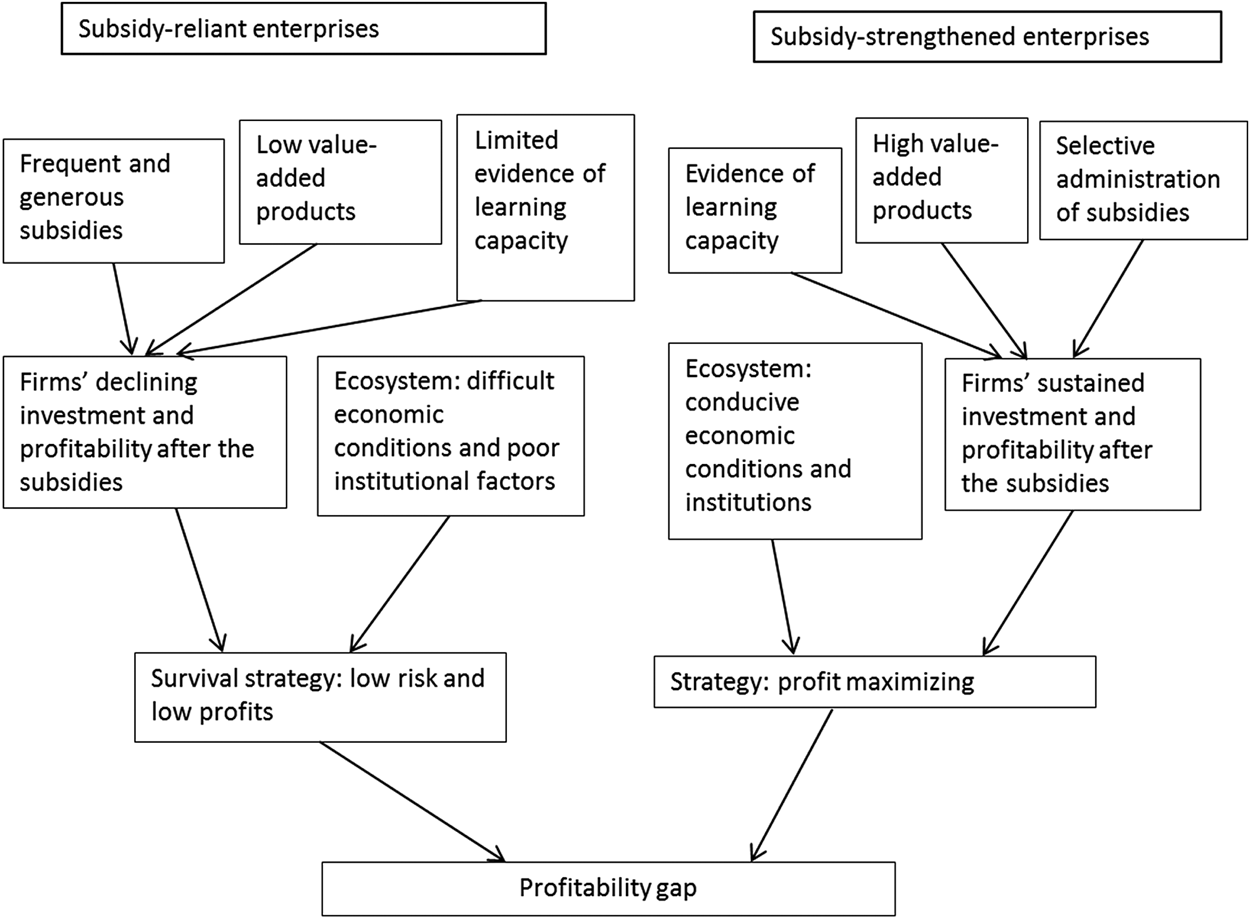
Two contrasting profiles of subsidized firms emerge from the analysis in this article: the subsidy-reliant enterprise and the subsidy-strengthened enterprise. The former profile is dominant in the Barletta sample and the latter in San Mauro. Figure 2 provides a snapshot of the firms’ profiles and factors affecting the different impacts of subsidies on the two samples, determining the profitability gap between them. The characteristics highlighted are not exhaustive but only those emerging from the analysis in this article.
Profiles of subsidized enterprises and the profitability gap. (Source: Figure by author.)
This research deepens our knowledge of the behavior of districts. Italian and international historiography has emphasized the important role of local institutions in the growth of districts. These were important in the resolution of disputes and market regulation and in providing technical education and quality control.Footnote 81 This article demonstrates that national institutions were also important and sheds light on a type of financing—soft loans and grants—largely overlooked in the literature on Italian districts.
The importance of investigating the impact of financial subsidies for SMEs on the growth of districts also stems from the wide diffusion of these policies. As mentioned earlier, several countries launched such schemes in the postwar era. Accounts of the development of the engineering district of Ota in Japan confirm their importance. The district emerged in the 1950s and grew rapidly, becoming an important manufacturer of auto parts. Government support enabled the upgrading of small businesses’ equipment and machinery as firms could secure subsidized long-term funds, which also crowded in market credit.Footnote 82 A further example is the high-tech cluster of Sakaki, where almost every firm with fewer than twenty employees benefited from government support.Footnote 83
The U.S. government also took policy initiatives to help SMEs in the 1950s with the SBA and the SBICs to ensure supply of long-term and equity capital to small businesses.Footnote 84 Private investors, as well as institutions such as Bank of America, established SBICs in Silicon Valley, and these grew rapidly from 1959 to 1968.Footnote 85 However, research highlights that while this initiative was short lived, a different type of federal policy was crucial for the development of this cluster—federal military spending and demand for electronics, space vehicles, communications technology, and computer programs.Footnote 86
This historical analysis of the contribution of financial subsidies to the development of districts and clusters also addresses a notable gap in research dealing with contemporary clusters. Erik Lehmann and Matthias Menter emphasize that “while the conditions for creating clusters and modalities of how clusters should be configured have been investigated intensively, evidence about the performance evaluation of public cluster policy is scarce.”Footnote 87 Their research shows that financial support for clusters initiated by the German government in 2007 improved the productivity of those clusters but suggests that the policy was one of picking winners—that is, highly competitive firms and clusters that did not need public resources.Footnote 88 Conversely, research on the impact of the French cluster policy, launched in 1998, finds that financial incentives did not have a significant effect on firms’ productivity and suggests that policy was captured by declining sectors and firms.Footnote 89 Both types of drawbacks, picking winners and bailing out troubled firms, can be observed particularly in the case of Barletta, where both top performing firms and unprofitable businesses managed to capture government subsidies for long periods of time, casting doubt on the management of such financial incentives.
This research refines our understanding of the broader institutional context of the development of districts. While it disputes that macroeconomic institutions have not favored the growth of districts, this article supports one of the fundamental tenets of the “historical alternatives” approach—that the organization of production is shaped by politically defined economic and social interests. The Italian case, and other examples discussed in this article, clarify that national policies have contributed, to varying degrees, to the development of districts. Nevertheless, policies alone cannot guarantee the emergence of districts. They are an enabling factor, but the ecosystem in which districts are embedded provides impetus for learning and growth.
Supplementary Material
The supplementary material for this article can be found at https://doi.org/10.1017/S000768051900117X.