


I. INTRODUCTION
Diethyl ether is a common organic solvent that is widely used in the fields of diesel engines, agriculture, food, chemical, biological, pharmaceutical, and medical industries. Reference Chen, Wu, Zhu and Zhang1–Reference Yua, Xie, Yang and Zhang4 Due to its volatility, pungent odor, anesthetic effect, flammability, and explosive nature, diethyl ether poses a great risk to human health and safety. Prolonged inhalation of even low concentrations can lead to headache, dizziness, proteinuria, reduction of red blood cells, and even death. Reference Liu, Zhang, Yuan and Zuo5–Reference Wang and Dong7 Consequently, the maximum permissible concentration-time weighted average and permissible concentration-short term exposure limit for diethyl ether are 300 mg/m3 (91 ppm) and 500 mg/m3 (151.1 ppm), respectively, in China. Reference Liu, Zhang, Yuan and Zuo5 Therefore, it is necessary to carry out real-time monitoring of this molecule.
To date, many methods have been devised for the detection of diethyl ether at the ppm or ppb level, such as gas chromatography (GC), Reference Scotter and Roberts8 GC/mass spectrometer (MS), Reference Hu, Xu, Jia, Lv, Li and Hou9 a surface acoustic wave method, Reference Lin and Shih10 a gas test-tube method, Reference Cao, Chen and Wang11 and chemiluminescence and cataluminescence methods. Reference Hu, Xu, Jia, Lv, Li and Hou9,Reference Cao, Wu, Chen, Peng and Liu12 However, these methods are associated with various disadvantages, being either expensive and/or time-consuming, requiring complex experimental apparatus or large instrument volume, or involving toxic solvents or reagents. Reference Scotter and Roberts8–Reference Cao, Wu, Chen, Peng and Liu12 On the other hand, gas sensors based on metal oxide semiconductors, such as SnO2, ZnO, and Fe2O3, have attracted much attention due to their unique features, such as low cost, high sensitivity, fast response, relative simplicity, and portability. Reference Volanti, Felix, Orlandi, Whitfield, Yang, Longo, Tuller and Varela13–Reference Li, Hsu and Chen15
It is well known that SnO2 is widely used as a gas-sensing material and that graphene has very good electrical conductivity and a large surface area. Many literature reports Reference Yin, Chen, Cui, Ge, Yang, Yu, Zhang, Zhang and Shao16–Reference Lin, Li and Yang18 have highlighted the excellent gas-sensing properties of SnO2/rGO materials. For example, Yin et al. Reference Yin, Chen, Cui, Ge, Yang, Yu, Zhang, Zhang and Shao16 studied the H2S-sensing properties of an SnO2/rGO sensor. The sensitivity (R a/R g) of the SnO2/rGO sensor reached 78 to 10 ppm H2S at 100 °C and its response time was 7 s. The authors also studied the selectivity of the sensor in H2, CH4, CO, SO2, and vapors of acetone, ethanol, isopropanol, methanol, methanol, and benzene, at the same concentration of 100 ppm and at 100 °C. The results showed that the SnO2/rGO sensor had good selectivity for H2S. Chang et al. Reference Chang, Yao, Wang, Luo, Li and Zhi17 studied the sensitivity of an SnO2/rGO gas sensor to ethanol and H2S at low concentrations. At 300 °C and 1.12 ppm H2S, the sensitivities (R a/R g) to ethanol and H2S were 22 and 11, respectively, and the response time and recovery time of the sensor were 5 s and 9 s, respectively. Lin et al. Reference Lin, Li and Yang18 studied the sensitivity of an SnO2/rGO gas sensor to NH3 at room temperature. The gas sensitivity was 15.9% to 50 ppm NH3. Reference Lin, Li and Yang18
To the best of our knowledge, there has been no literature report on the sensing of diethyl ether with SnO2/rGO gas-sensing material, although many reports have been concerned with the sensing of diethyl ether with other materials. Reference Wang, Yao, Wei, Zhang and Xue19–Reference Aizawa, Noda, Naganawa, Yamada, Yoshimoto, Reddy and Kurosawa24 For example, Wang et al. Reference Wang, Yao, Wei, Zhang and Xue19 studied the diethyl ether sensing properties of a P(St-AM)@Ag sensor and a gas sensitivity (R a/R g) of 3.12 was achieved at 16 °C. The lowest concentration detection limit and the response/recovery times were not specified. Ren Reference Ren20 studied the diethyl ether vapor sensing properties of SnO2–0.005% palladium asbestos, SnO2–0.005% CeO2, and ZnO–0.05% rare earth oxide sensors. The results showed that the gas sensitivities (I g/I a) were 3.2, 0.33, and 170, respectively, at a diethyl ether concentration of 0.05%. Again, the lowest concentration detection limit and the response/recovery times were not specified. Slobodian et al. Reference Slobodian, Riha, Lengalova, Svoboda and Saha21 reported the diethyl ether vapor sensing properties of various multiwalled carbon nanotube (MWCNT)-based sensors, specifically based on pure MWCNTs, oxidized MWCNTs, and sonicated MWCNTs. The gas sensitivities [(R g − R a)/R a × 100%] were about 21, 28, and 2.6%, respectively, at 25 °C at a volume concentration of 70.9%. The response times were 90–130 s and the recovery times were 200–260 s. Ma et al. Reference Ma, Guo, Lv, He and Feng22 studied the diethyl ether vapor sensing properties of an Ag/α-Fe2O3-based sensor. The gas sensitivity (R a/R g) was 3.0 at 260 °C and 100 ppm, and the response and recovery times were 5 s and 6 s, respectively. Zhao et al. Reference Zhao, Zhang, Wu, Wang, Deng and Dai23 reported diethyl ether gas sensitivities (R a/R g) for an SiC film of 1.1 (at 50 ppm) and 1.3 (at 400 ppm) at 250 °C. Aizawa et al. Reference Aizawa, Noda, Naganawa, Yamada, Yoshimoto, Reddy and Kurosawa24 reported a diethyl ether gas sensitivity (R a/R g) of a PP-HMDSO film of 4.5.
In this study, SnO2/rGO gas-sensing material has been prepared by a hydrothermal method and deployed for the sensing of diethyl ether vapor. The adsorption and reactions on the SnO2/rGO gas-sensing film have been studied by in situ diffuse-reflectance Fourier-transform infrared spectroscopy (DRIFTS).
II. EXPERIMENTAL
A. Preparation of SnO2/rGO powder
Graphene oxide (GO) and SnO2/rGO powder were prepared by a modified Hummer's method Reference Hummers and Offeman25,Reference Zhang26 and a hydrothermal method, Reference Chen27,Reference Zhang, Feng, Fei, Liu and Zhang28 respectively.
Graphite powder (25 μm) was first preoxidized. Concentrated H2SO4 (10 mL) was placed in a conical flask, and then P2O5 (2.0 g) and K2S2O8 (2.0 g) were added. The transparent solution was placed in a water bath at 80 °C, graphite powder (2.8 g) was added, and the mixture was stirred, whereupon a dark-blue color developed. The mixture was stirred for 4 h at 80 °C, then the water bath was removed and the mixture was allowed to cool naturally to room temperature. The mixture was then slowly and carefully poured into distilled water (500 mL) to dilute the strong acid solution. The resulting suspension was subjected to vacuum filtration, and the filter cake was repeatedly washed until the filtrate was of neutral pH. After washing, the filter cake was dried at 80 °C to obtain preoxidized graphite.
The preoxidized graphite powder was then oxidized to GO. For this, preoxidized graphite powder (2 g) and NaNO3 (1 g) were added to concentrated H2SO4 (46 mL) in a conical flask in an ice-water bath, and the mixture was stirred until it was uniform. KMnO4 (6 g) was then slowly added under intense mixing, ensuring that the temperature did not exceed 10 °C. After stirring for further 2.5 h, the ice-water bath was removed and the mixture was heated at 35 ± 3 °C for a further 30 min. Distilled water (92 mL) was then slowly added, resulting in bubbling, and the mixture was heated to 95 °C for 15 min. Further distilled water (280 mL) was added to obtain a uniform suspension. To this, 30% hydrogen peroxide (10 mL) was added to reduce the residual oxidant. After stirring and filtering, a brown residue was collected, which was successively washed with 5% hydrochloric acid solution and distilled water until no trace of sulfuric acid was detected in the filtrate (pH 7). The filter cake was thoroughly dried in an oven at 60 °C to obtain GO.
Having prepared GO, SnO2/rGO powder could then be produced. SnCl4·5H2O (0.216 g) and 1 mg/mL GO solution (4.5 mL) were added to distilled water (180 mL) and the mixture was stirred for 10 min. The suspension was transferred to a 100 mL Teflon-lined stainless steel autoclave and maintained at 180 °C for 12 h. Thereafter, it was allowed to cool naturally to room temperature. The mixture was centrifuged, and the collected solid was washed repeatedly to remove Cl−. It was then dried at 80 °C in an oven to afford SnO2/rGO powder.
B. Characterization of the SnO2/rGO powder
The SnO2/rGO powder was characterized by x-ray diffraction (XRD) on a X'Pert PRO diffractometer (PANalytical, Almelo, The Netherlands) using Cu-Kα radiation (λ = 0.15406 nm) with a 2θ scanning range of 10–90°. The morphology of the SnO2/rGO powder was examined by means of a transmission electron microscope (JEM-2100, JEOL Ltd., Tokyo, Japan). The specific surface area of the SnO2/rGO powder was tested by a fully automatic specific surface and pore analyzer (ASAP2020M, Micromeritics, Norcross, Georgia). Raman spectra were obtained on a LabRAM HR800 laser confocal Raman spectrometer (Horiba JobinYvon, Kyoto, Japan). Fourier transform infrared (FT-IR) spectra were obtained on a VERTEX 70 FTIR Spectrometer (Bruker Corporation, Ettlingen, Germany).
C. Measurement of diethyl ether gas-sensing properties
A gas-sensing paste was first obtained by grinding. For this, the prepared SnO2/rGO powder was mixed and ground with the requisite proportion of organic solution and ball-milled in an agate mortar for 3 h. A screen-printing technique was then used to print the paste onto an alumina substrate with preprinted Au interdigital electrodes. Thereafter, the alumina substrate with the printed SnO2/rGO paste (44.1 wt% SnO2, 15.9 wt% rGO, 21.24 wt% terpineol, 10.62 wt% butyl-carbitol-acetate, 3.54 wt% di-n-butyl phthalate, 2.4 wt% ethylcellulose, 1.6 wt% Span 85, 0.4 wt% butyrolactone, and 0.2 wt% hydrogenated castor oil) was sintered at 350 °C for 3 h. Finally, the alumina substrate with the printed SnO2/rGO gas-sensing material was aged at 250 °C for 3 days in air. The gas sensitivity of SnO2/rGO film to diethyl ether was tested with our in-house-constructed equipment. The detailed procedure is described in Ref. Reference Wang, Zhang and Zhang29. Gas sensitivity in this paper is defined as S = R a/R g, Reference Ma, Guo, Lv, He and Feng22,Reference Zhang, Feng, Fei, Liu and Zhang28 where R a and R g are the resistances of a sensor in air and in a test gas, respectively.
D. In situ DRIFTS study
The adsorption and reactions of diethyl ether on SnO2/rGO films were studied by in situ DRIFTS. All spectra were recorded at 350–400 °C on a VERTEX 70 FTIR spectrometer (Bruker) equipped with a liquid-nitrogen-cooled mercury cadmium telluride detector with a range of 3800–1000 cm−1 and a diffuse-reflectance accessory containing a controlled environment and temperature reflectance cell equipped with KBr windows. Spectra with a resolution of 4 cm−1 were obtained by averaging 128 scans and analyzed using OPUS software. Further details can be found in Ref. Reference Zhang, Huang, Yuan and Xie30. A gas stream (30 mL/min) of 200 ppm diethyl ether was introduced into the cell at 350, 380, or 400 °C, and spectra were recorded from the pretreated sample.
III. RESULTS AND DISCUSSION
A. Structural characterization
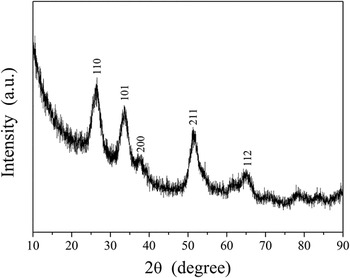
The XRD pattern is shown in Fig. 1. In Fig. 1, the diffraction peak position of SnO2/rGO is the same as that for SnO2, in accordance with previous literature reports. Reference Zhang, Feng, Fei, Liu and Zhang28,Reference Song, Zhang, He, Qu, Tian and Lv31 The (110), (101), (211), and (112) planes in Fig. 1 can be attributed to tetragonal rutile SnO2, indicating the formation of SnO2 crystals. Reference Zhang, Feng, Fei, Liu and Zhang28 However, no peaks can be attributed to graphene, which may be due to the following reasons: (i) self-reassembly of exfoliated graphite oxide or the reduction of GO by hydrothermal treatment, Reference Zhou, Bao, Tang, Zhong and Loh32,Reference Paek, Yoo and Honma33 (ii) interfacial bonds produced by SnO2 and rGO that form a disordered interfacial structure, Reference Song, Zhang, He, Qu, Tian and Lv31 or (iii) the disordered stacking of graphene sheets. Reference Song, Zhang, He, Qu, Tian and Lv31
XRD pattern of SnO2/rGO powder.

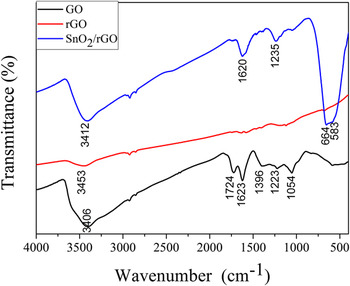
Figure 2 is the FT-IR spectra of GO, rGO, and SnO2/rGO, respectively. For GO, the absorption peak 3406 cm−1 is attributed to stretching vibration of O–H(ν(OH)) in hydroxide radical (–OH). Reference Zhang, Lei, Du, Yin, Chen, Li, Wang and Wang34 The –OH peak is produced due to the absorption of water in the air. Absorption bands at 1724 and 1223 cm−1 are ascribed to stretching vibration of C=O(ν(C=O)) and C–O(ν(C–O)) in –COOH Reference Lin, Li and Yang18,Reference Zhang, Lei, Du, Yin, Chen, Li, Wang and Wang34 ; band at 1623 cm−1 is assigned to stretching vibration of C=C(ν(C=C)); band at 1396 cm−1 is corresponding to in-plane bending vibration of O–H(β(OH)) in–OH; 1054 cm−1 is attributed to stretching vibration of C–O(ν(C–O)) in C–O–C. Reference Zhang, Lei, Du, Yin, Chen, Li, Wang and Wang34 These peaks are produced due to oxygen-containing functional group in GO. For rGO, absorption band assigned to stretching vibration of C=O(ν(C=O)) in –COOH at 1724 cm−1 is disappeared, and band at 3453 cm−1 appears a weak peak, this is due to the O–H band vibration in absorbed water molecules. There are no other obvious absorption bands, so most of the GO is reduced. Reference Lin, Li and Yang18 For SnO2/rGO, band at 3412 cm−1 is attributed to the vibration of hydroxyl (–OH), which belongs to the absorbed water molecules in air. Peak at 1620 cm−1 is assigned to stretching vibration of C=C(ν(C=C)); 1235 cm−1 is ascribed to stretching vibration of C–O(ν(C–O)). Reference Zhang, Lei, Du, Yin, Chen, Li, Wang and Wang34 This shows that small fraction of the GO is not reduced. Reference Hu, Yang, Wang, Zhang, Wang, Huang, Wei, Wei and Zhang35 The Sn–O–Sn vibration appears in the range of 400–700 cm−1. Reference Li, Shen, Zhang, Fang and Zu36 Peaks at ν = 664 and 583 cm−1 are ascribed to Sn–O–Sn antisymmetric vibrations. These peaks are proved the existence of SnO2 in SnO2/rGO.
The FT-IR spectra of GO, rGO, and SnO2/rGO.

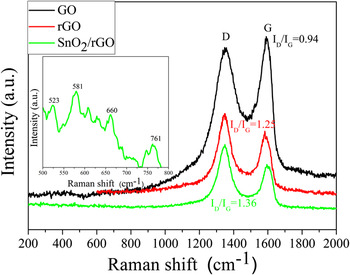
Figure 3 shows the Raman spectra of GO, rGO, and SnO2/rGO, respectively. For GO, the D peak is seen at 1337 cm−1 and the G peak is seen at 1597 cm−1. Reference Lin, Li and Yang18 The D peak reflects the degree of defects and disorder of the hexagonal graphite. The G peak corresponds to the E2g vibration of graphite, and reflects the sp2 hybridization of the two-dimensional hexagonal array of carbon atoms. Reference Zhang, Lei, Du, Yin, Chen, Li, Wang and Wang34 For rGO, the D peak appears at 1341 cm−1 and the G peak appears at 1593 cm−1. For the SnO2/rGO powder, the D peak was seen at 1349 cm−1 and the G peak was seen at 1594 cm−1. Reference Lin, Li and Yang18 The ratio I D/I G is related to the degree of reduction of GO. Reference Zhang, Lei, Du, Yin, Chen, Li, Wang and Wang34,Reference Zhang37 The I D/I G of GO was 0.94, whereas those of I D/I G of rGO and SnO2/rGO were increased to 1.25 and 1.36, respectively (Fig. 3), confirming that GO had been reduced. In addition, the spectrum of SnO2 displays a weak peak in the range of 500–800 cm−1. Reference Lin, Li and Yang18,Reference Das, Bonu, Prasad, Panda, Dhara and Tyagi38–Reference Bonu, Das, Amirthapandian, Dharaa and Tyagia40 The inset is SnO2/rGO Raman spectra between 500 and 800 cm−1. The peaks at 523, 581, 660, and 761 cm−1 have proved the existence of SnO2 in SnO2/rGO. Reference Das, Bonu, Prasad, Panda, Dhara and Tyagi38–Reference Bonu, Das, Amirthapandian, Dharaa and Tyagia40
Raman spectra of GO, rGO, and SnO2/rGO powder.

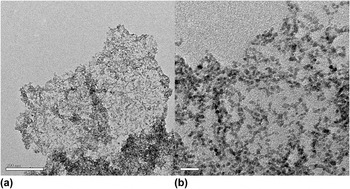
An TEM image of the SnO2/rGO powder is shown in Fig. 4. In Fig. 4, it can be seen that SnO2 particles were distributed on the rGO.
TEM image of SnO2/rGO powder: (a) whole, (b) local.

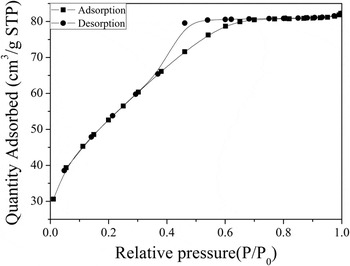
From Figs. 1–4, it is evident that SnO2 nanoparticles with rutile structure were dispersed on the thin rGO film. Figure 5 shows the typical nitrogen adsorption and desorption isotherms of the SnO2/rGO powder. According to the International Union of Pure and Applied Chemistry, a physical adsorption isotherm is classified as type IV. The specific surface area of the SnO2/rGO powder was calculated as 187 m2/g, larger than that in Ref. Reference Lin, Li and Yang18. This large specific surface area is beneficial for the diethyl ether vapor sensing properties of the SnO2/rGO powder.
Typical nitrogen adsorption and desorption isotherms of SnO2/rGO powder.

B. Gas-sensing properties of SnO2/rGO sensor arrays
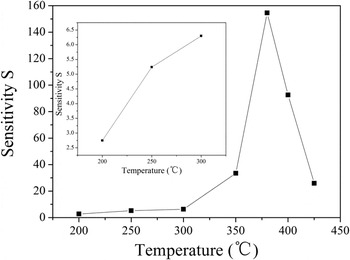
Figure 6 shows a plot of the effect of operating temperature on the gas sensitivity of the SnO2/rGO sensor to 200 ppm diethyl ether. The gas sensitivity increases with increasing operating temperature, and reaches a maximum value of 154.57 at 380 °C. This phenomenon is very common and can be seen in many literature reports. Reference Yin, Chen, Cui, Ge, Yang, Yu, Zhang, Zhang and Shao16,Reference Zhang, Huang, Yuan and Xie30,Reference Lee, Chang and Kim41 The reason is that the adsorption mode of oxygen molecules changes from physisorption at lower temperature to chemisorption at higher temperature. Reference Zhang, Huang, Yuan and Xie30 The amount of chemically adsorbed diethyl ether increases with increasing working temperature, which traps more electrons from the conduction band and causes a larger change in the resistance. The adsorption reaches a dynamic equilibrium of absorption–desorption at a certain temperature (380 °C in the present case) because the chemisorption is an exothermic reaction. If the working temperature is increased further, the reactants begin to desorb in large quantities. Reference Zhang, Huang, Yuan and Xie30 Hence beyond 380 °C, the amount of adsorbed diethyl ether molecules will progressively decrease, and the balance will move towards desorption, resulting in a decreased gas sensitivity above this temperature (Fig. 6). The reactions of adsorption of O2 (Ref. Reference Huang, Kong, Yuan and Xie42) and diethyl ether during this process may be described as follows:
 $${{\rm{O}}_2}\left( {\rm{g}} \right) \;⇋\; {{\rm{O}}_2}\left( {{\rm{ads}}} \right)$$
 $${{\rm{O}}_2}\left( {{\rm{ads}}} \right) + {{\rm{e}}^ - } \;⇋\; {{{\rm{O}}_{\rm{2}}}}\nolimits^ - \left( {{\rm{ads}}} \right)$$
 $$\mathop {{\rm{O}}_{\rm{2}} }\nolimits^ - \left( {{\rm{ads}}} \right) + {\rm{e}}^ - \;⇋\; 2{\rm{O}}^ - \left( {{\rm{ads}}} \right)$$
 $${{\rm{O}}^ - }\left( {{\rm{ads}}} \right) + {{\rm{e}}^ - } \;⇋\; {\rm{O}}\nolimits^{2 - } \left( {{\rm{ads}}} \right)$$
 $${{\rm{C}}_{\rm{2}}}{{\rm{H}}_{\rm{5}}}{\rm{O}}{{\rm{C}}_{\rm{2}}}{{\rm{H}}_{\rm{5}}}\left( {{\rm{ads}}} \right) + 12{{\rm{O}}^{2 - }}\left( {{\rm{ads}}} \right) \;⇋\; {\rm{5}}{{\rm{H}}_{\rm{2}}}{\rm{O + 4C}}{{\rm{O}}_{\rm{2}}} + 24{{\rm{e}}^ - }$$
Effect of operating temperature on the gas sensitivity of the SnO2/rGO sensor to 200 ppm diethyl ether.

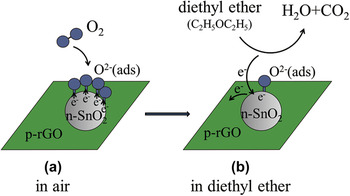
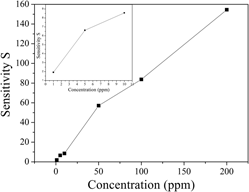
Figure 7 shows the relationship between the gas sensitivity of the SnO2/rGO sensor and the concentration of diethyl ether. As shown in Fig. 7, the gas sensitivity is dependent on the concentration of diethyl ether from 1 to 200 ppm, and increases with the increase of concentration at the optimal operating temperature of 380 °C. This phenomenon is also very common and can be seen in many literature reports. Reference Yin, Chen, Cui, Ge, Yang, Yu, Zhang, Zhang and Shao16,Reference Zhang, Zou, Song, Yu, Chen and Hu43 The gas sensitivity of the SnO2/rGO sensor was 1.92 at 1 ppm and 380 °C, and increased to 154.57 at 200 ppm and 380 °C. That is to say, the lowest detection limit of the SnO2/rGO sensor to diethyl ether can reach 1 ppm, which meets the demand for real-time monitoring of this molecule. Reference Liu, Zhang, Yuan and Zuo5 The high gas sensitivity of the SnO2/rGO sensor may be related to its large specific surface area (187 m2/g) and the good electrical conductivity of rGO. Reference Wang, Li, Chen, He, Zheng, Liu and Qi44 As an n-type semiconductor, the SnO2 surface forms an electron depletion layer when negative oxygen ions are adsorbed thereon at the working temperature. This increases the surface potential barrier and the resistance. When diethyl ether molecules reach the gas-sensing material surface, the adsorbed negative oxygen ions are consumed and free electrons are produced. Hence, the resistance of the material is reduced. In the absence of diethyl ether, the resistance is recovered. The change in resistance thus provides a sensitive means of detection. The addition of rGO forms a p–n heterojunction (Fig. 8) and imparts high charge carrier mobility and enhanced electronic transmission ability, and so the reactions are more likely to happen. rGO also increases the surface area of the material, thereby facilitating molecular adsorption, gas diffusion, and mass transport. Furthermore, the interface of SnO2 and rGO forms a forward-biased Schottky barrier, which promotes capture and migration of electrons from the conduction band. Hence, the addition of rGO improves the sensitivity and the response and recovery times. Reference Zhang, Zou, Song, Yu, Chen and Hu45,Reference Chang, Yao, Wang, Luo, Li and Zhi46
Gas sensitivity of the SnO2/rGO sensor versus diethyl ether concentration (1–200 ppm) at 380 °C.

Schematic model on gas sensing mechanism of SnO2/rGO gas sensor to diethyl ether.

The response and recovery times of the SnO2/rGO sensor to 1 ppm and 200 ppm diethyl ether are illustrated in Fig. 9. From Fig. 9, it can be seen that these parameters were 70 and 98 s, respectively, at 1 ppm diethyl ether, and 64 and 51 s, respectively, at 200 ppm diethyl ether.
Response and recovery curve of the SnO2/rGO sensor to 200 ppm diethyl ether at 380 °C (inset: corresponding curve at 1 ppm diethyl ether).

C. In situ DRIFTS study
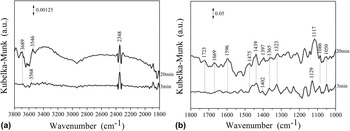
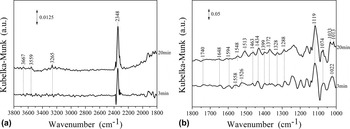
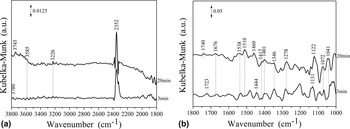
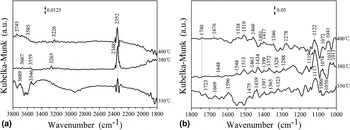
Figures 10–12 show the DRIFTS spectra obtained at different temperatures (350, 380, and 400 °C) and 200 ppm diethyl ether. The infrared (IR) assignments of diethyl ether adsorption on the SnO2/rGO film at different temperatures are given in Table I.
DRIFTS spectra of 200 ppm diethyl ether adsorption on an SnO2/rGO film at 350 °C: (a) 3800–1800 cm−1, (b) 1800–1000 cm−1.

DRIFTS spectra of 200 ppm diethyl ether adsorption on an SnO2/rGO film at 380 °C: (a) 3800–1800 cm−1, (b) 1800–1000 cm−1.

DRIFTS spectra of 200 ppm diethyl ether adsorption on an SnO2/rGO film at 400 °C: (a) 3800–1800 cm−1, (b) 1800–1000 cm−1.

IR assignments of diethyl ether adsorption on an SnO2/rGO film at different temperatures.

Figure 10 shows the DRIFTS spectra of 200 ppm diethyl ether adsorption on the SnO2/rGO film at 350 °C. The absorption peaks at ν = 1129 and 1117 cm−1 can be ascribed to the C–O–C stretching vibration ν(C–O–C) of diethyl ether, confirming its adsorption on the surface. The absorption band at ν = 1050 cm−1 is a C–C stretching vibration ν(C–C), that at ν = 1086 cm−1 is a C–O stretching vibration ν(C–O), that at ν = 1475 cm−1 is a CH2 deformation vibration δ(CH2), and those at ν = 1402 and 1397 cm−1 are CH3 deformation vibrations δ(CH3). These bands can be attributed to the intermediate products ethyl
 $\left( {{\rm{C}}{{\rm{H}}_{\rm{3}}}\mathop {{\rm{C}}{{\rm{H}}_{\rm{2}}}}\nolimits^ \cdot } \right)$
and oxethyl
 $\left( {{\rm{C}}{{\rm{H}}_{\rm{3}}}{\rm{C}}{{\rm{H}}_2}{{\rm{O}}^ \cdot }} \right)$
. The band at ν = 1669 cm−1 is a C=C stretching vibration ν(C=C), and those at ν = 1439 and 1323 cm−1 are deformation vibrations δ(CH2) and δ(CH) of ethylene (C2H4). The absorption band at 1723 cm−1 is a C=O stretching vibration ν(C=O) of an aldehyde (HCHO or CH3CHO), and that at ν = 1365 cm−1 is a C–CHO stretching vibration ν(C–CHO).
Reference Yasunaga, Gillespie, Simmie, Curran, Kuraguchi, Hoshikawa, Yamane and Hidaka50
In addition, bands at ν = 3689, 3568, and 3546 cm−1 can be assigned as the stretching vibrations of H2O molecules ν(H2O), that at ν = 1596 cm−1 is a deformation vibration of H2O molecules δ(H2O), and that at ν = 2348 cm−1 can be assigned as a CO2 stretching vibration ν(CO2). The intensity of the CO2 peak at 20 min was higher than that at 3 min, indicating that the production of CO2 progressively increased.
Possible equations describing the process may be written as follows: Reference Yasunaga, Gillespie, Simmie, Curran, Kuraguchi, Hoshikawa, Yamane and Hidaka50
 $${\rm{C}}{{\rm{H}}_{\rm{3}}}{\rm{C}}{{\rm{H}}_{\rm{2}}}{\rm{OC}}{{\rm{H}}_{\rm{2}}}{\rm{C}}{{\rm{H}}_{\rm{3}}}\left( {\rm{g}} \right) \to {\rm{C}}{{\rm{H}}_{\rm{3}}}{\rm{C}}{{\rm{H}}_{\rm{2}}}{\rm{OC}}{{\rm{H}}_{\rm{2}}}{\rm{C}}{{\rm{H}}_{\rm{3}}}\left( {{\rm{ads}}} \right)$$
 $${\rm{C}}{{\rm{H}}_3}{\rm{C}}{{\rm{H}}_{\rm{2}}}{\rm{OC}}{{\rm{H}}_{\rm{2}}}{\rm{C}}{{\rm{H}}_{\rm{3}}}\left( {{\rm{ads}}} \right) + {{{\rm{Sn}}{{\rm{O}}_{\rm{2}}}} \mathord{\left/ {\vphantom {{{\rm{Sn}}{{\rm{O}}_{\rm{2}}}} {{\rm{rGO}}}}} \right. \kern-\nulldelimiterspace} {{\rm{rGO}}}} \to {\rm{C}}{{\rm{H}}_{\rm{3}}}\mathop {{\rm{C}}{{\rm{H}}_{\rm{2}}}}\nolimits^ \cdot + {\rm{C}}{{\rm{H}}_{\rm{3}}}{\rm{C}}{{\rm{H}}_{\rm{2}}}{{\rm{O}}^ \cdot } + {{{\rm{Sn}}{{\rm{O}}_{\rm{2}}}} \mathord{\left/ {\vphantom {{{\rm{Sn}}{{\rm{O}}_{\rm{2}}}} {{\rm{rGO}}}}} \right. \kern-\nulldelimiterspace} {{\rm{rGO}}}}$$
 $${\rm{C}}{{\rm{H}}_{\rm{3}}}\mathop {{\rm{C}}{{\rm{H}}_{\rm{2}}}}\nolimits^ \cdot \to {{\rm{C}}_{\rm{2}}}{{\rm{H}}_{\rm{4}}} + {{\rm{H}}^ \cdot }$$
 $${\rm{C}}{{\rm{H}}_{\rm{3}}}{\rm{C}}{{\rm{H}}_{\rm{2}}}{{\rm{O}}^ \cdot } \to {\rm{C}}{{\rm{H}}_{\rm{3}}}{\rm{CHO}} + {{\rm{H}}^ \cdot }$$
 $${\rm{C}}{{\rm{H}}_{\rm{3}}}{\rm{C}}{{\rm{H}}_{\rm{2}}}{{\rm{O}}^ \cdot } \to {\rm{HCHO}} + \mathop {{\rm{C}}{{\rm{H}}_{\rm{3}}}}\nolimits^ \cdot$$
 $${{\rm{C}}_{\rm{2}}}{{\rm{H}}_{\rm{4}}} + 6{{\rm{O}}^{{\rm{2}} - }} \to 2{{\rm{H}}_{\rm{2}}}{\rm{O}} + 2{\rm{C}}{{\rm{O}}_{\rm{2}}} + 1{\rm{2}}{{\rm{e}}^ - }$$
 $${\rm{C}}{{\rm{H}}_{\rm{3}}}{\rm{CHO}} + 5{{\rm{O}}^{{\rm{2}} - }} \to 2{{\rm{H}}_{\rm{2}}}{\rm{O}} + 2{\rm{C}}{{\rm{O}}_{\rm{2}}} + {\rm{10}}{{\rm{e}}^ - }$$
 $${\rm{HCHO}} + 2{{\rm{O}}^{{\rm{2}} - }} \to {{\rm{H}}_{\rm{2}}}{\rm{O}} + {\rm{C}}{{\rm{O}}_{\rm{2}}} + {\rm{4}}{{\rm{e}}^ - }$$
Figure 11 shows the DRIFTS spectra of 200 ppm diethyl ether adsorption on the SnO2/rGO film at the optimal temperature of 380 °C. Compared to Fig. 10, the peak intensities of CO2 are enhanced and some new peaks are apparent. The peak at ν = 1119 cm−1 is the C–O–C stretching vibration ν(C–O–C) of diethyl ether. The absorption bands at ν = 1033, 1022, and 1013 cm−1 are C–C stretching vibrations ν(C–C), that at ν = 1074 cm−1 is a C–O stretching vibration ν(C–O), and those at ν = 1463 and 1399 cm−1 can be assigned to CH2 and CH3 deformation vibrations δ(CH2) and δ(CH3), respectively. These features can be attributed to the intermediate products ethyl
 $\left( {{\rm{C}}{{\rm{H}}_{\rm{3}}}\mathop {{\rm{C}}{{\rm{H}}_{\rm{2}}}}\nolimits^ \cdot } \right)$
and oxethyl
 $\left( {{\rm{C}}{{\rm{H}}_{\rm{3}}}{\rm{C}}{{\rm{H}}_2}{{\rm{O}}^ \cdot }} \right)$
. The bands at ν = 1648 cm−1 is a C=C stretching vibration ν(C=C), and those at ν = 1399 and 1288 cm−1 are deformation vibrations δ(CH2) and δ(CH) of ethylene (C2H4). The absorption band at ν = 1740 cm−1 is a C=O stretching vibration ν(C=O) of an aldehyde (HCHO or CH3CHO), and that at ν = 1434 cm−1 is a C–CHO stretching vibration ν(C–CHO). New absorption peaks, compared to Fig. 10, appear at ν = 3265 cm−1 attributable to an O–H stretching vibration ν(O–H), at ν = 1119 cm−1 attributable to a C–O stretching vibration ν(C–O), and at ν = 1328 cm−1 attributable to an O–H deformation vibration δ(O–H). These features can all be assigned to the intermediate product ethanol. The peaks at ν = 1399 and 1372 cm−1 are characteristic absorptions of the –CH3 moiety of ethanol. The peaks at ν = 3667 and 3559 cm−1 can be assigned to stretching vibrations of H2O molecules ν(H2O), those at ν = 1594, 1558, 1548, 1526, and 1513 cm−1 are deformation vibrations of H2O molecules δ(H2O), and that at ν = 2348 cm−1 is a CO2 stretching vibration ν(CO2). The intensity of the CO2 peak at 20 min, as at 350 °C, is also higher than that at 3 min.
Figure 12 shows the DRIFTS spectra of 200 ppm diethyl ether adsorption on the SnO2/rGO film at 400 °C. The bands at ν = 1131 and 1122 cm−1 are C–O–C stretching vibrations ν(C–O–C) of diethyl ether. The band at ν = 1041 cm−1 is a C–C stretching vibration ν(C–C), that at ν = 1072 cm−1 is a C–O stretching vibration ν(C–O), and those at ν = 1460 and 1444 cm−1 are CH2 deformation vibrations δ(CH2) of the intermediate products ethyl
 $\left( {{\rm{C}}{{\rm{H}}_{\rm{3}}}\mathop {{\rm{C}}{{\rm{H}}_{\rm{2}}}}\nolimits^ \cdot } \right)$
and oxethyl
 $\left( {{\rm{C}}{{\rm{H}}_{\rm{3}}}{\rm{C}}{{\rm{H}}_2}{{\rm{O}}^ \cdot }} \right)$
. The band at ν = 1676 cm−1 is a C=C stretching vibration ν(C=C), and those at ν = 1417 and 1278 cm−1 are deformation vibrations δ(CH2) and δ(CH) of ethylene(C2H4). The bands at ν = 1740 and 1723 cm−1 are C=O stretching vibrations ν(C=O) of aldehydes (HCHO or CH3CHO), and that at ν = 1401 cm−1 is a C–CHO stretching vibration ν(C–CHO). The band at ν = 3226 cm−1 is an O–H stretching vibration ν(O–H), that at ν = 1122 cm−1 is a C–O stretching vibration ν(C–O), and that at 1346 cm−1 is an O–H deformation vibration δ(O–H). These features can all be ascribed to the intermediate product ethanol. The bands at ν = 3780, 3745, and 3585 cm−1 can be assigned to stretching vibrations of H2O molecules ν(H2O), those at ν = 1538 and 1510 cm−1 are deformation vibrations of H2O molecules δ(H2O), and that at ν = 2352 cm−1 is a CO2 stretching vibration ν(CO2).
A possible reaction mechanism for the fate of diethyl ether at 380 °C and 400 °C may be written as follows: Reference Yasunaga, Gillespie, Simmie, Curran, Kuraguchi, Hoshikawa, Yamane and Hidaka50
 $${\rm{C}}{{\rm{H}}_{\rm{3}}}{\rm{C}}{{\rm{H}}_{\rm{2}}}{\rm{OC}}{{\rm{H}}_{\rm{2}}}{\rm{C}}{{\rm{H}}_{\rm{3}}}\left( {\rm{g}} \right) \to {\rm{C}}{{\rm{H}}_{\rm{3}}}{\rm{C}}{{\rm{H}}_{\rm{2}}}{\rm{OC}}{{\rm{H}}_{\rm{2}}}{\rm{C}}{{\rm{H}}_{\rm{3}}}\left( {{\rm{ads}}} \right)$$
 $${\rm{C}}{{\rm{H}}_3}{\rm{C}}{{\rm{H}}_{\rm{2}}}{\rm{OC}}{{\rm{H}}_{\rm{2}}}{\rm{C}}{{\rm{H}}_{\rm{3}}}\left( {{\rm{ads}}} \right) + {{{\rm{Sn}}{{\rm{O}}_{\rm{2}}}} \mathord{\left/ {\vphantom {{{\rm{Sn}}{{\rm{O}}_{\rm{2}}}} {{\rm{rGO}}}}} \right. \kern-\nulldelimiterspace} {{\rm{rGO}}}} \to {\rm{C}}{{\rm{H}}_{\rm{3}}}\mathop {{\rm{C}}{{\rm{H}}_{\rm{2}}}}\nolimits^ \cdot + {\rm{C}}{{\rm{H}}_{\rm{3}}}{\rm{C}}{{\rm{H}}_{\rm{2}}}{{\rm{O}}^ \cdot } + {{{\rm{Sn}}{{\rm{O}}_{\rm{2}}}} \mathord{\left/ {\vphantom {{{\rm{Sn}}{{\rm{O}}_{\rm{2}}}} {{\rm{rGO}}}}} \right. \kern-\nulldelimiterspace} {{\rm{rGO}}}}$$
 $${\rm{C}}{{\rm{H}}_{\rm{3}}}{\rm{C}}{{\rm{H}}_{\rm{2}}}{\rm{OC}}{{\rm{H}}_{\rm{2}}}{\rm{C}}{{\rm{H}}_{\rm{3}}}{\rm{(ads)}} + {\rm{Sn}}{{\rm{O}}_{\rm{2}}}{\rm{/rGO}} \to {\rm{C}}{{\rm{H}}_{\rm{3}}}{\rm{C}}{{\rm{H}}_{\rm{2}}}{\rm{OH}} + {{\rm{C}}_{\rm{2}}}{{\rm{H}}_{\rm{4}}} + {\rm{Sn}}{{\rm{O}}_{\rm{2}}}{\rm{/rGO}}$$
 $${\rm{C}}{{\rm{H}}_{\rm{3}}}\mathop {{\rm{C}}{{\rm{H}}_{\rm{2}}}}\nolimits^ \cdot \to {{\rm{C}}_{\rm{2}}}{{\rm{H}}_{\rm{4}}} + {{\rm{H}}^ \cdot }$$
 $${\rm{C}}{{\rm{H}}_{\rm{3}}}{\rm{C}}{{\rm{H}}_{\rm{2}}}{{\rm{O}}^ \cdot } \to {\rm{C}}{{\rm{H}}_{\rm{3}}}{\rm{CHO}} + {{\rm{H}}^ \cdot }$$
 $${\rm{C}}{{\rm{H}}_{\rm{3}}}{\rm{C}}{{\rm{H}}_{\rm{2}}}{{\rm{O}}^ \cdot } \to {\rm{HCHO}} + \mathop {{\rm{C}}{{\rm{H}}_{\rm{3}}}}\nolimits^ \cdot$$
 $${{\rm{C}}_{\rm{2}}}{{\rm{H}}_{\rm{4}}} + 6{{\rm{O}}^{{\rm{2}} - }} \to 2{{\rm{H}}_{\rm{2}}}{\rm{O}} + 2{\rm{C}}{{\rm{O}}_{\rm{2}}} + 1{\rm{2}}{{\rm{e}}^ - }$$
 $${\rm{C}}{{\rm{H}}_{\rm{3}}}{\rm{CHO}} + 5{{\rm{O}}^{{\rm{2}} - }} \to 2{{\rm{H}}_{\rm{2}}}{\rm{O}} + 2{\rm{C}}{{\rm{O}}_{\rm{2}}} + {\rm{10}}{{\rm{e}}^ - }$$
 $${\rm{HCHO}} + 2{{\rm{O}}^{{\rm{2}} - }} \to {{\rm{H}}_{\rm{2}}}{\rm{O}} + {\rm{C}}{{\rm{O}}_{\rm{2}}} + {\rm{4}}{{\rm{e}}^ - }$$
 $${\rm{C}}{{\rm{H}}_{\rm{3}}}{\rm{C}}{{\rm{H}}_{\rm{2}}}{\rm{OH}} + 6{{\rm{O}}^{{\rm{2}} - }} \to 3{{\rm{H}}_{\rm{2}}}{\rm{O}} + 2{\rm{C}}{{\rm{O}}_{\rm{2}}} + 1{\rm{2}}{{\rm{e}}^ - }$$
Figure 13 shows the DRIFTS spectra of 200 ppm diethyl ether adsorption on the SnO2/rGO film after 20 min at different temperatures. From Fig. 13, it can be seen that the H2O and CO2 peaks at 380 °C were more intense than at 350 °C or 400 °C. A new absorption band, at ν = 3265 cm−1 at 380 °C and at ν = 3226 cm−1 at 400 °C, compared to the spectrum at 350 °C, can be attributed to the ν(OH) of ethanol. Moreover, the band at ν = 1119 cm−1, attributable to ν(C–O) of ethanol is seen to be most intense at 380 °C, implying more ethanol production at this temperature. Bands attributable to ν(C–C) of
 ${\rm{C}}{{\rm{H}}_{\rm{3}}}\mathop {{\rm{C}}{{\rm{H}}_{\rm{2}}}}\nolimits^ \cdot$
and
 ${\rm{C}}{{\rm{H}}_{\rm{3}}}{\rm{C}}{{\rm{H}}_2}{{\rm{O}}^ \cdot }$
are also more intense at 380 °C than at 350 °C or 400 °C. This result is consistent with the change in the gas-sensing properties (Fig. 6), that is, the maximum amounts of CO2 and H2O are produced at 380 °C due to maximum diethyl ether absorption, and the gas sensitivity at 380 °C is accordingly the highest.
DRIFTS spectra of 200 ppm diethyl ether adsorption on an SnO2/rGO film after 20 min at different temperatures: (a) 3800–1800 cm−1, (b) 1800–1000 cm−1.

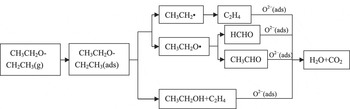
According to the results of the DRIFTS spectra (Figs. 10–12), we can speculate that when the SnO2/rGO film was exposed to diethyl ether, molecules were initially adsorbed on its surface. The adsorbed diethyl ether molecules then decomposed and generated the intermediate products
 ${\rm{C}}{{\rm{H}}_{\rm{3}}}\mathop {{\rm{C}}{{\rm{H}}_{\rm{2}}}}\nolimits^ \cdot$
,
 ${\rm{C}}{{\rm{H}}_{\rm{3}}}{\rm{C}}{{\rm{H}}_2}{{\rm{O}}^ \cdot }$
, CH3CH2OH, and C2H4. Of these,
 ${\rm{C}}{{\rm{H}}_{\rm{3}}}\mathop {{\rm{C}}{{\rm{H}}_{\rm{2}}}}\nolimits^ \cdot$
and
 ${\rm{C}}{{\rm{H}}_{\rm{3}}}{\rm{C}}{{\rm{H}}_2}{{\rm{O}}^ \cdot }$
reacted further to produce C2H4, HCHO, and CH3CHO. These intermediate products further react with oxygen anions on the surface to generate H2O and CO2 as the reaction time increased from 3 min to 20 min. Thus, a simplified reaction scheme of the fate of diethyl ether molecules on an SnO2/rGO film may be proposed, as shown in Fig. 14. The reaction path is the same as that in literature reports.
Reference Hu, Xu, Jia, Lv, Li and Hou9,Reference Yasunaga, Gillespie, Simmie, Curran, Kuraguchi, Hoshikawa, Yamane and Hidaka50
Mechanism of diethyl ether adsorption and reactions on an SnO2/rGO film.

IV. CONCLUSION
An SnO2/rGO diethyl ether gas sensor has been successfully fabricated by a screen-printing technique based on SnO2/rGO powder prepared by a hydrothermal method. The gas sensitivity of the obtained SnO2/rGO sensor to 1 ppm and 200 ppm diethyl ether reached 1.92 and 154.57 at 380 °C, respectively. DRIFTS spectra revealed that ethyl
 $\left( {{\rm{C}}{{\rm{H}}_{\rm{3}}}\mathop {{\rm{C}}{{\rm{H}}_{\rm{2}}}}\nolimits^ \cdot } \right)$
, oxethyl
 $\left( {{\rm{C}}{{\rm{H}}_{\rm{3}}}{\rm{C}}{{\rm{H}}_2}{{\rm{O}}^ \cdot }} \right)$
, CH3CH2OH, HCHO, CH3CHO, C2H4, H2O, CO2, and molecularly adsorbed diethyl ether surface species were formed during the interaction of diethyl ether with the SnO2/rGO film at different temperatures. The mechanism of the reaction process may promote the development of improved gas sensors for diethyl ether, which may offer ultra-high detection capabilities for such organic molecules.
ACKNOWLEDGMENT
This work was supported by the Natural Science Foundation of Hubei Province, China (Grant No. 2014CFB1009), and the Opening Project (2015-KF-6) of State Key Laboratory of Advanced Technology for Materials Synthesis and Processing (Wuhan University of Technology). The authors are also grateful to Analytical and Testing Center of Huazhong University of Science and Technology.