I. INTRODUCTION
Thin film structures are widely used in many technologically important applications, including microelectronic and optoelectronic devices, magnetic data storage, medical devices, and many more. The reliability of the interface between the film and substrate is a critical issue because interfacial delamination may lead to a system failure, even though the film does not fail.Reference Malzbender, den Toonder, Balkenende and de With1, Reference Kriese, Boismier, Moody and Gerberich2 Due to the limitations of the film and interface dimensions, the interfacial adhesion properties are difficult to measure using conventional mechanical testing techniques, e.g., tensile and bending tests. Nanoindentation techniques, such as spherical indentation, conical indentation, and wedge indentation, have been proven to be very effective in thin film interfacial adhesion measurements.Reference Volinsky and Gerberich3, Reference Li and Bhushan4 Compared to the spherical and conical tips, the wedge indenter can produce a high driving force, and thus, it may not need to penetrate the substrate to induce a crack in the interface. In addition, the interface crack is relatively easy to observe from the surfaces in addition to the wedge indentation impression; thus, it is simple to interpret experimental phenomena. Therefore, a wedge indenter is considered a potentially powerful experimental method to determine interfacial adhesion properties.Reference Drory and Hutchinson5–Reference Begley, Mumm, Evans and Hutchinson8
When a wedge indenter penetrates the surface of a thin soft film on a hard substrate, the film material around the indenter is delaminated due to the mismatch between the substrate and the film deformation.Reference Begley, Mumm, Evans and Hutchinson8, Reference Marshall and Evans9 One of the methods used to evaluate interfacial adhesion properties is to measure the area of the delaminated zone to quantitatively assess the interfacial toughness. For this soft-film hard-substrate (SFHS) system with a brittle interface, de Boer and GerberichReference de Boer and Gerberich11, Reference de Boer and Gerberich12 followed the analysis originally developed by Marshall et al. for conical indentationReference Marshall and Evans9, Reference Rossington, Evans, Marshall and Khuri-Yakub10 and have developed an analytical analysis for microwedge indentation tests on thin lines. In their analysis, the energy release rate G at crack stability, i.e., the interfacial toughness Γi = G for both the no buckling and buckling cases, can be written as follows:
 $$<![CDATA[$$G = \left\{ \matrix{ {{t_{\rm{f}} {\rm{\sigma }}_0^2 } \over {2E_{\rm{f}}^* }}\,\,\,\,\,\,\,\,\,\,\,\,\,\,\,\,\,\,\,\,\,\,\,\,\,\,\,\,\,\,\,\,\,\,\,\,\,\,\,\,\,\,\,\,\,\,{\rm{no}}\;{\rm{buckling}} \hfill \cr {{t_{\rm{f}} } \over {2E_{\rm{f}}^* }}[4{\rm{\sigma }}_0 {\rm{\sigma }}_{\rm{c}} - 3({\rm{\sigma }}_{\rm{c}} )^2 ]\,\,\,\,\,{\rm{buckling}} \hfill \cr} \right.\quad,$$
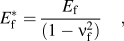
where the effective film elastic modulus,  $E_{\rm{f}}^* $, is given by the following equation:
 $$<![CDATA[$$E_{\rm{f}}^* = {{E_{\rm{f}} } \over {(1 - \nu _{\rm{f}}^2 )}}\quad,$$
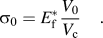
where E f is the film modulus and ν f is Poisson’s ratio of the film. In addition, the indentation-induced stress σ0 is expressed in terms of the ratio of the indentation deformation volume V 0 to the volume of film materials above the interfacial delamination crack V c in a general form proposed by Yeap et al.Reference Yeap, Zeng, Jiang, Shen and Chi13, Reference Yeap, Zeng and Chi14 as follows:
 $$<![CDATA[$${\rm{\sigma }}_0 = E_{\rm{f}}^* {{V_0 } \over {V_{\rm{c}} }}\quad.$$
By assuming that the material in the plastic zone is confined to the area near the wedge tip and that the volume displaced is conservative, the indentation volume is then given as follows:
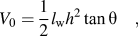 $$<![CDATA[$$V_0 = {1 \over 2}l_{\rm{w}} h^2 \tan {\rm{\theta }}\quad,$$
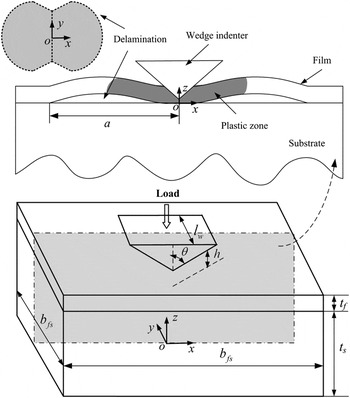
where h is the indentation depth, l w is the length of the wedge tip, and 2θ is the inclination angle of the wedge indenter tip (Fig. 1).
Schematic diagram showing a typical interfacial delamination process using wedge indentation. The geometries and material parameters of wedge indentation on a film/substrate system are indicated in the diagram, and the origin of the coordinate system is the center of the bottom surface of the system.

In addition, assuming that the length of the wedge indenter tip is a natural fit for or smaller than the width of the thin line samples, i.e., b fs ≤ l w, where b fs is the system width (see Fig. 1), the plane strain condition was assumed during the indentation.Reference de Boer and Gerberich11, Reference de Boer and Gerberich12 The volume of the thin line samples above the interfacial crack V c is then expressed as follows:
 $$<![CDATA[$$V_{\rm{c}} = \left\{ \matrix{ ab_{{\rm{f}}s} t_{\rm{f}} ;\,\,\,\,\,\,\,\,\,\,\,\,\,\,\,\,\,\,\,\,\,\,\,\,\,\,\,b_{{\rm{f}}s} \,\lt\,\, l_{\rm{w}} \hfill \cr ab_{{\rm{fs}}} t_{\rm{f}} = al_{\rm{w}} t_{\rm{f}} ;\,\,\,\,\,\,\,\,b_{{\rm{fs}}} = l_{\rm{w}} \hfill \cr} \right.\quad,$$
where a is the half crack length and t f is the film thickness (Fig. 1).
If the indentation-induced stress reaches the critical buckling stress, the film above the interfacial crack is expected to buckle. Strain energy is released when the buckling occurs.Reference Marshall and Evans9–Reference de Boer and Gerberich12 Thus, to quantify the work during a fracture or interfacial adhesion, the strain energy associated with buckling has to be considered. As reported by Moon et al.Reference Moon, Jensen, Hutchinson, Oh and Evans15 and Hutchinson et al.,Reference Hutchinson, Thouless and Liniger16 the critical buckling stress for the straight double-sided buckles in the plane strain condition is calculated using the following equation:
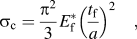 $$<![CDATA[$${\rm{\sigma }}_{\rm{c}} = {{{\rm{\pi }}^2 } \over 3}E_{\rm{f}}^* \left( {{{t_{\rm{f}} } \over a}} \right)^2 \quad,$$
where σ0 > σc, buckling happens, and vice versa.
Although de Boer’s analysis has now been used widely in many practical cases, it has two basic assumptions that limit its application: small plastic zone assumption and plane strain conditions. The small plastic zone assumption used in de Boer’s equations is generally not applicable for all the indentation test results, and it is possible that plastic deformation is not concentrated in close proximity to the indenter tip and may also depend on the plastic properties of films and the interfacial toughness. Li and SiegmundReference Li and Siegmund17 have found that directly applying Eq. (1) overestimated the interfacial toughness due to the large-scale yielding of thin films. Thus, a correction factor γ should be introduced in Eq. (1) to account for the effect of large-scale yielding of thin films to obtain accurate interfacial toughness results. It is convenient to write Eq. (1) with the correction factor as follows:
 $$<![CDATA[$$\Gamma _{\rm{i}} = {1 \over {\rm{\gamma }}}G\quad,$$
where the correction factor γ is closely related to the extent to which the thin films yield and depends on the plastic properties of the films, i.e., the film yield strength σyf, the effective film Young’s modulus,  $E_{\rm{f}}^* $, and the strain hardening exponent n f. Furthermore, the extent to which the thin films yield has also been examined by Li and Siegmund,Reference Li and Siegmund17 who found that the extent to which they yield was directly related to the interfacial toughness Γi. Therefore, the correction factor γ can be defined as follows:
 $$<![CDATA[$${\rm{\gamma }} \,=\, f({\rm{\sigma }}_{{\rm{yf}}} ,\,E_{\rm{f}}^* ,\,n_{\rm{f}} ,\,\Gamma _{\rm{i}} )\quad.$$
Because the identical yielding strain may produce the same plastic behavior independent of the absolute values of the Young’s modulus and the yielding strength,Reference Lee, Lee and Pharr18Eq. (8) can also be expressed as a function of several nondimensional parameters using dimensional analysis as follows:
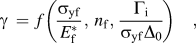 $$<![CDATA[$${\rm{\gamma }} \,= \,f\left( {{{{\rm{\sigma }}_{{\rm{yf}}} } \over {E_{\rm{f}}^* }},\,n_{\rm{f}} ,\,{{\Gamma _{\rm{i}} } \over {\sigma _{{\rm{yf}}} \Delta _0 }}} \right)\quad,$$
where ∆0= 1 μm and is used to normalize all the parameters in the length scales.
In addition to modifying Eq. (1) by eliminating the small plastic zone assumption, it is notable that only a simple two-dimensional (2D) plane strain condition is considered in Eq. (1). In fact, the indentation mechanics may be in a nonplane strain state unless the indenter is long compared to the other dimensions of the system, such as the film thickness and the indentation depth. Recent experiments by Yeap et al.,Reference Yeap, Zeng, Jiang, Shen and Chi13, Reference Yeap, Zeng and Chi14 who studied the interfacial delamination process of low-k dielectric films on a Si substrate, have shown that wedge indentation of a continuous film could induce a plane strain condition at the central portion of the impression; however, at the ends of the wedge tips in the length direction, the stress–strain condition was nonplane strain. More recently, Chen et al.Reference Chen, Yeap, Zeng, She and Liu19 and She et al.Reference She, Zhang and Zeng20 have also found that the extent of the plane strain region depended on the following ratio of the wedge length to the thickness of the film: l w/t f. Therefore, Eq. (5) is no longer true, and Eq. (1) needs to be further modified by another correction factor β = g(l w/t f) to account for the influence of the stress state to achieve an accurate interfacial toughness value. Combining these two correction factors, Eq. (1) is modified as follows:
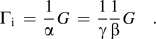 $$<![CDATA[$$\Gamma _{\rm{i}}\, =\, {1 \over {\rm{\alpha }}}G \,=\, {1 \over {\rm{\gamma }}}{1 \over {\rm{\beta }}}G\quad.$$
In this study, we therefore aim to derive these two correction factors and propose a new approach to evaluate the interfacial toughness of soft films on hard substrates from wedge indentation. In the course of this approach, 2D finite element simulations were first conducted to systematically investigate the variation of the correction factor γ with the extent to which the thin films yield during indentation. Three-dimensional (3D) simulations were then used to investigate the effects of the stress states on the correction factor β. A universal correction expression α = γβ for de Boer’s equations was thus obtained using the regression method. With this expression, a reverse algorithm was developed to extract the interfacial toughness from the wedge indentation experiments. The finite element and analytical results were compared to prove that the corrected equations provide accurate closed-form solutions that can be used to evaluate the interfacial toughness. This new approach was then used to reanalyze the wedge indentation experimental results on two real SFHS systems, i.e., methylsilsesquioxane (MSQ) and black diamond (BDTM, Applied Materials Inc., Santa Clara, CA) films on a Si substrate, which were reported previously by Yeap et al.Reference Yeap, Zeng, Jiang, Shen and Chi13, Reference Yeap, Zeng and Chi14
II. FINITE ELEMENT MODELING
A. Materials and cohesive zone formulations
Both the film and the substrate were modeled as isotropic elastic–plastic materials according to the large-strain J 2 theory. The power law relationship, which provides an excellent approximation of the uniaxial stress–strain curve, was used:
 $$<![CDATA[$${\rm{\varepsilon }} = \left\{ \matrix{ {\rm{\sigma }}/E\,\,\,\,\,\,\,\,\,\,\,\,\,\,\,\,\,\,\,\,\,\,\,\,\,\,\,\,\,\,\,\,\,{\rm{\sigma }}\; \le\; {\rm{\sigma }}_{\rm{y}} \hfill \cr ({\rm{\sigma }}_{\rm{y}} /E)({\rm{\sigma }}/{\rm{\sigma }}_{\rm{y}} )^n \,\,\,\,\,\,{\rm{\sigma }} > {\rm{\sigma }}_{\rm{y}} \hfill \cr} \right.\quad,$$
where σy is the yield strength, E is the elastic modulus, and n is the strain hardening exponent.
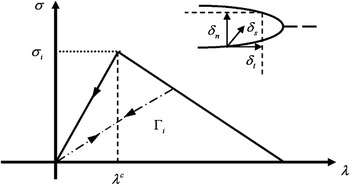
The interfaces between films and substrates were modeled by means of a cohesive zone model.Reference Xu and Needleman21 A typical form of cohesive zone (traction–separation) lawReference Tvergaard and Hutchinson22 is shown in Fig. 2, where δn, δs, and δt are the separations in the normal or the first and second shear directions, respectively, and  ${\rm{\delta }}_{\rm{n}}^{\rm{c}} $,
 ${\rm{\delta }}_{\rm{s}}^{\rm{c}} $, and
 ${\rm{\delta }}_{\rm{t}}^{\rm{c}} $ are three quantities that represent the critical separations in these three directions corresponding to complete failure. σi is the interface strength for the initiation of delamination, and the interface energy Γi is the energy consumed by interface separation per unit area during the delamination process. By combining the normal and shear displacements into a single parameter for mixed mode effects, one can define:
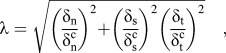 $$<![CDATA[$${\rm{\lambda }} = \sqrt {\left( {{{{\rm{\delta }}_{\rm{n}} } \over {{\rm{\delta }}_{\rm{n}}^{\rm{c}} }}} \right)^2 + \left( {{{{\rm{\delta }}_{\rm{s}} } \over {{\rm{\delta }}_{\rm{s}}^{\rm{c}} }}} \right)^2 \left( {{{{\rm{\delta }}_{\rm{t}} } \over {{\rm{\delta }}_{\rm{t}}^{\rm{c}} }}} \right)^2 }\quad,} $$
Schematic diagram showing the traction–separation law used for the FEM simulations.

in which λ = λc is the condition for onset of delamination, where λc is the critical separation at damage initiation, and the stress can be expressed as:
 $$<![CDATA[$${\rm{\sigma }}({\rm{\lambda }}) = \left\{ \matrix{ {\rm{\sigma }}_{\rm{i}} {\rm{\lambda }}/{\rm{\lambda }}^{\rm{c}} \,\,\,\,\,\,\,\,\,\,\,\,\,\,\,\,\,\,\,\,\,\,\,\,\,\,\,\,\,\,\,\,\,\,\,\,0 \,\,\,\,\lt\, \lambda \,\le \,\,{\rm{\lambda }}^{\rm{c}} \hfill \cr {\rm{\sigma }}_{\rm{i}} (1 - {\rm{\lambda }})/(1 - {\rm{\lambda }}^{\rm{c}} )\;\;\,\,\,{\rm{\lambda }}^{\rm{c}} \,\lt\, {\rm{\lambda }}\, \le\, 1 \hfill \cr} \right.\quad.$$
The interfacial energy can be obtained by:
 $$<![CDATA[$$\Gamma _{\rm{i}} = {{{\rm{\sigma }}_{\rm{i}} {\rm{\delta }}_{\rm{n}}^{\rm{c}} } \over 2}\quad.$$
When the mixed mode fracture energy criterion, G n + G s + G t = Γi, is satisfied, the complete failure occurs. The quantities G n, G s, and G t refer to the work done by the traction and its conjugate relative displacement in the normal, the first, and the second shear directions, respectively, hence the interfacial energy is independent of the cracking mode.
B. Model description
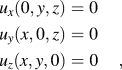
Figure 1 shows a typical SFHS system indented by a wedge-shaped indenter tip. As discussed above, when the wedge tip is a natural fit to or smaller than the width of the sample, i.e., b fs ≤ l w, the delamination behavior can be considered under the plane strain condition. Therefore, 2D models, represented schematically by the upper part of Fig. 1, were used for this configuration for simplicity. However, when the length of the wedge tip is less than the width of the sample, i.e., b fs > l w, 3D models were created to simulate the delamination process under mixed (plane and nonplane) strain states (3D stress state in this paper) during the wedge indentation. Due to its symmetry along the y-axis and x-axis, only a quarter of the system was considered in the 3D models and only half of the system was considered in the 2D models. The boundary conditions applied to the system for 3D models (all the parameters were set to zero in the y-direction for 2D models) are the following:
 $$<![CDATA[$$\eqalignb{ & u_x (0,y,z) = 0 \cr & u_y (x,0,z) = 0\cr & u_z (x,y,0) = 0 \cr} \quad, $$
where ui (i = x, y, z) is the displacement in the x-, y-, or z-directions. Loading was imposed on the indenter under displacement-controlled conditions as follows:
 $$<![CDATA[$$u_z (x,y,z) = - h\quad,$$
where h is the indentation depth, which is at its maximum at 1.5 times the film thickness.
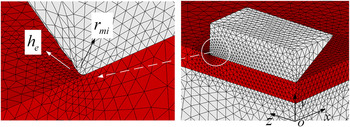
FEM (Finite Element) simulations were performed using the commercial software ABAQUS.23Figure 3 shows the detailed mesh design for 3D FEM models. Note that the mesh configuration of 2D models is not provided in this paper because the 2D mesh design is similar to but simpler than that of the 3D mesh design. The wedge indenter was defined to be a rigid body with an inclusion angle of 2θ = 120°. The interface was modeled with cohesive elements with six nodes and three integration points (COH3D6), and the film and substrate were modeled with four-node linear tetrahedral elements (C3D4). The sizes of the elements within the indentation contact area were refined carefully because of the strong stress gradient and because convergence is difficult to achieve. To accommodate the stress gradient and convergence requirement, the minimum size h e of the elements near the end of the wedge indentation impression in the film was set to be lower than 0.02 times ∆0 = 1 μm, and h e increases with distance from the indenter with a ratio of 5.0 in the x-direction and 10.0 in the y-direction and z-direction. The radius r mi of the chamfer curve of the indenter was artificially set to r mi/∆0= 0.05. Each FEM model contains at least 83,658 elements and 15,555 nodes. The validation and convergence of the mesh size described above have been confirmed in the simulations.
3D finite element mesh used in the numerical simulations.

The static analysis was used, and the master–slave contact mechanism was applied between the wedge indenter and the film. Due to the fact that the influence of friction is usually negligible on the determination of interfacial toughness, frictionless and small sliding conditions were adopted. The augmented Lagrange method was used as the contact algorithm in this analysis. The normal contact stiffness was updated in each iteration based on the current mean stress of the underlying elements and the allowable penetration. If bisections occurred in the analysis, the normal contact stiffness was reduced by a factor of 0.2 for each bisection.
III. COMPUTATIONAL RESULTS
A. Effects of yielding in thin films
In this study, we only present the simulations for the thin film in which both the elastic modulus and the hardness are lower than those of the substrate, which is known as a SFHS system. For this system, the substrate is dominated by elastic deformation, and almost, no plastic deformation occurs. Therefore, the substrate was simply characterized by its elastic properties: Young’s modulus (E s = 300 GPa) and Poisson’s ratio (v s = 0.28). As described earlier, all the parameters in the length scales were normalized by ∆0 = 1 μm for convenience. The geometric values in Fig. 1 were chosen as follows: the thickness of substrate is t s = 4∆0 and the width of the system was assumed to be b fs = 20∆0. The 2D plane strain models (t f/∆0= 0.4, unless otherwise specified) were used to obtain the computational results that were used to investigate the effects of thin films that yield; the extent to which a thin film yields depends on the two following aspects: (i) the plastic properties of films and (ii) the interfacial toughness.
It is worthwhile here to mention that for each case in the simulations, the correction factor was equivalent to the ratio of the energy release rate to the interfacial toughness G/Γi. To be specific, the energy release rate G was evaluated using Eq. (1), which used the delamination parameters, i.e., the predicted delamination length and the indentation depth. Further, the interfacial toughness Γi corresponded to the input value for the case in hand in the simulation.
1. Correction factor for various plastic properties of films
a. The representative strain
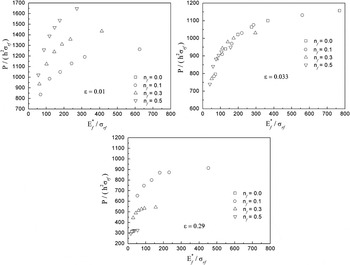
It is well known that the plastic behaviors are closely related to the two plastic properties: the strain hardening exponent n and the yielding strength σy. During the FEM simulation of the nanoindentation experiments, a mathematical parameter known as the representative strain εr is usually introducedReference Dao, Chollacoop, Vliet, Venkatesh and Suresh24 to normalize the loading curvature to make it independent of the strain hardening exponent n, which reduces the number of independent variables in the dimensional equation Π1 that was defined by Eq. (11) in the paper by Dao et al.Reference Dao, Chollacoop, Vliet, Venkatesh and Suresh24 Furthermore, they found that for a given value of the Young’s modulus within a specified range of material parameters, a representative strain of εr = 3.3% was identified for the standard Berkovich indentations (equivalent to 70.3° cone) using the power law material model in Eq. (11).
To identify the representative strain for the wedge indentation on SFHS systems, a comprehensive parametric study over 24 different combinations of elastoplastic properties of films was conducted; these property combinations represent the wide range of parameters commonly found in general soft engineering materials: Young’s modulus, E f, varies from 5 to 80 GPa; the yield strength, σyf, varies from 30 to 1500 MPa; the strain hardening exponent, n f, varies from 0 to 0.5; and Poisson’s ratio, v f, is fixed at 0.34. Figure 4 shows the effect of the selection of εr on the form of function Π1, at a indentation depth of h/t f = 1.0. From the computational results, it is clear that the representative strain εr = 3.3% is also applicable to the case of wedge indentation on SFHS systems. It should be emphasized that although some previous studiesReference Dao, Chollacoop, Vliet, Venkatesh and Suresh24, Reference Cao and Lu25 stated that the representative strain was not always fixed but somewhat dependent on the geometries of indenter, the indentation depth, and even the accuracy of the fitting functions, it was found that this small variation of the representative strain produces an almost negligible effect on our investigation of interfacial toughness.
Dimensionless function Π1 constructed for wedge indentation on SFHS systems with h/t f = 1.0. A representative strain εr=3.3% is identified, which makes the dimensionless function Π1 independent of the strain hardening exponent n.

b. Effects of the strain hardening exponent
Because of the similarity of the P-h curve and the yielded thin film for the simulation, a “trial-and-validation” process was used to remove the unknown parameter n f to express the correction factor γ, as given in Eq. (9), and this process involves two steps:
(i) The correction factor γ in Eq. (9) is first written in a similar functional form to that of Π1 in the paper by Dao et al.Reference Dao, Chollacoop, Vliet, Venkatesh and Suresh24 To be specific, in the parameter lists of Eq. (9), the film yield stress σyf is replaced by the film representative stress σrf (the stress corresponding to the representative strain), and the strain hardening exponent n f is removed; therefore, Eq. (9) is rewritten as follows:
 $$<![CDATA[$${\rm{\gamma }} = f\left( {{{{\rm{\sigma }}_{{\rm{yf}}} } \over {E_{\rm{f}}^* }},n_{\rm{f}} ,{{\Gamma _{\rm{i}} } \over {{\rm{\sigma }}_{{\rm{yf}}} \Delta _0 }}} \right)\, \Rightarrow \,\,\,{\rm{\gamma }} = f\left( {{{{\rm{\sigma }}_{{\rm{rf}}} } \over {E_{\rm{f}}^* }},{{\Gamma _{\rm{i}} } \over {{\rm{\sigma }}_{{\rm{rf}}} \Delta _0 }}} \right).$$
(ii) The validity of Eq. (17) is then studied based on the evolution of the correction factor γ with various strain hardening exponent values at a fixed film representative stress.
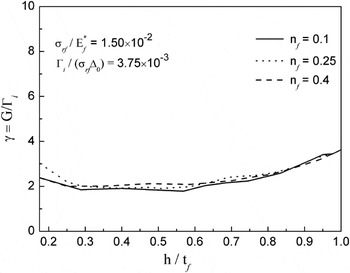
Figure 5 shows the correction factor, γ, as a function of the normalized indentation depth, h/t f, with various strain hardening exponent values (n f = 0.1, 0.25, 0.4) at a fixed normalized film representation stress of  ${\rm{\sigma }}_{{\rm{rf}}} /E_{\rm{f}}^* = 1.50 \times 10^{ - 2} $. In all these cases, a specific interfacial toughness was used, i.e., Γi/(σrf∆0) = 3.75 × 10⁻³. Here, it should be noted that, in this study, the hardening exponent and the interfacial toughness are assumed to be two independent parameters, so that the interfacial toughness can be changed to investigate its effects on the correction factor, which will be provided in the Sec. III. A. 2. We observed that for different values of strain hardening exponent n, little change in the curves was observed, which indicates that the correction factor γ, or the extent to which films yield, is independent of the strain hardening exponent n if the same representative stress values are utilized. Therefore, the simplifications from Eqs. (9) to (17) can be applied effectively. Moreover, it is worth noting that the correction factor γ was always larger than one, which confirms that it is necessary to introduce the correction factor to adequately consider the effects of the yielding of thin films and consequently accurately determine the interfacial toughness using de Boer’s solutions, as presented in Eq. (1).
Correction factor γ versus normalized indentation depth h/t f for various strain hardening exponent values (n = 0.1, 0.25, 0.4).

c. Effects of representation stress
As described earlier, the film materials with the same representative stress values produce similar effects to those of the correction factor γ. Consequently, the independent variables from the film plastic properties for the correction factor γ can be simplified to one, i.e., the representation stress σrf. To gain insight into how the film representation stress affects the correction factor γ, a parametric study was performed with the normalized film representation stress  ${\rm{\sigma }}_{{\rm{rf}}} /E_{\rm{f}}^* $ having the values 2.35 × 10⁻³, 5.45 × 10⁻³, 1.50 × 10⁻², 3.76 × 10⁻², and 9.10 × 10⁻². In this parametric study, the normalized interfacial toughness Γi/(σrf∆0) was fixed at 3.75 × 10⁻³.
Figure 6 shows the variation of the correction factor, γ, versus the normalized indentation depth, h/t f, at different normalized film representation stresses. It is obvious that as the normalized film representation stress decreases, the correction factor γ increases significantly and vice versa. It is easily understood that a low representation stress implies that the film yields easily, and therefore, the plastic zone in the films increases as the representation stress decreases. As a result, a film material with a low normalized representation stress requires a large correction factor.
Correction factor γ versus normalized indentation depth h/t f at a fixed normalized interfacial toughness Γi/σrf∆0 = 3.75 × 10⁻³ for various normalized film representation stress  ${\rm{\sigma }}_{{\rm{rf}}} /E_{\rm{f}}^* $.

2. Correction factor for various values of interfacial toughness
To investigate the effects of interfacial toughness on the correction factor γ, a series of computations were performed with a range of normalized interfacial toughness values of Γi/σrf∆0 = 7.5 × 10⁻⁴ to 3.75 × 10⁻². In every case, the same plastic property, i.e., normalized representation stress  ${\rm{\sigma }}_{{\rm{rf}}} /E_{\rm{f}}^* = 1.50 \times 10^{ - 2} $, was used.
Figure 7 shows the corresponding correction factor, γ, as a function of the normalized indentation depth, h/t f, at different normalized interfacial toughness values. It can be observed that the correction factor γ clearly depends on the interfacial toughness and increases as the interface toughness increases. As shown by Eq. (3), the indentation-induced stress σ0 is expressed in terms of the ratio of the indentation deformation volume to the volume of the materials above the interfacial crack. In this regard, the plastic zone should be normalized by the delamination crack volume when evaluating the extent of yielding in thin films. It is known that an interface with large interfacial toughness has a small delamination crack. Therefore, a relatively larger plastic zone or yielding will be created at a stronger interface if the same plastic behavior is given, which indicates that the stronger interface requires a larger factor to correct the results from Eq. (1). However, it is worth mentioning that for larger values of indentation depths and delamination crack lengths, a steady-state condition is reached, as observed by Hutchinson and Suo,Reference Hutchinson, Suo, Hutchinson and Wu26 and this phenomenon can also be found in the correction factor γ, as shown in Fig. 7. For example, at Γi/(σrf∆0) = 7.5 × 10⁻³, when the correction factor γ reaches a value of 5.01 at h/t f≈ 0.5, little change was observed by further increasing the indentation depth.
Correction factor γ versus normalized indentation depth h/t f with a fixed ratio  $\sigma _{{\rm{rf}}} /E_{\rm{f}}^* = 1.50 \times 10^{ - 2} $ and a range of normalized interfacial toughness (Γi/σrf∆0) values.

3. A universal expression for the correction factor γ
Based on the above analyses, it is possible to establish a universal expression to quantitatively determine the dependence of the correction factor γ on the normalized representative stress as well as the normalized interfacial toughness. For this purpose, the results obtained from the extensive numerical simulations of the interfacial delamination during wedge indentations on different film materials and interfacial toughness values were used. The film properties of most soft engineering materials were adopted with the value of  ${\rm{\sigma }}_{{\rm{rf}}} /E_{\rm{f}}^* $ between 1.25 × 10⁻³ and 1.25 × 10⁻¹. The interfacial toughness values varied between Γi/(σrf∆0) = 7.5 × 10⁻⁴ and 3.75 × 10⁻² to include both the so-called weak and strong interfaces.
Figure 8 shows the surface plot of the correction factor γ as a function of two independent variables: the normalized representative stress  ${\rm{\sigma }}_{{\rm{rf}}} /E_{\rm{f}}^* $ and the normalized interfacial toughness Γi/(σrf∆0). Note that the value of the correction factor γ at any point is the average value obtained in the corresponding γ–h/t f curve after a steady-state delamination is reached. For example, the correction factor γ = 5.2 at a point [
 ${\rm{\sigma }}_{{\rm{rf}}} /E_{\rm{f}}^* = 1.50 \times 10^{ - 2} $ and Γi/(σrf∆0) = 7.5 × 10⁻³] that corresponds with the highlighted γ–h/t f curve in Fig. 7 is the average value after the normalized indentation depth exceeds 0.5, i.e., h/t f> 0.5.
Regression surface of the correction factor γ versus two independent variables: the logarithmic inverse normalized representative stress  ${\rm{In}}(E_{\rm{f}}^* /{\rm{\sigma }}_{{\rm{rf}}} )$ and the logarithmic normalized interfacial toughness In(Γi/σrf∆0).

The multiple regression method was used to derive the universal expression for the correction factor γ. Because the relationship between the correction factor γ and the normalized representative stress as well as the normalized interfacial toughness involves multiple independent variables and exhibits nonlinear behavior, a regression strategy, conducted by the commercial software (SPSS 13.0), was adopted to deal with this issue. For this regression analysis, the values of the correction factor γ were first input and followed by testing different master functions. Then, for any specific master function f i, we could determine the corresponding coefficients by achieving the minimum residual error denoted as e i. Finally, comparing these minimum residual errors, e i, for different master functions, the master function that best fits the original data with the minimum residual error, as shown in Eq. (18), can be determined:
 $$<![CDATA[$$\eqalignb{ {\rm{\gamma }} = f\left( {{{{\rm{\sigma }}_{{\rm{rf}}} } \over {E_{\rm{f}}^* }},\;{{\Gamma _{\rm{i}} } \over {{\rm{\sigma }}_{{\rm{rf}}} \Delta _0 }}} \right) \,\equiv\,\, f(m_1 ,\;m_2 ) = \,{{f_u (m_1 ,\;m_2 )} \over {f_d (m_1 ,\;m_2 )}}\quad, \cr f_u (m_1 ,\;m_2 ) = p_1 + p_2 m_1 + p_3 m_1^2 + p_4 m_1^3 \cr\quad+ p_5 m_2 + p_6 m_2^2 \quad, \cr f_d (m_1 ,\;m_2 ) = 1 + q_1 m_1 + q_2 m_1^2 + q_3 m_2 + p_4 m_2^2 \quad, \crm_1 = {\rm{In}}({\rm{\sigma }}_{{\rm{rf}}} /E_{\rm{f}}^* ),\;\;\;\;\;\;\;\;\;m_2 = {\rm{In}}(\Gamma _{\rm{i}} /{\rm{\sigma }}_{{\rm{rf}}} \Delta _0 )\quad,} $$
where the constant coefficients pi = 1, 2, 3, 4, 5, 6 and qi = 1, 2, 3, 4 for this best fit master function are shown in Table I.
Values of the constant coefficients for the correction factor.

B. Effects of the stress state
In Sec III. A, we assumed that the wedge-indented interfacial delamination is completely under the plane strain condition. During delamination, however, the mechanics of the indentation may be in a nonplane strain state (3D stress state) depending on the ratio between the indenter length and the film thickness. A previous studyReference Chen, Yeap, Zeng, She and Liu19 suggested that if the ratio l w/t f was greater than 40, then the plane strain region dominated most of the crack front, and thus, the calculation in Eq. (1), which is proposed for the plane strain condition, can be used without much error. However, when the l w/t f ratio is less than 40, the shape of the delamination will change from a rectangular shape to an elliptical shape, as shown in Fig. 1; consequently, there will be some errors due to the emergence of the nonplane strain regions along the length of wedge indenter.Reference She, Zhang and Zeng20 Therefore, the second correction factor β = g(l w/t f) should be introduced to account for the influence of the stress state. To quantify the effects of the stress state on the correction factor β, a series of 3D simulations were conducted with various indenter lengths l w = 1.0, 2.0, 4.0, and 7.24Δ0 and film thicknesses t f = 0.1, 0.4, 0.6, and 1.0Δ0, which gives a l w/t f ratio between 2.0 and 72.4.
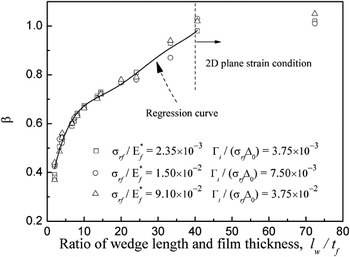
Figure 9 shows the influence of the l w/t f ratio on the correction factor β. The values of correction factor β are computed by dividing the G/Γi ratio by the corresponding correction factor γ according to Eq. (10). For completeness, three combinations of film properties and interfacial toughness values were utilized in this study. It can be observed that (i) when l/h f > 40, the correction factor β approaches one due to the dominated plane strain condition during indentation and (ii) if l/h f < 40, it is apparent that the correction factor β needs to be introduced to further correct Eq. (1) and that a good fit for β = g(l w/t f) can be obtained by the five-order polynomial regression method:
 $$<![CDATA[$${\rm{\beta }} = g(l_{\rm{w}} /t_{\rm{f}} ) \,\equiv\, g(m_3 ) = \left\{ \matrix{ s_1 + s_2 m_3 + s_3 m_3^2 + \;s_4 m_3^3 + s_5 m_3^4 + s_6 m_3^5 \;\;m_3 \,\lt\, 40.0 \hfill \cr 1.0\;\;\;\;\;\;\;\;\;\;\;\;\;\;\;\;\;\;\;\;\;\;\;\;\;\;\;\;\;\;\;\;\;\;\;\;\;\;\;\;\;\;\;\;\;\;\;\;\;\,\,\,\,\,\,\,\,\,\,\,\,\,\,m_3 > 40.0 \hfill\,\,\,\,,} \cr \right.$$
Variation of the correction factor β with the ratio of the indenter length to the film thickness (l w/t f).

where m 3 = l w/t f, and the values of the constant coefficients si = 1, 2, 3, 4, 5, 6, with which the minimum residual error was achieved, were determined and can also be found in Table I.
It is worth noting that the correction factor β is always smaller than that when the nonplane strain state occurs during indentation. This discrepancy can easily be explained by the fact that the driving force from Eq. (3) under the nonplane strain state is much smaller than that under the plane strain condition, which causes the energy release rate to be underestimated. In addition, interestingly, the dependence of correction factor β on film materials as well as interfacial toughness is always negligible compared to the effect of the l w/t f ratio on β, irrespective of the stress state of the indention process. This finding confirms that it is reasonable to separate the correction factor α into two variables: one that depends on the plastic properties of films and the interfacial toughness, γ = f(m 1, m 2), and the other that is related to the stress state during delamination as β = g(m 3). With the information given above, the closed-form expression of the overall correction factor α can be derived as follows:
 $$<![CDATA[$${\rm{\alpha }} = {\rm{\gamma \beta }} = f(m_1 ,\;m_2 )g(m_3 )\quad.$$
IV. A NEW APPROACH TO DETERMINE THE INTERFACIAL TOUGHNESS
A. The principle of reverse analysis
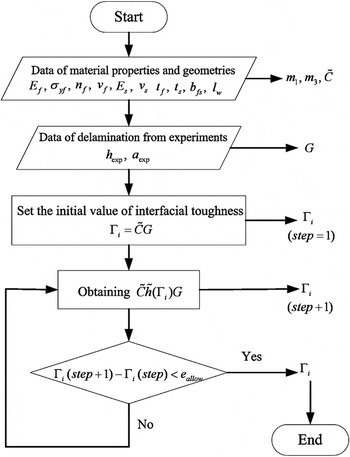
To directly apply the analytical results presented in Eq. (20), this section presents an approach to determine the interfacial toughness of SFHS systems by wedge indentation. The flowchart is illustrated in Fig. 10. It can be observed that in the proposed method, given the logarithmic normalized representative stress for films  $m_1 = {\rm{In}}({\rm{\sigma }}_{{\rm{rf}}} /E_{\rm{f}}^* )$ in Eq. (18) as well as the ratio between the indenter length and thin film thickness m 3 = l w/t f, the correction factor α can be expressed as a function of only one independent variable, i.e., the logarithmic normalized interfacial toughness m 2 = In(Γi/σrf∆0).
 $$<![CDATA[$${\rm{\alpha }} = f(m_1 ,\;m_2 )g(m_3 ) = Ch(m_2 ) = Ch({\rm{In}}(\Gamma _{\rm{i}} /{\rm{\sigma }}_{{\rm{yrf}}} \Delta _0 )),$$
Flowchart to determine the interfacial toughness using the reverse analysis algorithm.

where C is coefficient obtained from the known values of m 1 and m 3. Due to the fact that both σrf and ∆0 are given, α can be further written, for sake of simplicity, as function of interfacial toughness Γi:
 $$<![CDATA[$${\rm{\alpha }} = f(m_1 ,\;m_2 )g(m_3 ) = Ch(m_2 ) = Ch({\rm{In}}(\Gamma _{\rm{i}} /{\rm{\sigma }}_{{\rm{yrf}}} \Delta _0 )) \,\,\equiv\,\, \tilde C\tilde h(\Gamma _i ),$$
in which  $\tilde C$ can be calculated from C, σrf, and ∆0. Substituting Eq. (21) into Eq. (10) yields the following equation:
 $$<![CDATA[$$\Gamma _{\rm{i}} = \tilde C\tilde h(\Gamma _{\rm{i}} )G\quad.$$
Therefore, the interfacial toughness can be readily determined by solving Eq. (23), provided that the delamination length or area and the indentation depth are measured. However, Eq. (23) involves high nonlinearity with higher order terms, and thus, there may be several solutions to this equation. In such cases, an optimization iteration method should be implemented to refine the value. This iteration procedure begins with the product of the energy release rate G and constant coefficient  $\tilde C$ and sets the product as the initial interfacial toughness value Γi (step = 1), which is then used as input data for
 $\tilde h(\Gamma _{\rm{i}} )$. Consequently, the results for all the terms in the right side of Eq. (23), i.e., Γi (step + 1), can be calculated. Subsequently, a comparison of the interfacial toughness values from these two steps, Γi (step) and Γi (step + 1), indicates the accuracy of the optimization procedure. If the difference between Γi (step) and Γi(step + 1) is in the range of an imposed allowable error, the process ends.
B. Numerical verification of the reverse analysis
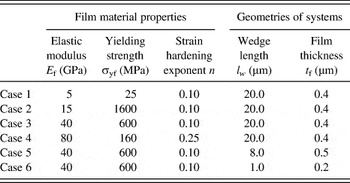
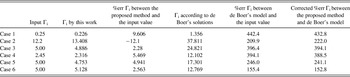
To verify the universal expression of Eq. (20) and examine the effectiveness of the inverse approach given in Fig. 10, six different SFHS systems are used, where the substrate was considered an elastic material with E s = 300 GPa and v s = 0.28; moreover, Poisson’s ratio of the film, v f, was fixed at 0.34, the system width was set to b fs = 20 μm, and other film material properties as well as the geometries of systems are presented in Table II. It should be noted that none of these parametric combinations were used to generate the closed-form expression for the correction factor α in Eq. (20). FEM modeling was used to simulate the indentation processes and obtain the interfacial delamination area and the corresponding indentation depth. These computed delamination data and the known material properties and geometries of systems (Table II) were used as the reverse algorithm inputs of the flowchart, as illustrated in Fig. 10. The interfacial toughness values for these six systems were computed and compared with the input interfacial toughness values (exact solutions) selected randomly for these six systems respectively, and the results are shown in Table III. More importantly, it is evident that for all the cases, the maximum relative error of the proposed inverse algorithm is approximately 15%, and in most cases, the relative error is below 10%, which makes the algorithm fairly reliable with satisfactory accuracy. The remaining discrepancy is partially caused by the accuracy of the fitted functions. Another error source is that the proposed approach is based on multiplicative corrections on de Boer’s model. As long as de Boer’s model is inherently limited, even when there is no plasticity in the film, the error may be transmitted to the proposed model accordingly.
Material properties and geometries of six different SFHS systems used to verify the proposed approach numerically.

Comparison between the identified interfacial toughness and input interfacial toughness values for numerical verification.

Note: the unit for Γi is J/m2.
For comparison, the interfacial toughness for these SFHS systems was also calculated according to de Boer’s solutions in Eqs. (1)–(4) using the real area of the delamination crack, and the results were compared to the corresponding input (exact) interfacial toughness values (Table III). It was found that the proposed inverse algorithm produces more exact interfacial toughness values compared to those of the original de Boer’s solutions, especially for softer films in which more plastic deformation are expected during the indentation experiments. This correction is most likely due to considerations regarding (i) the effects of plastic deformation of the film and (ii) the effects of nonplane strain states during the indentation in the proposed inverse algorithm. These two factors are not considered in de Boer’s solutions. In particular, it is expected that the plastic deformation of the film has a greater effect for the softer films (e.g., Case 1). Therefore, the larger correction exists for the softer film (e.g., the correction is 432.8% for Case 1).
V. APPLICATION TO LOW-k FILMS ON A Si SUBSTRATE
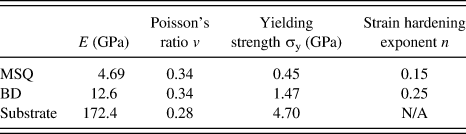
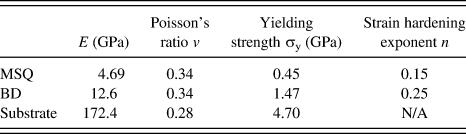
To further verify the proposed methodology, wedge indentations on two real SFHS systems studied previously by Yeap et al.Reference Yeap, Zeng, Jiang, Shen and Chi13, Reference Yeap, Zeng and Chi14 were reanalyzed. These two thin film systems are MSQ and BDTM films on a Si substrate. Table IV presents the material properties of the films and the substrate in detail as determined in the previous study,Reference Chen, Yeap, Zeng and Liu27 and the properties of the substrate are estimated based on Johnson’s analysis.Reference Johnson28 Wedge indentation experiments were conducted using a diamond wedge tip with an inclusion angle of 120° and a wedge length of 4.06 μm and a film thickness of 0.4 μm for the MSQ film and 0.3 μm for the BD film. The details of the experiments and analyses have been presented in previous studiesReference Yeap, Zeng, Jiang, Shen and Chi13, Reference Yeap, Zeng and Chi14 and, therefore, will not be repeated here.
Material properties of the low-k dielectric films and the Si substrate.
The interfacial toughness for these two real SFHS systems was first calculated according to de Boer’s solutions in Eqs. (1)–(4), and the corresponding values with 3.19 ± 0.13 J/m2 for the MSQ/Si system and 6.96 ± 1.63 J/m2 for the BD/Si system are listed in Table V. Five experimental indentations were carried out for each SFHS system and the averaged value is reported. Note that because the length of the wedge indenter tip is less than the width of the film sample, the real shape of the interfacial crack was considered when calculating the volume of the thin film above the interfacial crack as V c = A ct f, where A c is the real interfacial crack area. Then, we compared them with the corresponding values determined by the proposed reverse algorithm for the two considered systems. It is evident that the correction of the interfacial toughness is approximately 80% for MSQ/Si system and 40% for BD/Si system, with significant larger error in softer film (MSQ/Si system).
Comparison between the interfacial toughness results determined by the proposed method, de Boer’s solutions,Reference de Boer and Gerberich11 and the studies by Yeap et al.,Reference Yeap, Zeng, Jiang, Shen and Chi13, Reference Yeap, Zeng and Chi14 for two SFHS systems, MSQ/Si and BD/Si.

It is also mentioning here that Yeap et al.Reference Yeap, Zeng, Jiang, Shen and Chi13, Reference Yeap, Zeng and Chi14 used the plastic depth h pl to calculate the indentation volume V 0 in Eq. (4); in addition to the measurement of the real shape of the interfacial crack, the interfacial toughnesses for these two systems were 1.92 ± 0.08 J/m2 for the MSQ/Si system and 5.39 ± 1.27 J/m2 for the BD/Si system. Table V further compares the results from this proposed reverse algorithm and the corresponding values reported by Yeap et al.Reference Yeap, Zeng, Jiang, Shen and Chi13, Reference Yeap, Zeng and Chi14 It can be found that the interfacial toughness values from this work agree well with the results published in the previous study. From all these results above, it is therefore suggested that the methodology proposed in this work is a useful one to determine the interfacial adhesion properties based on the wedge indentation experiments.
VI. SUMMARY AND CONCLUSIONS
This work has presented a new approach to determine the interfacial toughness in SFHS systems using instrumented wedge indentation and including the effects of film plasticity and nonplane strain stress states; the following conclusions can be drawn.
(i) 2D FE simulations have been undertaken to systematically study the effects of plastic properties of films and the interfacial toughness on the correction factor for de Boer’s equations. In addition, 3D simulations were used to investigate the effects of stress states on interfacial toughness determination, which depends on the ratio of the indenter length to the film thickness. By synthesizing these comprehensive investigations, a universal correction expression for de Boer’s equations was obtained using the regression method.
(ii) Based on the closed-form correction expression, an inverse approach has been developed to extract the interfacial toughness from the instrumented wedge indentation. In this new approach, provided that the delamination area and the indentation depth are measured experimentally, the interfacial toughness can be readily determined by making use of the known material properties of the films and substrates and the geometries of the indenter and the thin film systems.
(iii) The effectiveness of the proposed algorithm has been verified numerically, and the results show that the corrected equation provides an accurate closed-form solution to determine the interfacial toughness. In addition, the proposed inverse algorithm produces more exact interfacial toughness values compared to those of the original de Boer’s solutions. Application of the proposed approach to wedge indentation on two SFHS systems, MSQ/Si and BD/Si, has also demonstrated the validity of the proposed method.
Last, it should be emphasized that the elastoplastic properties of the film in this work have the following ranges: Young’s modulus, E f, from 5 to 80 GPa; yield strength, σyf, from 30 to 1500 MPa; and strain hardening exponent, n f, from 0 to 0.5. These combinations of properties cover the wide range of parameters commonly found in many practical engineering materials. For the wide range of material properties investigated in this study, the reverse analysis error is less than 10% in most cases. The remaining discrepancy is caused partially by the accuracy of the fitting functions and partially by the inherent error of de Boer’s model, even when there is no plasticity in the film. Therefore, a fresh analysis of interfacial delamination without dependence on de Boer’s model while considering plastic deformation will be especially useful and will be addressed in future studies.