Introduction
Chronic diseases such as atherosclerosis, cancer, dementia and diabetes among others are the principal causes of adult (⩾40 years) mortality and are focus of much public health effort for prevention and control. Of complex etiology, these diseases are age-related and display a complex web of causation linking the environment to the genome with characteristic long latency between cause and effect. Current control efforts include improving population level social determinants, influencing individual level behaviors and providing disease specific diagnosis and treatment.
Over 70 years ago, Kermack et al.Reference Kermack, McKendrick and McKinlay 1 first reported ‘some general regularities’ in death rates in Britain and Sweden. In particular, they reported that declining age-specific adult mortality rates between 1845 and 1925 displayed patterns that reflected declining mortality rates in successive birth cohorts. They hypothesized that adult mortality rates may be determined by conditions experienced during the first 15 years of life. Extending data to the United States, JonesReference Jones 2 noted that the birth cohort effects in adult mortality rates were traceable to overall declines in death rates for most of the major chronic diseases, such as atherosclerotic and hypertensive vascular disease, cancer and diabetes. More recently, Finch and Crimmins demonstrated a strong association between early-age mortality and adult mortality in four European countries and suggested that the reduction in lifetime exposure to infectious diseases and other triggers of inflammation were key factors in the historical decline of adult mortality observed in cohorts born before the 20th century.Reference Crimmins and Finch 3 , Reference Finch and Crimmins 4 Thus, these and other investigators concluded that conditions in early life appeared to broadly affect susceptibility to many categories of age-related chronic disease. In part, because the mechanisms underpinning the relationship between early life events and chronic disease susceptibility remain enigmatic, others have argued that improvements in survival of age-related chronic disease are due to medical improvements in treatment and secondary prevention for chronic diseases.Reference Cutler, Rosen and Vijan 5
Strehler and MildvanReference Strehler and Mildvan 6 developed a general theory of mortality and aging based on a mathematical model of adult mortality that Gompertz first reported. This model is based on the observation that adult mortality rates increase exponentially with age. To explore whether early life events are statistically correlated to age-specific adult mortality rates, we used mortality data from Canada and nine other countries in a generalized Gompertzian model of mortality, which accounts explicitly for period and cohort effects. This allowed statistical correlation of the observed mortality patterns with either birth year or death year. We subsequently used regression analysis to determine whether infant mortality rates predicted adult mortality rates.
The findings provide strong statistical support for the correlation between early life and adult mortality rates suggesting that improvements in maternal and infant health is a major broad strategy for the primary prevention of the chronic diseases of adulthood.Reference Butler, Miller and Perry 7
Materials and methods
Data sources
Canada age-specific mortality data by gender were obtained from the human mortality database for the years 1921–2004. 8 Number of deaths by gender, age and calendar year and the corresponding population bases were cross-tabulated by 5-year calendar periods (1921–1924, 1925–1929, 1930–1934, …, and 2000–2004) and 5-years age groups (ages 40–94 years). These data represent the mortality experience of individuals born as early as 1835. Infant mortality rates were also obtained from the same sources. To enable generalization among different countries, similar data for Australia, Finland, France, Japan, Netherlands, Spain, Sweden, United Kingdom and the United States were also obtained from the human mortality database. The data from Canada are used to illustrate the principal findings.
Mathematical models
We explore generalizations of age-period-cohort (APC) models that have been used to examine the epidemiology of chronic diseases in order to investigate age effects and period (temporal) trends in adult mortality. In these models, cohort effects represent the changes in adult mortality attributed to factors that affected, or benefited, most individuals born in a particular year or years. On the other hand, period effects capture the changes in mortality due to factors that affected all adults living in a specific calendar year or years. We used Gompertz mortality functions to replace the non-specific effects of age in the traditional APC models. Secular trends in period and cohort effects were modeled in the usual fashion. Similar methods have been used to analyze cancer incidence and mortality trends.Reference Luebeck and Moolgavkar 9 – Reference Meza, Jeon, Moolgavkar and Luebeck 11
We model adult age-specific mortality at age a occurring in calendar year j as

where Ae Ga is the Gompertz mortality function at age a greater than 40 years; cj , a coefficient that adjusts for calendar year j; and the coefficient bi adjusts for birth cohort i (i = j − a, stratified in 5-year groups; 1835–1839, 1840–1844, …, 1945–1949 and >1950). To ensure identifiability and comparability of the model parameters, the period and cohort coefficients are normalized arbitrarily by setting b 1860–1864 = 1 and c 1930–1934 = 1.
Statistical analysis
We stratify the mortality data in 11 age groups (40–44 years, 45–49 years, …, 85–89 years, 90–94 years) and into 17 five-year calendar periods (1921–1924, 1925–1929, 1930–1934, …, 2000–2004). We fit models (equation 1) to the number of observed deaths stratified by age group, calendar period and birth cohort to evaluate whether birth cohort (bi ) or calendar year of death (cj ) correlates more strongly with the observed mortality rates. We obtain parameter estimates for each model by maximizing the likelihood across all age-calendar strata assuming that the number of deaths in each stratum is Poisson distributed with mean Naj × mij(a), where Naj is the population at risk in age group a and calendar year j, and mij (a) is as given in equation (1).
We then use the akaike information criteria (AIC), a test of goodness of fit for multivariate models, to statistically discriminate between competing models.Reference Akaike 12 In particular, we use the AIC to determine if age-period models (where cohort effects are assumed equal to 1) or age-cohort models (where period effects are assumed equal to 1) give better fit to the data. We also use the AIC to determine if gender differences in period effects, cohort effects or in the Gompertz mortality parameters are statistically significant.
Results
Temporal trends in declining mortality rates
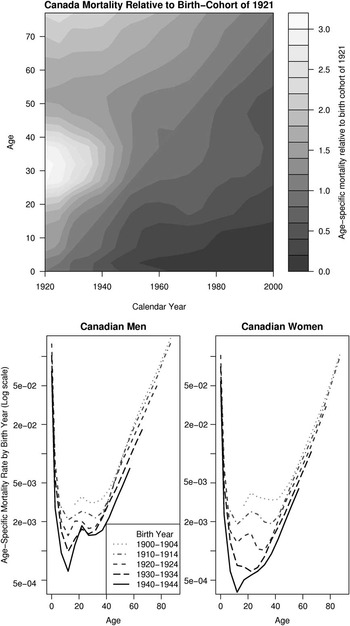
Figure 1 (top) shows the Canada age-specific mortality rates normalized relative to the birth-cohort of 1921. The diagonal progression from high to low values of relative mortality illustrates strong cohort effects, especially on adult mortality, in that diagonal lines represent the mortality experienced by specific birth-cohorts as they aged. The distortion of the diagonal progression during 1920–1940 may be due to the impact of the two world wars on Canadian adult mortality, in that young adults experienced mortality rates higher than expected during this period. The middle age-distortion (ages 30–50 years) between the 1960 and 2000 may be due to the effects of the smoking epidemic on Canadian mortality (mainly among men), in that smoking attributed mortality reached significant levels during this period.Reference Peto, Lopez, Boreham, Thun and Heath 13
Heat graph displaying Canada age-specific mortality relative to the 1921 birth-cohort (top). The figure visually shows the striking birth-cohort effect in the decline in mortality rates during the 20th century. Canada age-specific mortality rate by birth year (bottom). Male mortality for selected birth-cohorts (left panel). Female mortality for selected birth-cohorts (right panel).

Figure 1 (bottom) shows age-specific mortality curves by birth cohort and gender for Canada between 1900 and 1944 shown on a natural (e) logarithmic scale. The rightward shift in the adult mortality curves for different birth cohorts (diagonal lines) suggests that cohort effects appear to strongly influence adult mortality rates.
Relative importance of period or birth cohort effects on adult mortality
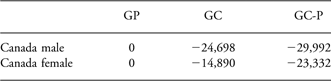
To statistically explore this suggestion, we began our analysis by fitting Gompertz-period (GP) models (in which bi = 1 in equation 1) and Gompertz-cohort (GC) models (in which cj = 1 in equation 1) to evaluate the relative impact of birth year or year of death on the observed adult mortality rates. We used goodness of fit of the models as measured by the AIC to determine, which effect is more important (the smaller the AIC, the better the fit of the model). Table 1 shows the AICs for the GC and GP model fits to Canadian men and women. The AICs of fits for other countries data are shown in the supplementary information (SI). As judged by the AIC, the GC model is uniformly and significantly better than the GP model in explaining the changing adult mortality rates. Results were analogous for all countries evaluated (SI, Table S1). We also fitted conventional age-period and age-cohort models and reached the same conclusions. These findings provide strong statistical support for the hypothesis that birth cohort effects are the dominant determinant of adult mortality rates.
Akaike information criteriaFootnote * values for the GC and GC-P models relative (difference) to the GP modelFootnote **

GP, Gompertz period; GC, Gompertz cohort; GC-P, Gompertz cohort-period.
* −2 × log(likelihood) + 2 × number of estimated parameters.
** Relative values that weight the goodness of fit of the model to empirical data. The lower the AIC, the better the model fit.
We next compared the fit of the Gompertz models (while adjusting for period and cohort effects) with other parametric models for adult mortality such as Weibull, power of age, logistic and Gompertz plus an extrinsic constant mortality.Reference Ricklefs 14 According to the AIC, the Gompertz model gives the best fit to the data in comparison with the other parametric models evaluated (see SI, Table S2).
Given that birth-cohort effects dominate as correlates of adult mortality, we next adopted the following final estimation procedure. First, we fitted Gompertz-cohort models simultaneously calibrating the Gompertz mortality parameters (A and G) and the birth-cohort effects (bi ). Afterwards, we kept the Gompertz mortality parameters fixed and recalibrated simultaneously the birth-cohort (bi ) and period (cj ) effects. We call this the GC-P model. As shown in Table 1, the AICs for the fits of the GC-P model to Canadian mortality data are even better. Similar results are obtained when using other countries mortality data as shown in the SI (Table S1).
Finally, we tested if these models explain jointly the observed female and male mortality patterns by country. In particular, we tested if gender differences were significant in terms of period effects, cohort effects or in the Gompertz mortality parameters. We found that in all countries gender differences in all model parameters were statistically significant and therefore we kept separate models for women and men (see SI, Table S3).
Differential gender and temporal birth cohort effects on declining mortality rates
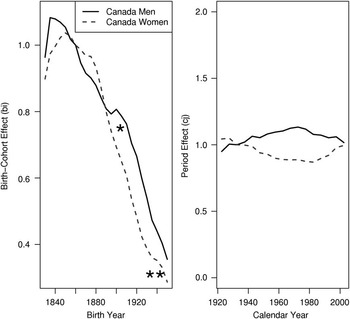
Figure 2 (left) shows temporal trends in the magnitude of the estimated birth-cohort effects (from the GC-P models) on age-specific adult mortality rates for Canada. These can be interpreted as the relative adult mortality between individuals born during different years in Canada. It is important to stress that birth cohort not only share one period of birth, but also an entire life-sequence of environments located in time. Birth-cohort effects therefore represent the impact of not only factors that occurred explicitly during the year of birth, but also of any other factors or events that may have caused variations in mortality across groups of individuals born in the same years. Examples of the later are the levels of nutrition and hygiene experienced during childhood and the levels of smoking, which varied significantly by birth cohort. The figure shows that adult mortality has decreased steadily by birth-cohort since the 1850s. Interestingly, the decrease in male mortality appears to have slowed down and even slightly reversed around the 1900 birth-cohort. This may be due, at least in part, to the effects of smoking on men’s health during the 20th century beginning with 1900 birth-cohort.Reference Burns, Garfinkel and Samet 15 A similar though less dramatic effect is seen among female birth-cohorts starting with the 1940s birth-cohorts, which is consistent with the later onset of the tobacco epidemic among women than men.Reference Burns, Garfinkel and Samet 15 Figure 2 (right) shows temporal trends in the magnitude of the estimated period effects (from the GC-P models) for Canada. These do not show a significant trend as the birth-cohort effects, consistent with the conclusion that birth-cohort effects are the dominant determinant of adult mortality rates.
Estimated birth-cohort effects for Canadian men (continuous line) and Canadian women (dashed line) (left). *May represent effect of smoking on male mortality. **May represent smoking effects on female mortality. Estimated period effects for Canadian men and Canadian women (right).

Infant mortality correlates with adult mortality
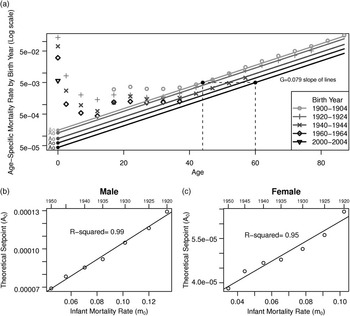
To investigate the relationship between infant experiences and adult mortality, we evaluated the correlation between a birth-cohort’s Gompertz adult mortality set point, A 0=biA (see equation 1), and the corresponding infant mortality rate, m 0. Figure 3b and c shows the values of A 0 v. m 0 for different birth cohorts in Canada and the corresponding R 2 value of their linear regression. The large values of R 2 for both men and women suggest a strong correlation between A 0 and m 0. On the basis of this regression, we can estimate the A 0 set point for the 2000–2004 birth-cohort using its known infant mortality rate, m 0. This leads to the prediction that the adult mortality rate experienced by a 45-year individual born in 1900–1904 will be delayed to that of a 60-year-old individual in the 2000–2004 birth-cohort (see Fig. 3a).
(a) Theoretical concept of the Gompertz mortality function. Based on Canadian data, the male adult mortality rates double every 8.7 years (=log(2)/G). During the entire 20th century the set point of the Gompertz mortality (A 0) has been decreasing steadily. The A 0 value for the 2000–2004 birth-cohort is estimated from its known infant mortality rate, m 0. (b) Theoretical (A 0) set point of adult mortality for specific male birth-cohorts (1920–1924, 1925–1929,…, 1950–1954) v. the corresponding infant mortality rates (m 0). (c) Theoretical (A 0) set point of adult mortality for specific female birth-cohorts (1920–1924, 1925–1929,…, 1950–1954) v. the corresponding infant mortality rates (m 0).

The findings suggest that the health conditions experienced during in utero development and infancy by a birth cohort can predict the starting level (A 0) of the adult’s Gompertz mortality thereby determining the level of the corresponding adult mortality rates. Figure 3a shows an idealization of this hypothesis using Canadian data. Similar figures based on other countries data are shown in the SI (Figures S1–S5).
Improving infant mortality is inversely correlated with an increasing mortality doubling rate (G)
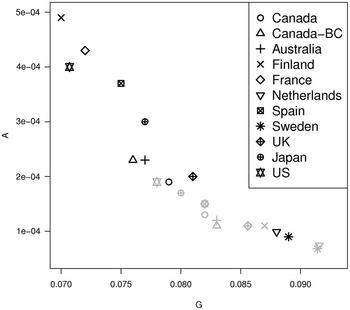
Figure 4 shows the Gompertz mortality parameter estimates for different countries. Values of G are inversely associated with values of A. Additionally, the parameter A is significantly higher for men than for women in all countries, whereas the mortality doubling rate, G, is higher in women than in men. This translates into age-specific mortality rates starting at age 40 years that are lower for adult women than for men but which exhibit shorter mortality doubling times (∼8 years for women v. ∼9 years for men). In other words, women’s mortality is systematically lower than men’s until late life, when it catches up entirely. There is uniform consistency in the inverse relationship between G and A for both men and women across multiple countries suggesting this is a general effect.
Gompertz function parameter estimates by country and gender. Female estimates in gray and male estimates in black. The lowest value of G (0.070) corresponds to a mortality rate doubling time (MRDT) of 9.9 years. The highest value of G (0.092) corresponds to a MRDT of 7.5 years.

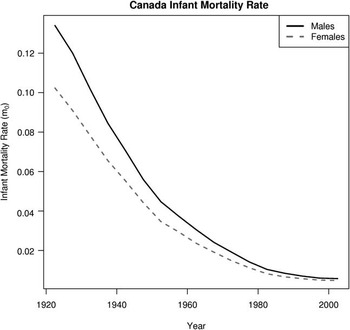
We also explored trends in infant mortality rates through time. Figure 5 shows that the infant mortality rates in Canada have decreased dramatically since the 1920s and that the male excess in infant mortality has substantially decreased in recent years.
Canada gender specific infant mortality rates from 1921–2005.

Evidence that the birth cohort effect acts during fetal and infant development
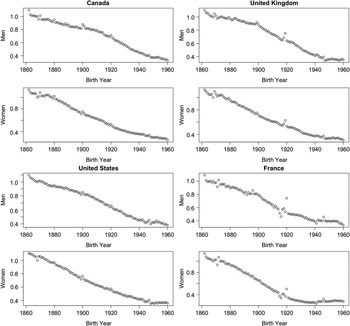
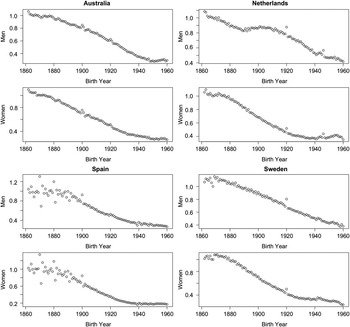
Birth cohort effects on adult mortality may be due to environmental influences acting during the developmental plasticity of fetal and infant life or may be traceable to life long characteristics that associate with a specific birth cohort. To explore this further, we developed additional GC-P models by single year age groups and single calendar/birth years for eight selected countries. Figures 6 and 7 show declining adult mortality rates due to the birth cohort effect for males and females across the eight countries evaluated. To assess the significance of any departures from the observed trend for any particular year, we also fitted auto-regressive integrated moving average time series models to the birth cohort effects per country and gender. Figures S6 and S7 in the SI show the standardized residuals (difference between model prediction and observed value) from the fitted models. Although all countries show overall declining rates, four countries (France, Netherlands, United Kingdom and Sweden) show a statistically significant rise in adult mortality for the 1920 birth cohort. Additionally, Australia, Canada and the United States showed marked rise in adult mortality for the 1900 cohort and the Netherlands and France for the 1944 birth cohort. As the elevated adult mortality rate was seen only among specific birth cohorts and not in the several years prior (or after), these data suggest that the first year of life is uniquely vulnerable to environmental influences that determine the onset level of the Gompertz adult mortality function.
Estimated birth-cohort effects relative to 1867 by single years for Canada, UK, US and France showing men and women separately. For selected countries the 1900, 1920 and 1944 birth cohorts exhibit increased adult mortality rates.

Estimated birth-cohort effects relative to 1867 by single years for Australia, Netherlands, Spain and Sweden showing men and women separately. For selected countries the 1900, 1920 and 1944 birth-cohorts exhibit increased adult mortality rates.

Discussion
This study used generalizations of APC models to analyze the age-specific mortality rates observed over the past century in Canada and nine other countries. The analyses provide strong statistical support for the hypothesis that early life experiences strongly determine adult mortality patterns. Yashin et al.Reference Yashin, Begun, Boiko, Ukraintseva and Oeppen 16 previously investigated the variation of the Gompertz mortality parameters in terms of period and birth-cohort using mortality data from Sweden. However, to our knowledge no statistical analysis of the exponential increase in adult mortality rates while simultaneously adjusting for both period and cohort effects has been previously carried out before. This adjustment is essential as improvements in infant survival rates have been occurring in parallel to improvements in the survival from adult chronic diseases, such as atherosclerosis, stroke and cancer.
The potential correlation between early life conditions and adult mortality rates and the significance of birth-cohort effects on mortality trends have been widely considered.Reference Kermack, McKendrick and McKinlay 1 – Reference Finch and Crimmins 4 , Reference Caselli and Capocaccia 17 – Reference Yang 21 Ever since the observations by GompertzReference Gompertz 22 in 1825, it has been noted that adult mortality exponentially increases with age doubling every 8 to 9 years and used to develop theories of aging in humans and other species.Reference Jones 2 , Reference Strehler and Mildvan 6 , Reference Ricklefs 14 , Reference Prentice and Shaarawi 23 – Reference Gurven and Fenelon 30 The dramatic decline in the levels of infant and childhood mortality during the 18th and 19th century was speculated to have contributed significantly to the reduction of the levels of adult mortality for the cohorts born in the 18th and 19th centuries.Reference Crimmins and Finch 3 , Reference Finch and Crimmins 4 , Reference Catalano and Bruckner 20 However, the relationship between early and later-life conditions was expected to be less significant for 20th century cohorts due to several factors, such as the already low levels of childhood mortality at the beginning of the century, the rise of the tobacco epidemic, the widespread adoption of routine childhood immunization and the remarkable advancements in medical therapy during this century.Reference Crimmins and Finch 3 , Reference Yang 21 Thus, it is of considerable interest that our analysis shows that the onset level of the Gompertz mortality function has continued to shift to lower values with later birth cohorts throughout the 20th century and remains of continuing demographic importance.
Birth-cohort effects can be due to a variety of population traits that act across the lifecycle, such as common behavioral and dietary characteristics and shared external, environmental conditions among others. However, the regression of the Gompertz mortality set point, A 0, v. the infant mortality rates, m 0, suggests that a surprisingly large-fraction of the estimated cohort effects can be explained by early life conditions (for which m 0 is a proxy variable). Additionally, the impact of major period events such as the 1918 influenza pandemic or the second world war, which affected all age-groups across a population but were associated with elevated adult mortality only in specific birth cohorts, localizes the period of maximum vulnerability before the end of the first year of life.Reference Mazumder, Almond, Park, Crimmins and Finch 31 Other authors reached similar conclusions using different approaches. In particular, Caselli et al.Reference Caselli and Capocaccia 17 found that the adult mortality during the early-mid 20th century in Italy depended on the cumulative mortality experienced by birth cohorts up to age 15 years using APC models. Catalano et al.Reference Catalano and Bruckner 20 found a significant relationship between mortality before age 5 years experienced in Sweden, Denmark and England and Wales during the 18th, 19th and early 20th centuries, respectively, and the corresponding life expectancy using time series analysis. Crimmins and FinchReference Crimmins and Finch 3 found a strong correlation between age 70–74 years mortality rates and the corresponding childhood mortality in four northern European countries during the 18th and 19th centuries using regression analyses.
The inverse relation between the values of A and G in different countries was somewhat unexpected although was previously noted by Strehler et al.Reference Strehler and Mildvan 6 and others.Reference Hawkes, Smith and Robson 29 , Reference Gurven and Fenelon 30 The relationship between A and G may suggest that there may be a biological limit to human life span in which optimal early-life conditions are somehow compensated by a shorter adult mortality doubling time. Alternatively, one could hypothesize that the inverse relationship may be due to relaxation of natural selection during the early stages of life on the fitness of adult individuals.Reference Gurven and Fenelon 30
How early life conditions influence adult susceptibility to chronic disease is uncertain. Multiple mechanisms have been suggested. For example, it has been proposed that early life inflammatory responses to disease are strongly correlated with cardiovascular diseases in the aged potentially due to promoting the early onset of atherogenesis.Reference Crimmins and Finch 3 The high levels of cell division associated with inflammatory responses in early life may also act to increase the risk of genetic alterations that predispose to cancer later in life.Reference Medzhitov 32 Chronic infection acquired early in life such as that due to cytomegalovirus has been associated with premature immunosenescence and age-related chronic disease.Reference Sauce, Larsen and Fastenackels 33 Of current interest are observations summarized by Gluckman et al.Reference Gluckman, Hanson, Cooper and Thornburg 34 that adverse early life events epigenetically modify the genome and change phenotypic expression of critical molecular pathways that regulate the stress and aging responses. McGowan et al.Reference McGowan, Sasaki and D’Alessio 35 convincingly showed that early life events somatically modify the genome. In that report, it was shown that DNA methylation changes to the region encoding the promoter of the glucocorticoid receptor gene in the brain of adults who committed suicide was characteristic of individuals who suffered abuse as children. Thus, the data from this study may reflect a unique adaptive developmental plasticity of the fetal and infant epigenome, which broadly determines the rate of aging and thus susceptibility to the chronic diseases of the adult years. KenyonReference Kenyon 36 elucidated molecular pathways that regulate aging in multiple model organisms and proposed that the insulin response pathways regulate longevity in humans. It may be that improved fetal and infant conditions set a molecular clock that determines aging through epigenome modification. Future research should focus on how specific experiences during the highly plastic early life period shape molecular and biological responses to disease vulnerability later in life.
On a practical level these data show that long-term trends in adult mortality rates may be largely determined by conditions laid down early in life. This suggests that continued public health investment in the health of mothers and children is a broad primary prevention strategy that should reduce adult chronic disease susceptibility. Addressing disparities in infant mortality rates among different geographic jurisdictions and ethnic groups is a high priority likely to advance population health and contribute to chronic disease prevention among at risk groups, although with a very long lag-time, approaching 80 years on average in the current era. When maternal-child health programs are coupled with policies that address the social determinants of chronic diseases, with messages that inform personal choice and with the targeted provision of evidence-based therapies to treat chronic disease, large gains in mortality reduction could be feasible. Such coordinated public health strategies are applicable in both developed and developing country settings.Reference Daar, Singer and Persad 37
Acknowledgements
This work was supported in part by funding from the Provincial Health Services Authority Centres for Population and Public Health. R. M. acknowledges the support of the Division of Mathematical Modeling at the UBC Centre for Disease Control. B.P. acknowledges the support of the Michael Smith Foundation for Health Research (MSFHR – Senior Scholar Funds).
Statement of interest
None.