1 Introduction
Jets in cross-flow (JICF), or transverse jets, are a canonical flow where a jet of fluid is injected normal to a cross-flow. An incoming flat-plate boundary layer interacts with a wall-normal jet, creating a complex array of inter-related vortical structures. The shear-layer vortices and the Kelvin–Helmholtz instability are typically observed on the upstream side of the jet. The counter-rotating vortex pair (CVP), which dominates the jet cross-section (Kamotani & Greber Reference Kamotani and Greber1972; Smith & Mungal Reference Smith and Mungal1998), persists far downstream and is a characteristic feature of transverse jets. Additionally, horseshoe vortices are formed near the wall just upstream of the jet exit and wrap around the jet (Krothapalli, Lourenco & Buchlin Reference Krothapalli, Lourenco and Buchlin1990; Kelso & Smits Reference Kelso and Smits1995). As the horseshoe vortices travel downstream they begin to tilt upward during ‘separation events’ (Fric & Roshko Reference Fric and Roshko1994) caused by the adverse pressure gradient created as the jet entrains fluid from the boundary layer. This process forms wake vortices that extend up in the wall-normal direction through the jet wake (Fric & Roshko Reference Fric and Roshko1994; Eiff, Kawall & Keffer Reference Eiff, Kawall and Keffer1995; Kelso, Lim & Perry Reference Kelso, Lim and Perry1996; McMahon, Hester & Palfery Reference McMahon, Hester and Palfery1971; Moussa, Trischka & Eskinazi Reference Moussa, Trischka and Eskinazi1977). Transverse jets may be found in many real-world engineering applications including: gas turbine combustor dilution jets, film cooling, vertical and/or short take-off and landing (V/STOL) aircraft and thrust vectoring. Reviews by Margason (Reference Margason1993), Karagozian (Reference Karagozian2010) and Mahesh (Reference Mahesh2013) compile most of this research, both experimentally and computationally, over the last seven decades.
The JICF may be characterized by the following parameters: the jet Reynolds number,
 $$\begin{eqnarray}\displaystyle Re=\overline{v}_{jet}D/\unicode[STIX]{x1D708}_{jet}, & & \displaystyle\end{eqnarray}$$
based on the average velocity (
 $\overline{v}_{jet}$
) at the jet exit, the diameter (
 $D$
), and the kinematic viscosity of the jet (
 $\unicode[STIX]{x1D708}_{jet}$
); the cross-flow Reynolds number,
 $$\begin{eqnarray}\displaystyle Re_{\infty }=u_{\infty }D/\unicode[STIX]{x1D708}, & & \displaystyle\end{eqnarray}$$
based on the free-stream velocity (
 $u_{\infty }$
) and kinematic viscosity of cross-flow (
 $\unicode[STIX]{x1D708}$
); the momentum flux ratio,
 $$\begin{eqnarray}\displaystyle J=\unicode[STIX]{x1D70C}_{jet}\overline{v}_{jet}^{2}/\unicode[STIX]{x1D70C}_{\infty }u_{\infty }^{2}, & & \displaystyle\end{eqnarray}$$
where
 $\unicode[STIX]{x1D70C}_{jet}$
and
 $\unicode[STIX]{x1D70C}_{\infty }$
are the density of the jet and free stream, respectively. When the jet and free-stream densities are equal, as in isodensity flows, the jet to cross-flow velocity ratio is appropriate and is defined as,
 $$\begin{eqnarray}\displaystyle R=\overline{v}_{jet}/u_{\infty }. & & \displaystyle\end{eqnarray}$$
This ratio can also be defined as,
 $$\begin{eqnarray}\displaystyle R^{\ast }=\frac{v_{jet,max}}{u_{\infty }} & & \displaystyle\end{eqnarray}$$
based on the maximum velocity at the jet exit. The present work considers low-speed jets in cross-flow that are isodensity, and
 $R$
is used as the characterization parameter.
Megerian et al. (Reference Megerian, Davitian, Alves and Karagozian2007) performed experiments on the JICF at
 $Re$
of
 $2000$
and
 $3000$
over the range
 $1\leqslant R\leqslant 10$
. They collected vertical velocity spectra along the upstream shear layer and observed this region to transition from absolutely to convectively unstable between
 $R=2$
and
 $R=4$
. When
 $R=2$
, Megerian et al. (Reference Megerian, Davitian, Alves and Karagozian2007) observed in the upstream shear layer a strong tone at a single Strouhal number (
 $St=fD/v_{jet,max}$
), based on the jet exit diameter (
 $D$
) and the maximum velocity at the jet exit (
 $v_{jet,max}$
). This disturbance originated near the jet exit and was also observed further downstream. This is consistent with an absolute instability, which grows at the point of origin and travels downstream. Conversely, when
 $R=4$
Megerian et al. (Reference Megerian, Davitian, Alves and Karagozian2007) observed that upstream shear-layer instabilities are weaker and a broader spectrum formed further downstream. This behaviour is consistent with a convective instability, which grows as it travels downstream.
Iyer & Mahesh (Reference Iyer and Mahesh2016) performed direct numerical simulations (DNS) matching the experimental set-up of Megerian et al. (Reference Megerian, Davitian, Alves and Karagozian2007) and were able to capture the complex shear-layer instability. Vertical velocity spectra from simulation show good agreement with experiment and observed the same stability transition between
 $R=2$
and
 $R=4$
. In an effort to further understand this transition, Iyer & Mahesh (Reference Iyer and Mahesh2016) suggested that the leading edge shear layer is actually a counter-current shear layer. According to the classic analysis by Huerre & Monkewitz (Reference Huerre and Monkewitz1985), the following velocity ratio characterizes the stability of counter-current mixing layers:
 $$\begin{eqnarray}\displaystyle Q=\frac{V_{1}-V_{2}}{V_{1}+V_{2}}, & & \displaystyle\end{eqnarray}$$
where
 $V_{1}$
and
 $V_{2}$
are the velocities of the two mixing layers. Huerre & Monkewitz (Reference Huerre and Monkewitz1985) show that for
 $Q>1.315$
a mixing layer is absolutely unstable, whereas if
 $Q<1.315$
the mixing layer is convectively unstable. Iyer & Mahesh (Reference Iyer and Mahesh2016) calculated
 $Q$
from their simulation for
 $R=2$
and
 $R=4$
. The mixing layer velocities were taken as the maximum and minimum (most negative) vertical velocities across the upstream shear layer of the turbulent mean flows. Iyer & Mahesh (Reference Iyer and Mahesh2016) found that
 $Q=1.44$
and
 $Q=1.20$
for
 $R=2$
and
 $R=4$
, respectively. This suggests that the mechanism that drives the stability for free shear layers may also drive stability characteristics for complex flows like the JICF.
Furthermore, experiments of Narayanan, Barooah & Cohen (Reference Narayanan, Barooah and Cohen2003) have shown that when
 $R=6$
, low-amplitude excitation of JICFs that have convectively unstable upstream shear layers could promote mixing. Conversely, M’Closkey et al. (Reference M’Closkey, King, Cortelezzi and Karagozian2002) and Shapiro et al. (Reference Shapiro, King, M’Closkey and Karagozian2006) have shown that when
 $R\leqslant 4$
, high-amplitude excitation has little success increasing jet penetration or mixing. These results highlight the importance of furthering our understanding of the upstream shear layer’s transition from absolutely to convectively unstable, due to the effect on which control strategies are most successful.
Alves, Kelly & Karagozian (Reference Alves, Kelly and Karagozian2008) have studied the stability of JICFs using local linear stability analysis. They study the spatial stability of two different base flows; a modified version of the potential flow solution by Coelho & Hunt (Reference Coelho and Hunt1989) and continuous velocity model based on the same potential flow solution (valid for larger values of Strouhal number). In their analysis they prescribe a temporal wavenumber,
 $\unicode[STIX]{x1D714}$
, which is real (i.e. zero growth rate), and solve for the complex spatial wavenumber,
 $\unicode[STIX]{x1D6FC}$
.
The linear stability of the JICF has been studied by Bagheri et al. (Reference Bagheri, Schlatter, Schmid and Henningson2009), which marks one of the first simulation-based tri-global linear stability analysis (LSA) of a fully three-dimensional base flow. From this point on, global LSA (GLSA) will refer to tri-global linear stability analysis unless otherwise specified. Bagheri et al. (Reference Bagheri, Schlatter, Schmid and Henningson2009) studied the stability of the JICF at a jet to cross-flow velocity ratio
 $R^{\ast }=3$
(1.5), with a Reynolds number
 $Re_{\unicode[STIX]{x1D6FF}_{0}^{\ast }}=U_{\infty }\unicode[STIX]{x1D6FF}_{0}^{\ast }/\unicode[STIX]{x1D708}=165$
, based on the displacement thickness
 $\unicode[STIX]{x1D6FF}_{0}^{\ast }$
at the inlet of the cross-flow, or equivalently
 $Re_{cf}=Du_{\infty }/\unicode[STIX]{x1D708}_{\infty }=495$
, based on the jet exit diameter
 $D$
. The steady base flow at this value of
 $R^{\ast }$
was obtained using selective frequency damping (SFD) (Åkervik et al.
Reference Åkervik, Brandt, Henningson, Hœpffner, Marxen and Schlatter2006). The jet nozzle was not included in their simulation and a parabolic velocity profile from pipe Poiseuille flow was imposed at the jet exit. Unstable high-frequency modes associated with the upstream shear layer as well as lower-frequency wake modes were identified in their work. Additionally, it was shown that the shedding frequency for the upstream shear layer was not far from the nonlinear shedding frequency. However, the linear wake mode frequency was far from the nonlinear wake frequency. Bagheri et al. (Reference Bagheri, Schlatter, Schmid and Henningson2009) suggested that the differences in shedding frequencies could be related to the differences between the SFD solution and the time-averaged solution.
Peplinski, Schlatter & Henningson (Reference Peplinski, Schlatter and Henningson2015) extended upon the analysis of Bagheri et al. (Reference Bagheri, Schlatter, Schmid and Henningson2009) to include
 $R^{\ast }=1.5$
and
 $R^{\ast }=1.6$
. Peplinski et al. (Reference Peplinski, Schlatter and Henningson2015) used modal and non-modal linear analysis to study the JICF. They observed an almost identical wavepacket develop for the stable (
 $R^{\ast }=1.5$
) and unstable (
 $R^{\ast }=1.6$
) cases, and were able to determine the bifurcation point of
 $R^{\ast }$
to lie between
 $1.5$
and
 $1.6$
.
In the present work, the stability of the JICF is studied using GLSA of the turbulent mean flow. To the best of our knowledge, the grid resolution and size of the eigenvalue problem for GLSA go beyond what has been reported in the literature. The jet nozzle is included in our simulation and matches the experimental nozzle used by Megerian et al. (Reference Megerian, Davitian, Alves and Karagozian2007), which is designed to produce a top-hat profile at the jet exit. When performing DNS of the JICF, it is very computationally expensive to solve the tri-global eigenvalue problem directly. For example, using a grid with 80 million elements poses an eigenvalue problem with a dimension of 240 million. A variant of the Arnoldi iteration method (Arnoldi Reference Arnoldi1951) is therefore used to efficiently calculate the leading eigenvalues and their associated eigenmodes.
In § 2 the numerics used for DNS (§ 2.1) and LSA (§ 2.2) are discussed. The validation cases for GLSA are described in § 3. Next, § 4 provides an overview of the computational set-up for studying the JICF. Section 5 highlights the results from GLSA, along with an in-depth analysis of the GLSA eigenmodes. Concluding the paper is § 6 which includes a brief summary and discussion of the presented results as well as some applications to control.
2 Numerical methodology
The numerical method in the unstructured fluid solver is briefly discussed. Next, an overview of modal linear stability analysis and details regarding the iterative eigenvalue solver are provided.
2.1 Direct numerical simulation
Simulations are performed using an unstructured, finite-volume algorithm developed by Mahesh, Constantinescu & Moin (Reference Mahesh, Constantinescu and Moin2004) for solving the incompressible Navier–Stokes (N–S) equations:
 $$\begin{eqnarray}\displaystyle \frac{\unicode[STIX]{x2202}u_{i}}{\unicode[STIX]{x2202}t}+\frac{\unicode[STIX]{x2202}}{\unicode[STIX]{x2202}x_{j}}u_{i}u_{j}=-\frac{\unicode[STIX]{x2202}p}{\unicode[STIX]{x2202}x_{i}}+\unicode[STIX]{x1D708}\frac{\unicode[STIX]{x2202}^{2}u_{i}}{\unicode[STIX]{x2202}x_{j}\unicode[STIX]{x2202}x_{j}},\qquad \frac{\unicode[STIX]{x2202}u_{i}}{\unicode[STIX]{x2202}x_{i}}=0, & & \displaystyle\end{eqnarray}$$
where
 $\unicode[STIX]{x1D708}$
is the kinematic viscosity of the fluid. The spatial discretization emphasizes discrete kinetic energy conservation, which allows for the simulation of complex flows at high Reynolds numbers without added numerical dissipation. Adams–Bashforth second-order time integration is used to advance the predictor velocities through the momentum equation. A Poisson equation for pressure is then derived by taking the divergence of the momentum equation and satisfying continuity. This is used in a corrector step to project the solution onto a divergence-free velocity field.
The algorithm has been validated for a variety of canonical and complex flows, including: a gas turbine combustor (Mahesh et al. Reference Mahesh, Constantinescu and Moin2004), free jet entrainment (Babu & Mahesh Reference Babu and Mahesh2004) and transverse jets (Muppidi & Mahesh Reference Muppidi and Mahesh2005, Reference Muppidi and Mahesh2007, Reference Muppidi and Mahesh2008; Sau & Mahesh Reference Sau and Mahesh2007, Reference Sau and Mahesh2008).
2.2 Linear stability analysis
Modal LSA is the study of the dynamic response of a base state (i.e. base flow) subject to external perturbations (see Theofilis (Reference Theofilis2011) for a review). In the present work, the incompressible Navier–Stokes equations (2.1) are linearized about a base state,
 $\overline{\boldsymbol{u}}_{i}$
and
 $\overline{p}$
. The base state can be assumed to vary arbitrarily in space. If the flow field is decomposed into a base state subject to a small
 $O(\unicode[STIX]{x1D700})$
perturbation,
 $$\begin{eqnarray}\displaystyle \boldsymbol{u}_{i}=\overline{\boldsymbol{u}}_{i}+\unicode[STIX]{x1D700}\tilde{\boldsymbol{u}}_{i},\hspace{28.45274pt}p=\overline{p}+\unicode[STIX]{x1D700}\tilde{p}, & & \displaystyle\end{eqnarray}$$
the governing equations (2.1) can be linearized by neglecting the
 $\unicode[STIX]{x1D700}^{2}$
terms. Additionally, if the base state is a solution to the incompressible Navier–Stokes equations (2.1), the base flow equations can be subtracted. This yields the linearized Navier–Stokes (LNS) equations:
 $$\begin{eqnarray}\displaystyle \frac{\unicode[STIX]{x2202}\tilde{\boldsymbol{u}}_{i}}{\unicode[STIX]{x2202}t}+\frac{\unicode[STIX]{x2202}}{\unicode[STIX]{x2202}x_{j}}\tilde{\boldsymbol{u}}_{i}\overline{\boldsymbol{u}}_{j}+\frac{\unicode[STIX]{x2202}}{\unicode[STIX]{x2202}x_{j}}\overline{\boldsymbol{u}}_{i}\tilde{\boldsymbol{u}}_{j}=-\frac{\unicode[STIX]{x2202}\tilde{p}}{\unicode[STIX]{x2202}x_{i}}+\unicode[STIX]{x1D708}\frac{\unicode[STIX]{x2202}^{2}\tilde{\boldsymbol{u}}_{i}}{\unicode[STIX]{x2202}x_{j}\unicode[STIX]{x2202}x_{j}},\qquad \frac{\unicode[STIX]{x2202}\tilde{\boldsymbol{u}}_{i}}{\unicode[STIX]{x2202}x_{i}}=0. & & \displaystyle\end{eqnarray}$$
Note that the same numerical techniques are used to solve the LNS equations (2.3) and the N–S equations (2.1). A molecular viscosity is used to obtain both the base flow and in LSA since the base flow is obtained from DNS where all relevant scales are directly resolved and no subgrid-scale model is used.
The LNS equations (2.3) may be rewritten as a system of linear equations,
 $$\begin{eqnarray}\displaystyle \frac{\unicode[STIX]{x2202}\tilde{\boldsymbol{u}}_{i}}{\unicode[STIX]{x2202}t}=\unicode[STIX]{x1D63C}\tilde{\boldsymbol{u}}_{i}, & & \displaystyle\end{eqnarray}$$
where
 $\unicode[STIX]{x1D63C}$
is the LNS operator and
 $\tilde{\boldsymbol{u}}_{i}$
is the divergence-free velocity perturbation field. In modal LSA, our interest is in the long-time behaviour of
 $\tilde{\boldsymbol{u}}_{i}$
. Consequently, the solutions to the linear system of equations (2.4) are of the form:
 $$\begin{eqnarray}\displaystyle \tilde{\boldsymbol{u}}_{i}\left(x,y,z,t\right)=\mathop{\sum }_{\unicode[STIX]{x1D714}}\hat{\boldsymbol{u}}_{i}\left(x,y,z\right)\text{e}^{\unicode[STIX]{x1D714}t}+\text{c.c.}, & & \displaystyle\end{eqnarray}$$
where
 $\unicode[STIX]{x1D714}$
and
 $\hat{\boldsymbol{u}}_{i}$
can be complex. This defines the
 $\text{Re}\!\left(\unicode[STIX]{x1D714}\right)$
as the growth/damping rate and the
 $\text{Im}\!\left(\unicode[STIX]{x1D714}\right)$
as the temporal frequency of the complex velocity coefficient (
 $\hat{\boldsymbol{u}}_{i}$
). Substituting the ansatz (2.5) into the LNS system (2.4) transforms the system of equations into a linear eigenvalue problem,
 $$\begin{eqnarray}\displaystyle \unicode[STIX]{x03A9}\hat{\boldsymbol{U}}_{i}=\unicode[STIX]{x1D63C}\hat{\boldsymbol{U}}_{i}, & & \displaystyle\end{eqnarray}$$
where
 $\unicode[STIX]{x1D714}_{j}=\text{diag}\!\left(\unicode[STIX]{x03A9}\right)_{j}$
is the
 $j$
th eigenvalue and
 $\hat{\boldsymbol{u}}_{i}^{j}=\unicode[STIX]{x1D650}_{i}[j,:]$
is the
 $j$
th eigenvector (i.e. eigenmode). For GLSA, the size of the eigenvalue problem (2.6) can be
 $O$
(
 $10^{6}$
–
 $10^{8}$
). This makes solving the eigenvalue problem using direct methods very computationally expensive, often prohibitively so. Instead, an extension of the Arnoldi iteration method (Arnoldi Reference Arnoldi1951) called the implicitly restarted Arnoldi method (IRAM), a matrix-free method, is used. The present work makes use of the IRAM implemented in the open-source P_ARPACK library (Lehoucq, Sorensen & Yang Reference Lehoucq, Sorensen and Yang1997) to efficiently calculate the leading (i.e. most unstable) eigenvalues and their associated eigenmodes.
A temporal exponential transformation of the eigenvalue spectrum is then performed. This transforms the most unstable eigenvalues into the most dominant (i.e. largest magnitude) eigenvalues, which P_ARPACK can solve for efficiently. To do this, the eigenvalue problem (2.6) is integrated over some time,
 $\unicode[STIX]{x1D70F}$
:
 $$\begin{eqnarray}\displaystyle \int _{0}^{\unicode[STIX]{x1D70F}}\unicode[STIX]{x03A9}\hat{\boldsymbol{U}}_{i}\hspace{2.22198pt}\text{d}t=\int _{0}^{\unicode[STIX]{x1D70F}}\unicode[STIX]{x1D63C}\hat{\boldsymbol{U}}_{i}\hspace{2.22198pt}\text{d}t. & & \displaystyle\end{eqnarray}$$
This yields the exponential of the eigenvalue problem (2.6):
 $$\begin{eqnarray}\displaystyle \text{e}^{\unicode[STIX]{x03A9}\unicode[STIX]{x1D70F}}\hat{\boldsymbol{U}}_{i}=\text{e}^{\unicode[STIX]{x1D63C}\unicode[STIX]{x1D70F}}\hat{\boldsymbol{U}}_{i}, & & \displaystyle\end{eqnarray}$$
which can be rewritten as:
 $$\begin{eqnarray}\displaystyle \boldsymbol{\unicode[STIX]{x1D6F4}}\hat{\boldsymbol{U}}_{i}=\unicode[STIX]{x1D63D}\hat{\boldsymbol{U}}_{i}, & & \displaystyle\end{eqnarray}$$
where
 $\unicode[STIX]{x1D70E}_{j}=\text{diag}\!\left(\boldsymbol{\unicode[STIX]{x1D6F4}}\right)_{j}$
. The matrix exponential
 $\unicode[STIX]{x1D63D}=\text{e}^{\unicode[STIX]{x1D63C}\unicode[STIX]{x1D70F}}$
is a time integration operator, which acts as a numerical simulation of the LNS equations (2.3) over a time
 $\unicode[STIX]{x1D70F}$
. This method is therefore called a time stepper method. Note that between the two eigenvalue problems (2.6), (2.9), the eigenvectors,
 $\hat{\boldsymbol{U}}_{i}$
, are the same. However, the eigenvalues of the original problem (2.6) must be recovered using the following relationship:
 $$\begin{eqnarray}\displaystyle \unicode[STIX]{x1D714}_{j}=\frac{1}{\unicode[STIX]{x1D70F}}\ln \unicode[STIX]{x1D70E}_{j}. & & \displaystyle\end{eqnarray}$$
When using a time stepper method, the choice of the integration time
 $\unicode[STIX]{x1D70F}$
is dependent on the time scales of interest for the problem at hand. It is imperative that
 $\unicode[STIX]{x1D70F}$
is less than the smallest time scales
 $t_{s}$
of interest; usually
 $\unicode[STIX]{x1D70F}=t_{s}/2$
is appropriate. As for capturing the largest time scales
 $t_{L}$
of interest, the number of Arnoldi vectors
 $\boldsymbol{N}_{A}$
is important. Once
 $\unicode[STIX]{x1D70F}$
is determined, the number of Arnoldi vectors must be greater than
 $t_{L}/\unicode[STIX]{x1D70F}$
; usually
 $N_{A}>2t_{L}/\unicode[STIX]{x1D70F}$
is appropriate. Overall, some knowledge of the range of time scales is needed to effectively use the IRAM in conjunction with a time stepper method. Additionally, note that performing stability analysis on problems with a large range of time scales can drastically effect the computational cost and storage requirements as each Arnoldi vector must be stored for each Arnoldi iteration.
For increasingly complex and globally unstable flows, a steady-state solution may be difficult and computationally expensive to obtain. As modal stability analysis looks to study the stability of more interesting problems, other approaches are being taken to solve for base states. SFD may be used to solve for a steady-state solution. This is achieved by adding a forcing term to the right-hand side, which acts as a temporal low-pass filter. Some knowledge of the lowest unstable frequency is required when choosing the filter width. In order to converge to a steady solution, the filter cutoff frequency must be lower than that of all of the flow instabilities. Although this method lends itself to easy implementation, the computational cost is governed by the range of time scales. Additionally, SFD fails to damp instabilities that are non-oscillatory, as shown by Vyazmina (Reference Vyazmina2010).
Another option is to use a turbulent mean flow as a base state. Perhaps the best known example where LSA about the turbulent mean flow succeeds over the steady-state solution is the oscillating wake of a circular cylinder; which agree at onset, but LSA about the steady-state solution fails to capture the observed vortex shedding frequency far away from the bifurcation. Recent studies by Turton, Tuckerman & Barkley (Reference Turton, Tuckerman and Barkley2015) and Tammisola & Juniper (Reference Tammisola and Juniper2016) look to further our understanding of what it means to perform GLSA around a turbulent mean flow. Additionally, Barkley (Reference Barkley2006) and Turton et al. (Reference Turton, Tuckerman and Barkley2015) show that performing a LSA around a turbulent mean flow results in eigenvalues which have small real parts and non-zero imaginary frequencies.
Since a turbulent mean flow is a solution to the Reynolds-averaged N–S equations, a nonlinear Reynolds stress term is effectively added to the LNS equations when the base flow equations are removed (2.1)–(2.3). This translates into a mode-dependent Reynolds stress being present in the eigenvalue problem (2.6). A scale-separation argument, first introduced by Crighton & Gaster (Reference Crighton and Gaster1976), and more recently discussed in the review by Jordan & Colonius (Reference Jordan and Colonius2013), can be used to justify when the mode-dependent Reynolds stress term is negligible. Only for the modes of interest (typically low frequency and large scale) must the Reynolds stress term be shown to be unimportant. For turbulent problems, multiple orders of magnitude can separate the time and length scales of turbulent motions (
 $t_{\unicode[STIX]{x1D702}}$
and
 $\unicode[STIX]{x1D702}$
, respectively) with the motions of interest (
 $L$
and
 $t_{L}$
, respectively). Relationships between turbulent and large-scale motions of interest can be determined from the Kolmogorov scales as seen in Pope (Reference Pope2000, pp. 186):
 $$\begin{eqnarray}\displaystyle & L/\unicode[STIX]{x1D702}=Re^{3/4},\quad t_{L}/t_{\unicode[STIX]{x1D702}}=Re^{1/2}. & \displaystyle\end{eqnarray}$$
Therefore, if the scale-separation argument is to hold, there must be a significant gap between scales of interest for GLSA and the turbulent motions themselves. It can be shown by using the relationships above (2.11) that using a turbulent mean flow as a base state in GLSA may provide meaningful physical insight with respect to stability.
3 Validation
The LSA capability developed for the present work is validated in this section. Table 1 outlines the validation cases for the present work. First, parallel flow LSA of a Blasius boundary layer subject to a streamwise Tollmien–Schlichting (T–S) wave is compared to the results of Criminale, Jackson & Joslin (Reference Criminale, Jackson and Joslin2003). Second, bi-global LSA of a two-dimensional (2-D) lid-driven cavity with a spanwise wave disturbance is compared to the work of Ding & Kawahara (Reference Ding and Kawahara1998). Next, GLSA of a 3-D lid-driven cavity is validated against Gómez, Gómez & Theofilis (Reference Gómez, Gómez and Theofilis2014). Finally, GLSA of laminar channel flow is compared to the classic parallel flow LSA results for Poiseuille flow.
Descriptions of the cases used for validation.

3.1 Parallel flow LSA
Parallel flow LSA assumes wave-like homogeneity in time and two spatial directions. This allows for the governing equations to be simplified to an ordinary differential equation, which reduces the computational cost of solving the associated LSA eigenvalue problem. Here, the stability of a Blasius boundary layer is chosen as a validation case due to its simplicity and the extensive analysis in the literature. For this problem the spanwise and streamwise directions are assumed to be homogeneous.
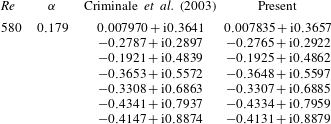
Criminale et al. (Reference Criminale, Jackson and Joslin2003) provide temporal LSA results for a Blasius boundary layer subject to a streamwise T–S disturbance. The applied T–S disturbance has a wavenumber
 $\unicode[STIX]{x1D6FC}=0.179$
and is applied at
 $Re=580$
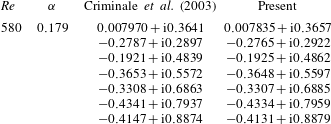
, based on the boundary layer thickness. The eigenvalue problem corresponding to the Orr–Sommerfeld equations is solved directly by Criminale et al. (Reference Criminale, Jackson and Joslin2003). Conversely, in the present work the eigenvalue problem associated with the 2-D LNS (2.3) is instead solved directly for consistency throughout the validation process. The seven leading eigenvalues show good agreement with the present work as shown in table 2.
3.2 Bi-global LSA
A 2-D lid-driven cavity is studied using bi-global LSA. Here, time and the spanwise direction are assumed to be homogeneous. Consequently, the base state is the 2-D steady-state solution for the square lid-driven cavity at
 $Re=200$
, based on the cavity height and lid velocity. Two purely real (i.e. oscillatory) spanwise wavenumbers (
 $\unicode[STIX]{x1D6FD}=6,9$
) are individually applied as perturbations to the base state. The 2-D LNS (2.3) are solved in conjunction with the time stepper method and IRAM that was outlined in § 2.2.
Results from bi-global LSA are compared with Ding & Kawahara (Reference Ding and Kawahara1998) in table 3. The leading eigenvalues for the two spanwise perturbations show good agreement with the results of Ding & Kawahara (Reference Ding and Kawahara1998).
The leading eigenvalues (
 $c_{j}=\unicode[STIX]{x1D714}_{j}/\unicode[STIX]{x1D6FC}$
) from parallel flow LSA results for a Blasius boundary layer at
 $Re=580$
, subject to a streamwise T–S wave, (
 $\unicode[STIX]{x1D6FC}=0.179$
), compared to Criminale et al. (Reference Criminale, Jackson and Joslin2003) for validation.
The leading eigenvalues (
 $\unicode[STIX]{x1D714}_{j}$
) from bi-global LSA of a 2-D lid-driven cavity subject to different spanwise wavenumbers (
 $\unicode[STIX]{x1D6FD}$
) compared to Ding & Kawahara (Reference Ding and Kawahara1998) for validation.

3.3 GLSA
When performing GLSA, no directions are assumed to be homogeneous, which can be very computationally expensive. Only until recently have computational resources made studying the stability of complex 3-D problems practical. The stability of a 3-D lid-driven cavity has been studied by multiple authors using different numerical techniques.
The stability of a steady cubic 3-D lid-driven cavity is studied at a Reynolds number of
 $1000$
, based on the cavity height and lid velocity. Giannetti et al. (Reference Giannetti, Luchini and Marino2009) and Gómez et al. (Reference Gómez, Gómez and Theofilis2014) have both performed GLSA of a cubic 3-D lid-driven cavity. All three results were obtained using some form of the Arnoldi iteration method. Giannetti et al. (Reference Giannetti, Luchini and Marino2009) solve the LNS (2.3) and utilize the IRAM within the ARPACK library. Conversely, Gómez et al. (Reference Gómez, Gómez and Theofilis2014) directly applies the output from a N–S (2.1) solver to generate approximate results for GLSA using the classic Arnoldi algorithm. The present work solves the LNS, but utilizes the IRAM implemented in the parallel P_ARPACK library. Results show good agreement across the different numerical methods as shown in table 4.
The leading eigenvalues (
 $\unicode[STIX]{x1D714}_{j}$
) from GLSA for a stable 3-D lid-driven cavity at
 $Re=1000$
compared to Giannetti et al. (Reference Giannetti, Luchini and Marino2009) and Gómez et al. (Reference Gómez, Gómez and Theofilis2014) for validation. The number inside of the brackets represents the number of elements in the grid that was used.

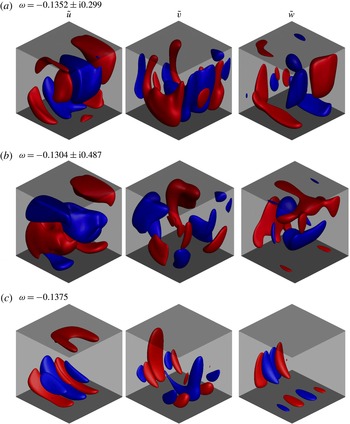
Furthermore, the real part of the leading eigenmodes from the present work are shown in figure 1 and highlight positive and negative isocontours of the perturbation velocity fields. Eigenmode results shown in Gómez et al. (Reference Gómez, Gómez and Theofilis2014) show good qualitative agreement with the present work. The complexity as well as the symmetry of the 3-D cavity can be seen in the eigenmode results. The third eigenmode is a stable stationary mode (i.e. non-oscillatory), and has been described by Gómez et al. (Reference Gómez, Gómez and Theofilis2014) as resembling different families of linear modes with Taylor–Görtler-like structures.
Real part of the eigenmodes from GLSA for a 3-D lid-driven cavity at
 $Re=1000$
. The results are shown with positive and negative isocontours of
 $\tilde{u} ,\tilde{v},\tilde{w}=\pm 0.15$
. The associated eigenvalues are shown, with the real part being the growth rate, and the imaginary part being the frequency. Modes (a–c) show good qualitative agreement with Gómez et al. (Reference Gómez, Gómez and Theofilis2014). A comparison to the eigenvalues results of Giannetti et al. (Reference Giannetti, Luchini and Marino2009) and Gómez et al. (Reference Gómez, Gómez and Theofilis2014) may be found in table 4.

3.4 GLSA and parallel flow LSA
As a final point of validation, results from GLSA are compared to classic parallel flow LSA. The stability of a laminar channel is chosen because the assumption that the streamwise and spanwise directions are homogeneous holds true, making the parallel flow assumption valid.
The stability of a laminar channel at
 $Re=5780$
, based on the centreline velocity and channel half-height
 $h$
, is first computed using GLSA. The channel half-height
 $h$
is
 $1$
, while the streamwise length is
 $4\unicode[STIX]{x03C0}$
and the spanwise width is
 $4\unicode[STIX]{x03C0}/3$
. Periodic boundary conditions are applied in the streamwise and spanwise directions, whereas the no-slip condition is applied at the top and bottom of the channel. Since the streamwise and spanwise wavenumbers (
 $\unicode[STIX]{x1D6FC}$
and
 $\unicode[STIX]{x1D6FD}$
, respectively) are not specified in GLSA, any combination of wavenumbers may be present in the GLSA results. Therefore, the
 $j$
th pair of
 $\unicode[STIX]{x1D714}_{j}$
and
 $\hat{\boldsymbol{u}}_{i}^{j}$
may have a non-zero
 $\unicode[STIX]{x1D6FC}_{j}$
and/or
 $\unicode[STIX]{x1D6FD}_{j}$
that can then be extracted using streamwise and spanwise fast Fourier transforms. The
 $\unicode[STIX]{x1D6FC}_{j}$
and
 $\unicode[STIX]{x1D6FD}_{j}$
can then be used as input into parallel flow LSA.
Two leading eigenvalues (
 $\unicode[STIX]{x1D714}_{j}$
) from GLSA for laminar channel flow at
 $Re=1000$
. Streamwise wavenumbers,
 $\unicode[STIX]{x1D6FC}$
, and spanwise wavenumbers,
 $\unicode[STIX]{x1D6FD}$
, are observed in the global eigenmodes (see figures 2 and 3) and are used as input to parallel flow stability analysis of Poiseuille flow. The parallel flow stability results are produced by a code available in the supplementary material from Juniper et al. (Reference Juniper, Hanifi and Theofilis2014).

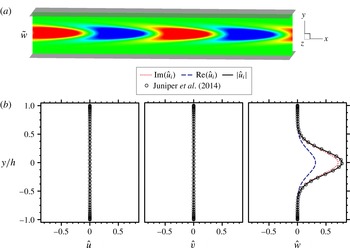
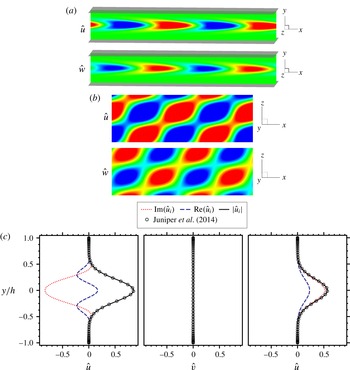
The non-zero components of two leading eigenmodes from GLSA are shown in figures 2(a,b) and 3(a). A quantitative comparison between the GLSA results and the results from parallel flow LSA are shown in figures 2(c) and 3(b). The complex Fourier coefficients,
 $\hat{\boldsymbol{u}}_{i}^{j}$
, as well as their magnitudes, are plotted against the results from parallel flow LSA. The comparison shows good agreement for both eigenmodes in all three velocity components.
The same two leading eigenvalues from GLSA and parallel flow LSA are shown in table 5. The eigenvalues are non-dimensionalized by the centreline velocity and the channel half-height
 $h$
. The agreement between the two different numerical methods, utilizing drastically different numerical techniques and different assumptions, is very strong. Reasonable agreements for growth rates and frequencies are obtained.
Thus, the present unstructured grid LSA solver can be considered validated. This LSA solver will now be used to study the GLSA of the JICF.
Shown are the real parts of the first eigenmode corresponding to the eigenvalues in table 5 from GLSA for laminar channel flow at
 $Re=1000$
. Periodic boundary conditions in
 $x$
and
 $z$
are applied. Here, there is no variation in the
 $z$
-direction, making a single slice sufficient to display all relevant data. The results are shown as an
 $x$
–
 $y$
slice (
 $z=0$
) with contours of
 $\tilde{w}$
(note:
 $\tilde{u} =\tilde{v}=0$
). The streamwise and spanwise wavenumbers (
 $\unicode[STIX]{x1D6FC}=\text{i}1$
,
 $\unicode[STIX]{x1D6FD}=\text{i}0$
) are extracted and used as input to classic parallel flow stability analysis of Poiseuille flow. Additionally, the tri-global eigenmode Fourier coefficients (
 $\hat{\boldsymbol{u}}_{i}$
) are compared with the results from parallel stability of Juniper et al. (Reference Juniper, Hanifi and Theofilis2014) for
 $|\hat{u} |$
,
 $|\hat{v}|$
and
 $|{\hat{w}}|$
. Note that every fourth point from Juniper et al. (Reference Juniper, Hanifi and Theofilis2014) is plotted in an effort to not obscure other data.

Similar to figure 2, shown is the real part of the second eigenmode corresponding to the eigenvalues in table 5 from GLSA for laminar channel flow at
 $Re=1000$
. Periodic boundary conditions in
 $x$
and
 $z$
are applied. Here, there is variation in the
 $z$
-direction, requiring an additional slice to be shown. The results are shown as
 $x$
–
 $y$
(
 $z=0$
) and
 $z$
–
 $x$
(
 $y=0$
) slices with contours of
 $\tilde{u}$
and
 $\tilde{w}$
(note:
 $\tilde{v}=0$
). The streamwise and spanwise wavenumbers (
 $\unicode[STIX]{x1D6FC}=\text{i}1$
and
 $\unicode[STIX]{x1D6FD}=\text{i}1.5$
) may be extracted and used as input to a classic parallel flow stability analysis of Poiseuille flow. Additionally, the tri-global eigenmode Fourier coefficients (
 $\hat{\boldsymbol{u}}_{i}$
) are compared with the results from parallel stability of Juniper et al. (Reference Juniper, Hanifi and Theofilis2014) for
 $|\hat{u} |$
,
 $|\hat{v}|$
and
 $|{\hat{w}}|$
. Note that every fourth point from Juniper et al. (Reference Juniper, Hanifi and Theofilis2014) is plotted in an effort to not obscure other data.

4 Problem description
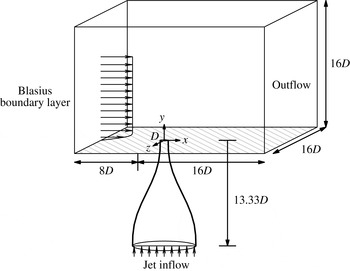
A schematic of the jet in cross-flow computational domain is shown. The origin is located at the centre of the jet exit. A Blasius boundary layer is prescribed as the leftmost inflow condition. Additionally, uniform inflow is prescribed for the jet inflow. The nozzle shape is modelled using a fifth-order polynomial that matches the nozzle used in experiments of Megerian et al. (Reference Megerian, Davitian, Alves and Karagozian2007).

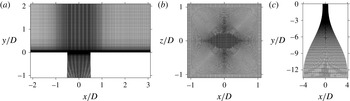
The computational grid is shown. A view of the symmetry plane (a) as well as a wall-normal plane near the jet exit (b) and the nozzle (c) are shown. The grid is composed of
 $80$
million elements.

Isocontours of
 $Q$
-criterion coloured by streamwise velocity for the instantaneous turbulent flow field for
 $R=2$
(a) and
 $R=4$
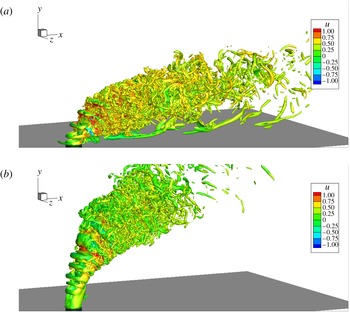
(b). The upstream shear-layer roll up is clear and defined for both case
 $R2$
and
 $R4$
, whereas the downstream shear-layer roll up is less obvious. Additionally, long wake vortices are visible for case
 $R2$
near the wall. Both cases showcase fine-scale turbulent structures far downstream.

Figure 4 shows the simulation set-up. At the inflow, a laminar Blasius boundary layer profile is prescribed. The computational grid and boundary layer profile are the same as those used by Iyer & Mahesh (Reference Iyer and Mahesh2016). The boundary layer has been shown to match well with experiments at
 $x/D=-5.5$
. The jet nozzle is located at the origin of the computational domain and is included in all simulations. It has been shown by Iyer & Mahesh (Reference Iyer and Mahesh2016) that the jet nozzle plays a crucial role in setting up the mean flow near the jet exit, thus affecting the stability characteristics of the flow. A fifth-order polynomial is used to model the nozzle shape used in the experiments of Megerian et al. (Reference Megerian, Davitian, Alves and Karagozian2007). The jet exit diameter
 $D$
is
 $3.81~\text{mm}$
and the average velocity at the jet exit
 $\overline{v}_{jet}$
is
 $8~\text{m}~\text{s}^{-1}$
. Additional simulation details are outlined in table 6. Simulation cases
 $R2$
and
 $R4$
are performed at the same conditions as the experiments of Megerian et al. (Reference Megerian, Davitian, Alves and Karagozian2007).
The unstructured capabilities of the solver allow the cross-flow domain and jet nozzle to be simulated together. Figure 4 also describes the extent of the computational domain. The domain extends
 $8D$
upstream of the jet exit to the inflow boundary where the Blasius laminar boundary layer solution is applied.
 $16D$
downstream of the jet exit is the outflow boundary. In addition, Neumann boundary conditions are applied to the sides located
 $8D$
from the origin in the spanwise directions. The simulated nozzle extends
 $13.33D$
below the jet orifice, at which point a uniform inflow is prescribed to achieve the correct velocity at the jet exit. The top of the domain is located
 $16D$
above the origin and also has a Neumann boundary condition applied.
Details are shown for the simulations used to study the stability of the JICFs. Jet to cross-flow ratios
 $R$
of 2 and 4 are studied at a Reynolds number
 $Re$
of 2000, based on the average velocity
 $\overline{v}_{jet}$
at the jet exit and the jet exit diameter
 $D$
. Also shown is the jet to cross-flow ratio
 $R^{\ast }$
, based on the jet exit peak velocity
 $v_{jet,max}$
and the Reynolds number
 $Re_{cf}$
, based on the cross-flow velocity
 $u_{\infty }$
. The momentum thickness of the laminar cross-flow boundary layer is described at the jet exit when the jet is turned off.

The computational grid is shown in figure 5, and is made up of 80 million elements divided into 4096 partitions. This allows for 80 elements inside of the inflow laminar boundary layer in the
 $y$
-direction and 400 elements around the jet exit. Downstream of the jet exit, the grid maintains a spacing of
 $\unicode[STIX]{x0394}x/D=0.033$
and
 $\unicode[STIX]{x0394}z/D=0.02$
, with a
 $\unicode[STIX]{x0394}y_{min}/D=0.0013$
, which are finer than the spacings used by Muppidi & Mahesh (Reference Muppidi and Mahesh2007) to simulate a turbulent JICF. After making the assumption that downstream of the jet exit the boundary layer is turbulent, viscous wall units may be computed using
 $c_{f}=0.0576Re_{x}^{-0.2}$
(Schlichting & Gersten Reference Schlichting and Gersten1979). Wall spacings may then be calculated at the outflow as
 $\unicode[STIX]{x0394}x^{+}/D$
,
 $\unicode[STIX]{x0394}y_{min}^{+}/D$
and
 $\unicode[STIX]{x0394}z^{+}/D$
, as
 $2.74$
,
 $0.1$
, and
 $1.66$
when
 $R=2$
and
 $1.48$
,
 $0.058$
and
 $0.89$
when
 $R=4$
, respectively.
Instantaneous isocontours of
 $Q$
-criterion (Hunt, Wray & Moin Reference Hunt, Wray and Moin1988) coloured by streamwise velocity for the turbulent flow field are shown in figure 6 for case
 $R2$
(a) and
 $R4$
(b).
 $Q$
is defined as
 $$\begin{eqnarray}\displaystyle Q=-0.5\frac{\unicode[STIX]{x2202}u_{i}}{\unicode[STIX]{x2202}x_{j}}\frac{\unicode[STIX]{x2202}u_{j}}{\unicode[STIX]{x2202}x_{i}}. & & \displaystyle\end{eqnarray}$$
The
 $Q$
-criterion highlights vortex cores by representing regions where pressure is a local minimum. The complexity of the turbulent JICF is shown in these instantaneous results. Important features include the coherent upstream shear-layer roll up, as well as long string-like wake vortices near the wall. Additionally, a less visible downstream shear-layer roll up is visible that interacts with the upstream shear layer at the collapse of the potential core. Many fine-scale turbulent structures are also visible downstream in the jet wake. In the section that follows, GLSA results are discussed that provide valuable insight to the stability of these two flow configurations.
5 Results
GLSA is performed for the
 $R2$
and
 $R4$
cases described in table 6. These cases match the experimental and computational set-ups of Megerian et al. (Reference Megerian, Davitian, Alves and Karagozian2007) and Iyer & Mahesh (Reference Iyer and Mahesh2016), respectively. Choosing an appropriate base flow is important for LSA. The scale-separation argument from § 2.2 provides the following results:
 $$\begin{eqnarray}\left.\begin{array}{@{}c@{}}\displaystyle L/\unicode[STIX]{x1D702}=Re^{3/4}\approx 300,\\ \displaystyle t_{L}/t_{\unicode[STIX]{x1D702}}=Re^{1/2}\approx 45.\end{array}\right\}\end{eqnarray}$$
This shows that
 $1$
or more orders of magnitude separate the time and length scales of turbulent motions and the motions of interest. SFD has been shown by Bagheri et al. (Reference Bagheri, Schlatter, Schmid and Henningson2009) to alter some important features of the JICF; specifically the collapse of the potential core and the near-wall reverse flow downstream of the jet exit. Therefore, turbulent mean flow solutions are used as the base states in GLSA for the present work.
Turbulent mean flow solutions were generated by Iyer & Mahesh (Reference Iyer and Mahesh2016) using
 $32\,000$
and
 $39\,000$
samples from DNS to temporally average cases
 $R2$
and
 $R4$
, respectively. Iyer & Mahesh (Reference Iyer and Mahesh2016) have shown that there is good agreement between the temporally averaged solutions from simulation and experiment.
Results from the grid convergence study used to determine the sensitivity of the leading eigenvalue to the mesh for case
 $R2$
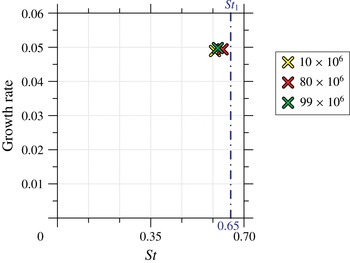
. Three different grids were tested: coarse (10 million elements), present work (80 million elements), fine (99 million elements). The eigenvalues have been non-dimensionalized so that the growth rate is
 $\text{Re}(\unicode[STIX]{x1D714})D/(2\unicode[STIX]{x03C0}v_{jet,max})$
and the Strouhal number is
 $\text{Im}(\unicode[STIX]{x1D714})D/(2\unicode[STIX]{x03C0}v_{jet,max})$
.
 $St_{1}$
highlights the primary Strouhal number observed along the upstream shear layer in simulations by Iyer & Mahesh (Reference Iyer and Mahesh2016).

A grid convergence study was performed to study the sensitivity of the leading eigenvalue for three different grids when
 $R=2$
. The upstream shear-layer eigenvalue was computed for a coarse grid (10 million elements), the present work grid (80 million elements) and a finer grid (99 million elements). All three eigenvalues are shown in figure 7 and show good agreement. Peplinski et al. (Reference Peplinski, Schlatter and Henningson2015) have shown that the leading eigenvalue can also be sensitive to the size of the computational domain. Iyer & Mahesh (Reference Iyer and Mahesh2016) have shown that the domain size in their DNS successfully captures both the upstream boundary layer and upstream shear-layer frequencies when compared to experiment. We use the same domain length as Iyer & Mahesh (Reference Iyer and Mahesh2016).
For case
 $R2$
, the
 $15$
leading eigenvalues were computed to a maximum residual of
 $1\times 10^{-14}$
. In addition,
 $60$
Arnoldi vectors were generated for each iteration in the IRAM. The LNS (2.3) were integrated
 $0.114$
time units (non-dimensionalized by
 $D/v_{jet,max}$
) to generate each Arnoldi vector. This allowed for a more than adequate temporal resolution to solve for the highest frequency in the upstream shear layer, which were observed in DNS at a
 $St=0.65$
(i.e. period of
 $1.54$
time units). After generating the
 $60$
Arnoldi vectors, they spanned
 $6.85$
time units, allowing for the IRAM to efficiently resolve the lower-frequency wake modes as well.
Similarly for case
 $R4$
, the
 $16$
leading eigenvalues were computed to the same maximum residual of
 $1\times 10^{-14}$
. In addition,
 $100$
Arnoldi vectors were generated for each iteration in the IRAM. Time was integrated
 $0.157$
time units (non-dimensionalized by
 $D/v_{jet,max}$
) to generate each Arnoldi vector. This allowed for a temporal resolution that could sufficiently capture the high-frequency upstream shear-layer modes, which were observed in DNS at
 $St=0.39$
and
 $St=0.78$
(i.e. periods of
 $2.56$
and
 $1.28$
time units, respectively). Once the
 $60$
Arnoldi vectors were generated, they spanned
 $15.7$
time units, allowing for the IRAM to efficiently resolve lower-frequency modes.
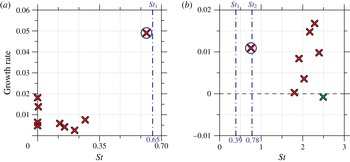
GLSA eigenvalue spectrum for the JICF at
 $Re=2000$
for
 $R=2$
(a) and
 $R=4$
(b). The eigenvalues have been non-dimensionalized so that the growth rate is
 $\text{Re}(\unicode[STIX]{x1D714})D/(2\unicode[STIX]{x03C0}v_{jet,max})$
and the Strouhal number is
 $\text{Im}(\unicode[STIX]{x1D714})D/(2\unicode[STIX]{x03C0}v_{jet,max})$
. The vertical blue dashed lines correspond to most dominant frequencies from DNS vertical velocity spectra results taken from the upstream shear layer by Iyer & Mahesh (Reference Iyer and Mahesh2016). The DNS frequency of
 $St_{2}=1.3$
from Iyer & Mahesh (Reference Iyer and Mahesh2016) is not shown in (a) as it would obscure the lower-frequency GLSA results. Eigenvalues (
 $\unicode[STIX]{x1D714}_{j}$
) with red symbols are unstable modes (i.e. positive growth rate), while stable values are coloured green. The circled eigenvalues have their corresponding eigenmodes shown in figure 9 for
 $R=2$
(a) and
 $R=4$
(b).

Figure 8 shows the eigenvalue spectra obtained from GLSA for case
 $R2$
(a) and
 $R4$
(b). The eigenvalues have been non-dimensionalized so that the growth rate is
 $\text{Re}(\unicode[STIX]{x1D714})D/(2\unicode[STIX]{x03C0}v_{jet,max})$
and the Strouhal number is
 $\text{Im}(\unicode[STIX]{x1D714})D/(2\unicode[STIX]{x03C0}v_{jet,max})$
. As discussed in § 2.2, Barkley (Reference Barkley2006) and Turton et al. (Reference Turton, Tuckerman and Barkley2015) showed that when performing GLSA around a turbulent mean flow, the resulting eigenvalues have very small growth rates; which is consistent with the results in figure 8. The circled eigenvalues have Strouhal numbers closest to those found in experiments (Megerian et al.
Reference Megerian, Davitian, Alves and Karagozian2007) and simulations (Iyer & Mahesh Reference Iyer and Mahesh2016) (i.e.
 $St_{1}$
(
 $R2$
),
 $St_{2}$
(
 $R4$
)) when analysing vertical velocity spectra from the upstream shear layer. The eigenvalues from GLSA have Strouhal numbers associated with the upstream shear layer of
 $0.62$
for
 $R2$
and
 $0.75$
for
 $R4$
. Comparatively, vertical velocity spectra show that Strouhal numbers of
 $0.65$
for
 $R2$
and
 $0.78$
for
 $R4$
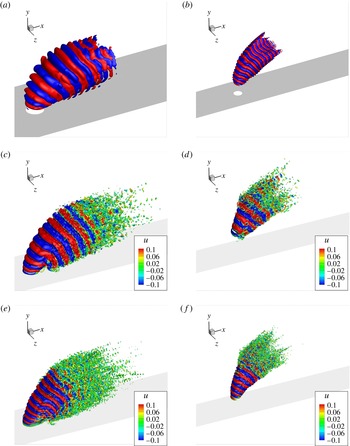
dominate the upstream shear layer. Figure 9 gives an isometric view of the two eigenmodes for
 $R2$
(a) and
 $R4$
(b), that are associated with the circled eigenvalues in figure 8. Dynamic mode decomposition (DMD) modes from Iyer & Mahesh (Reference Iyer and Mahesh2016) are also shown in figure 9 for
 $R2$
(c,e) and
 $R4$
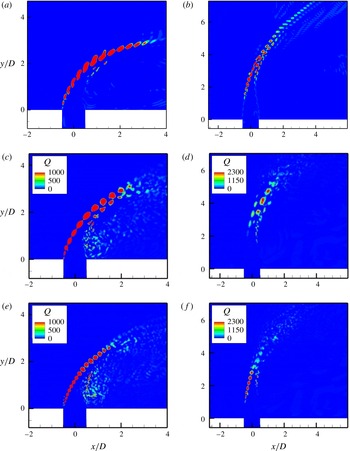
(d,f). Additionally, figure 10 shows cross-sectional views of the upstream shear-layer eigenmodes and DMD modes at the symmetry plane (
 $z=0$
). The DMD results from Iyer & Mahesh (Reference Iyer and Mahesh2016) have Strouhal numbers of
 $0.65$
and
 $1.3$
for
 $R2$
and
 $0.39$
and
 $0.78$
for
 $R4$
, that match the frequencies from vertical velocity spectra. For case
 $R4$
, it is not as clear how the eigenmode and DMD modes compare from figure 9(b,d,f) alone. However, the cross-sectional views in figure 10 show that the eigenmode at
 $St=0.75$
(figure 10
b) agrees well qualitatively with the DMD mode at
 $St=0.78$
(figure 10
f).
Real part of the eigenmodes for case
 $R2$
at
 $St=0.62$
(a) and
 $R4$
at
 $St=0.75$
(b) are shown with positive and negative isocontours of
 $\tilde{u}$
and
 $\overline{v}$
. Isocontours of
 $Q$
-criterion for the DMD modes by Iyer & Mahesh (Reference Iyer and Mahesh2016) are shown for
 $R2$
at
 $St=0.65$
(c) and
 $St=1.3$
(e) and for
 $R4$
at
 $St=0.39$
(d) and
 $St=0.78$
(f).

GLSA for case
 $R2$
predicts an eigenmode at
 $St=0.62$
originating near the jet exit and propagating along the upstream shear-layer. DMD and vertical velocity spectra capture
 $St=0.65$
and a higher harmonic at
 $St=1.3$
along the upstream shear layer. It is clear from the isometric views in figure 9 that the upstream shear-layer eigenmode at
 $St=0.62$
(figure 9
a) and DMD mode at
 $St=0.65$
(figure 9
c) for case
 $R2$
agree well qualitatively. Additionally, figure 10 shows good agreement for the cross-section between the eigenmodes and DMD modes when
 $R=2$
. As expected, GLSA does not predict the nonlinear higher harmonic at
 $St=1.3\approx 0.65\times 2$
.
Slices of eigenmodes and DMD modes (from Iyer & Mahesh (Reference Iyer and Mahesh2016)) at the symmetry plane (
 $z=0$
) with contours of
 $Q$
-criterion. The eigenmodes have frequencies of
 $St=0.62$
(a) and
 $St=0.75$
(b) for
 $R=2$
and
 $R=4$
, respectively. The DMD modes have frequencies for case
 $R2$
at
 $St=0.65$
(c) and
 $St=1.3$
(e) and case
 $R4$
at
 $St=0.39$
(d) and
 $St=0.78$
(f).

For the
 $R4$
case, GLSA predicts an eigenmode at
 $St=0.75$
along the upstream shear layer, while DMD and vertical velocity spectra show
 $St=0.39$
and an harmonic at
 $St=0.78$
. Iyer & Mahesh (Reference Iyer and Mahesh2016) have shown
 $St=0.78$
to include about 43 % of the spectral energy when compared to the most dominant DMD mode (
 $St=0.39$
). However, note that the DMD mode at
 $St=0.78$
presents itself much closer to the nozzle and is clearly a shear-layer mode.
 $St=0.39$
, on the other hand, has its largest magnitude further downstream and is located between the upstream and downstream shear layers. This can be observed in the cross-sectional view as a part of figure10(d).
Rowley et al. (Reference Rowley, Mezić, Bagheri, Schlatter and Henningson2009) compared the JICF GLSA results of Bagheri et al. (Reference Bagheri, Schlatter, Schmid and Henningson2009) with DNS and DMD. They showed that GLSA recovers an upstream shear-layer instability mode with a different frequency than what is captured by DNS and DMD. Note that Bagheri et al. (Reference Bagheri, Schlatter, Schmid and Henningson2009) computed a steady-state base flow using SFD. Additionally, the jet nozzle was not included in the simulation and top-hat jet exit profile was prescribed. Interestingly, the present work has shown that using the turbulent mean flow as the base state in GLSA, the captured upstream shear-layer instability mode has the same frequency as the DNS and DMD results of Iyer & Mahesh (Reference Iyer and Mahesh2016).
5.1 Stability analysis of
 $R2$

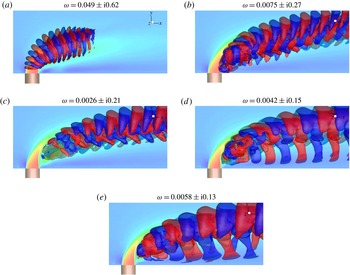
Figure 11 shows the eigenmodes that are associated with the eigenvalues in figure 8(a) for case
 $R2$
. To better characterize the eigenmodes, they can be grouped according to their frequencies and spatial structures. For this case, we notice that there are three main groups.
Real part of the eigenmodes for case
 $R2$
are shown with positive and negative isocontours of
 $\tilde{u}$
and
 $\overline{v}$
contours of the base state in the background. The eigenvalues are shown above, with the real part being the growth rate, and the imaginary part being the Strouhal number. Mode (a) corresponds to the most unstable and highest-frequency upstream shear-layer mode. Modes (b–e) are lower frequency and originate near the downstream shear layer and travel far downstream. Modes (d) and (e) also show a connection between near-wall motions and motions in the jet wake.

The first group consists of the shear-layer mode seen in figure 11(a). This eigenmode oscillates at a frequency very close to what is observed in DNS and experiments. Additionally, it originates near the jet exit at the initiation of the upstream shear layer. Furthermore, this eigenmode extends downstream after the collapse of the potential core while still maintaining a large magnitude. This implies that the eigenmode is growing as it travels downstream but also growing at the jet exit; characteristic of an absolute instability.
Next is the group that occupies a range of lower frequencies that may be identified as the wake modes. This group consists of figure 11(b–e). Low frequencies have been shown by Iyer & Mahesh (Reference Iyer and Mahesh2016) to include a significant portion of the spectral energy, highlighting their importance and relevance in the overall flow physics for this configuration. The four wake modes are qualitatively similar, but exhibit different spatial length scales. Additionally, the lower-frequency wake modes highlight the connection between the near wall motions and motions deep in the jet wake. The wake modes originate behind the downstream shear layer after the collapse of the potential core and dominate far downstream. Figure 11(b,c) shows the eigenmodes that persist downstream, but remain in the jet wake. Specifically, the eigenmodes observed in figure 11(d,e) act at the lowest of frequencies for this configuration. The observed frequencies are consistent with notion that Strouhal numbers associated with the jet diameter (
 $D$
) will be lower than those associated with the shear layer.
Finally, the Reynolds stresses present in the turbulent mean flow show up in GLSA as stationary eigenmodes. This is because the Reynolds stress becomes a steady forcing term in the LNS equations once the base flow equations are subtracted (2.3). The stationary eigenmodes are not relevant to the present analysis and are not included.
5.2 Stability analysis of
$R4$

All of the eigenmodes for case
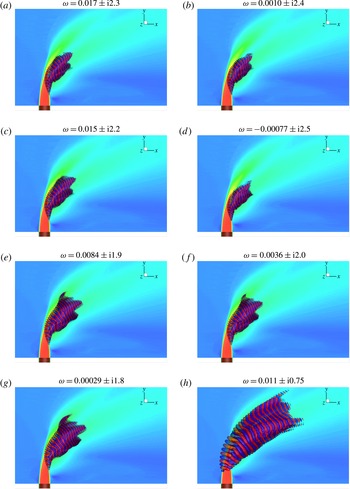
 $R4$
are shown in figure 12 and are associated with the eigenvalues in figure 8(b). Again, it is convenient to group the eigenmodes. We observe from the spectrum in figure 8(b) and the eigenmodes from figure 12 that there are two main groups.
The high-frequency eigenmodes make up the first group. These eigenmodes are all located along the downstream shear layer. Not much attention has been given to the stability of the downstream shear layer. However, the present work shows that two of the downstream shear-layer modes have higher growth rates than the upstream shear layer, and therefore must not be ignored when considering the stability at
 $R=4$
. Note that the downstream shear-layer modes occupy a range of frequencies. All of these modes interact with the upstream shear layer at the collapse of the potential core. This may explain why different frequencies are present along the shear layer as seen from upstream shear-layer vertical velocity spectra for
 $R=4$
.
Case
 $R4$
has been shown to change its dominant frequencies along the upstream shear layer; conversely to case
 $R2$
. When
 $R=4$
, the upstream shear-layer eigenmode at
 $St=0.75$
originates much further away from the jet when compared to the upstream shear-layer mode of case
 $R2$
. This is consistent with a convective instability where the flow instability travels downstream, but does not grow at the point of origin (i.e. near the jet exit).
Real part of the eigenmodes for case
 $R4$
are shown with positive and negative isocontours of
 $\tilde{u}$
and
 $\overline{v}$
contours of the base state in the background to highlight the jet base flow. The associated eigenvalues are shown above, with the real part being the growth rate and the imaginary part being the Strouhal number. Modes (a–g) correspond to the higher-frequency downstream shear-layer modes. Mode (h) is associated with the upstream shear layer.

6 Summary
A GLSA capability has been developed for studying complex flows with unstructured grids to further study the low-speed JICF. The use of turbulent mean flows for GLSA is justified using a scale-separation argument. GLSA has been shown to successfully capture the upstream shear-layer instabilities at the same Strouhal numbers as those found using DNS and DMD analysis of Iyer & Mahesh (Reference Iyer and Mahesh2016) for both cases
 $R2$
and
 $R4$
. GLSA has also provided supportive evidence for the upstream shear-layer’s transition from absolutely to convectively unstable as
 $R$
increases from
 $2$
to
 $4$
. The present work has shown that the downstream shear layer plays an important role in the stability of JICFs at higher
 $R$
values.
When analysing the entire GLSA spectrum for case
 $R2$
, as shown in figure 8(a), note the eigenvalue with the highest growth rate, which has a frequency of
 $St=0.62$
. The associated dominant eigenmode observed in figure 9(a) is located along the upstream shear layer. This sheds light on the most dominant instability for this flow. Leveraging this knowledge by either attempting to dampen or amplify the upstream shear-layer mode near the jet exit has often been an effective control strategy in other applications. However, note that further downstream, this mode has a dramatic reduction in amplitude, which suggests this mode is only dominant 4–5
 $D$
downstream of the jet orifice. The rest of the GLSA spectrum for
 $R=2$
has growth rates less than
 $30\,\%$
of the growth rate for the upstream shear-layer mode, which may convey less relevance to the overall stability. However, after examining the spatial structure of these lower-frequency modes reveals that they continue to have a large impact far downstream. This could be important when attempting to control the JICF. For example, if mixing downstream is important, damping or amplifying these unstable wake modes may be more effective than trying to control the upstream shear-layer instability. Note that the origin of the wake modes appears to be slightly above the jet orifice, which makes it unclear how effective actuation in the nozzle or near the jet orifice may be.
For case
 $R4$
, again note that GLSA has been shown to capture the relevant flow physics in § 5. Unlike the
 $R2$
case, the GLSA spectrum for case
 $R4$
in figure 8(b) shows that the most unstable eigenvalue is not associated with the upstream shear layer. Instead, the most unstable eigenvalue sits on the downstream shear layer, and is accompanied by a range of other eigenvalues also located along the downstream shear layer. These downstream shear-layer eigenvalues have a range of Strouhal numbers from approximately 1.7–2.5. Not much attention has been given to the downstream shear layer in the past, but for higher
 $R$
values it should not be ignored.
Acknowledgements
This work was supported by AFOSR grant FA9550-15-1-0261. Simulations were performed using computer time provided by the Texas Advanced Computing Center (TACC) through the Extreme Science and Engineering Discovery Environment (XSEDE) allocation, and the Minnesota Supercomputing Institute (MSI). We thank Dr P. S. Iyer for discussions and performing preliminary simulations.