1. Introduction
Building trade capacity is a purpose of many international and national agencies. The World Trade Organization provides special support programs for developing countries to better integrate into the multilateral trading system. However, many developing and developed economies prefer to establish their facilitative agencies to provide firms with information, technical advice, marketing services, and policy advocacy about access to foreign markets.
The general idea is that there are opportunities for gains from trade, yet not all firms have the same ability to sell their goods and services abroad. Exporting activity entails beachhead costs when handling different regulatory environments, meeting different consumer tastes, and establishing marketing and logistics channels. Only the more productive firms may be able to self-select into exporting status. In contrast, other companies may not have the necessary skills or resources to enter foreign markets.Footnote 1 Hence, the necessity to resort to trade promotion programs to fill the gap and help firms build trade capacity to take advantage of open markets. Eventually, openness to trade is a determinant of economic growth insofar as it allows exploiting differential comparative advantages and economies of scale. Companies can benefit while tapping into foreign technology and raising aggregate productivity in the home countries.Footnote 2
Against the previous background, our simple intuition is to adopt machine learning techniques to evaluate how far a company is from reaching an export status based on the assumption that firms’ accounts convey non-trivial information on firm-level trade capacity. In other words, we propose to train an algorithm on in-sample financial statements to predict out-of-sample firms’ ability to start exporting. Our intuition follows what financial institutions make to predict credit risk, for example, in the case of traditional Altman's Z-scores (Altman, Reference Altman1968) or Merton's Distance-to-Default (Merton, Reference Merton1974). Unlike credit risk literature, our problem is not to check if a company is close to bankruptcy. On the contrary, our challenge is to measure how far a company is from being healthy enough to enter foreign markets.
We begin by introducing different machine learning techniques in a sample of 57,016 manufacturing firms in France, which may or may not have exported in 2010–2018. Following statistical standards, we randomly separate the initial sample into 80–20% proportions, splitting it into a training and a testing set. Then, we train different models armed with a battery of 52 predictors that we believe may contain non-trivial information on exporting abilities. Finally, we use the trained models to obtain distributions of out-of-sample predictions that can be used to assess a company's distance from exporting capability. We call such a distance ‘exporting score’. In simple terms, it summarizes how much a non-exporter looks like an exporter. Crucially, we find that our procedure correctly separated exporters from non-exporters with an accuracy of up to 90%. The foregoing is a figure we obtained from a horse race among different algorithms. We find that a Bayesian Additive Regression Tree with Missingness in Random (BART-MIA) (Kapelner and Bleich, Reference Kapelner and Bleich2015) is the procedure that provides the most robust predictions. The BART-MIA is a regression tree with a Bayesian component for regularization through a prior specification that allows flexibility in fitting various regression models while avoiding strong parametric assumptions (Hill et al., Reference Hill, Linero and Murray2020). What makes BART-MIA especially useful for our case is the possibility of exploiting additional predictive power from non-random missing values on predictors. The latter is a feature that is especially useful in catching business dynamics when coverage of financial accounts is likely to be correlated with other dimensions, e.g., firm size or productivity, which, in turn, can correlate with firm export status. In our case, we assess that considering non-random missing values helps us increase prediction accuracy by about 14.4%. Eventually, we ensure that prediction accuracies are robust to different definitions of exporters and to the presence of discontinuous exporting activity (Békés and Muraközy, Reference Békés and Muraközy2012; Geishecker et al., Reference Geishecker, Schröder and Sörensen2019). The last check is especially relevant in the case of smaller exporters, or when exporters specialize in manufacturing capital goods, whose relationships with customers entail several breaks in the time series.
Our framework is also robust to different cross-validation strategies since we obtain similar performance by randomly picking training and testing subsets in different ways, albeit from a unique sample. Finally, we test that reducing the set of predictors brings lower levels of accuracy after we perform a Least Absolute Shrinkage and Selection Operator (LASSO) for dimensionality reduction (Belloni et al., Reference Belloni and Chernozhukov2013; Belloni et al., Reference Belloni, Chernozhukov and Hansen2014; Belloni et al., Reference Belloni, Chernozhukov, Hansen and Kozbur2016; Ahrens et al., Reference Ahrens, Hansen and Schaffer2020).
After assessing which tool is better at predicting exporters, we delve into the prediction power of single predictors, i.e., how much they contribute to getting good predictions. The practical utility of this exercise is to show that there may be, indeed, some dimensions of the firms’ economic activity that correlate relatively more with their trade potential. Thus, following Chipman et al. (Reference Chipman, George and McCulloch2010), we implement a procedure to derive Variable Inclusion Proportions (VIPs), which can be interpreted as posterior probabilities (Bleich et al., Reference Bleich, Kapelner, George and Jensen2014). Crucially, we discuss how VIPs have a relevant internal validity since they catch predictive power within the given testing vs training sets. Yet, we may not attribute them any external validity because predictors can change their power in different contexts. Indeed, we discuss how such changes in different contexts and sub-populations could actually be informative of the changing resilience of firms and from where it comes. For example, in the French case we study, the difference we observe in the model's selection of influential predictors between Île-de-France and the rest of France suggests there are geographic-specific firms’ dynamics. The same predictors may or may not play a major role in the probability of exporting, depending on the specific technological characteristics of the production environment.
The final sections discuss how we see exporting scores applied in practice. We suggest looking at baseline predictions to derive a probabilistic exporting score to a firm, i.e., a score summarizing how similar a non-exporter is to benchmark exporters on a scale from 0 to 1. We argue that exporting scores could be helpful for trade promotion or trade finance programs. After aggregation, we show how they can represent an additional tool to describe the trade competitiveness of regions or industries.
Finally, to briefly illustrate the practical utility of exporting scores, we classify firms into risk categories and provide simple back-of-the-envelope estimates of how much cash resources and capital expenses they would need to reach export status. We find that increasing cash and capital is required to reduce the distance from export status. For example, in the case of medium-risk firms, i.e., firms that have just below 50% probability of exporting, we show a need for up to 44% more cash resources and up to 246% more capital expenses to reach full export status.
The remainder of the paper is organized as follows. We relate to previous literature in Section 2. We introduce data and sample coverage in Section 3, whereas Section 4 discusses the empirical strategy. Results are commented on in Section 5, while robustness checks are discussed in Section 6. A specific Section 7 tests for the sensitivity of predictions to the phenomenon of temporary trade, while a practical use of exporting scores is presented in Section 10. Section 11 concludes.
2. Related literature
Most countries worldwide implement trade promotion programs that envisage the expenditure of substantial amounts of public funds. Thus, it is hardly surprising that there have been concerns about the efficacy and effectiveness of those support programs. Interestingly, Volpe Martincus and Carballo (Reference Volpe Martincus and Carballo2008) show how export promotion actions are usefully associated with increased exports by already trading firms and traded products, i.e., the intensive margin. In terms of extensive margins, i.e., the increase of firms and products crossing national borders, Volpe Martincus et al. (2010) show that an influential role is often played by the establishment of diplomatic representations, especially in the case of producers of homogeneous goods. In general, activating new trading relationships may require various services bundled into more complex export promotion programs (Volpe Martincus and Carballo, Reference Volpe Martincus and Carballo2010b). Eventually, a majority of studies investigate how effective a policy is on the ex-post companies’ exporting performances while controlling for cherry-picking Volpe Martincus and Carballo (Reference Volpe Martincus and Carballo2010a). In general, Van Biesebroeck et al. (2016) demonstrate how trade promotion programs have been a vital tool to overcome economic crises, such as recovery after the global recession in 2008–2009.
In this context, our contribution focuses explicitly on the possibility of increasing the trade extensive margin, proposing a measure of the ability of non-exporters to start exporting. From this perspective, what we propose is a pure prediction exercise based on the intuition that exporters are statistically different from non-exporters. In this sense, we rely on a two-decades-long strand of research that has established a connection between firms’ heterogeneity and trading status (Bernard and Jensen, Reference Bernard and Jensen1999; Melitz, Reference Melitz2003; Melitz and Ottaviano, Reference Melitz and Ottaviano2008; Bernard et al., 2012; Melitz and Redding, Reference Melitz, Redding, Gopinath, Helpman and Rogoff2014; Lin, Reference Lin2015; Hottman et al., Reference Hottman, Redding and Weinstein2016). Our intuition is that a prediction of export status is possible only because we know that exporters have different cost structures than non-exporters. After all, they have to sustain the fixed costs to gain access to foreign markets, where regulations and consumer tastes can differ much from home (Aw et al., Reference Aw, Lee and Vandenbussche2023), and where shipping is costly. Thus, we demonstrate that starting from a comprehensive battery of economic and financial predictors does indeed allow separating exporters from non-exporters with a relatively high prediction accuracy, up to 90%.
Please note that ours is not a classic policy evaluation exercise or a structural model to understand the determinants of export status. We do not want to assess whether any specific policy design works to support would-be exporters. Ours is a simple scoring exercise in the fashion of what one can find in previous literature about credit scoring. There is a long tradition to try and spot firms in financial distress based on the disclosure of financial accounts. See seminal attempts with Z-scores by Altman (Reference Altman1968) and Altman (Reference Altman2000), and Distance-to-Default by Merton (Reference Merton1974), where some specific threshold is set as a rule of thumb to say whether a firm is financially sound and worthy of credit. Nowadays, most financial institutions adopt predictive models to evaluate credit risk, including machine learning (Uddin, Reference Uddin2021). A statistical learning exercise to spot financially distressed firms, i.e., so-called zombie firms, is reported in Bargagli-Stoffi et al. (2020). See also the exercises on firm-level correlations to spot investment-to-cash-flow sensitivities and assess time-varying financial constraints (Fazzari et al., Reference Fazzari, Hubbard and Petersen1988; Almeida et al., Reference Almeida, Campello and Weisbach2004; Chen and Chen, Reference Chen and Chen2012).
The additional difficulty in our exercise is that we want to score success, i.e., the ability of a firm to outreach across national borders. In contrast, credit risk analyses take as reference previous firms’ failures, i.e., their distance-to-default. Yet, we argue, the intuition is the same: to set a benchmark where firms realize an outcome, in our case, an export status, and thus to measure how far we are from that outcome. Eventually, we could also relate to literature on trade finance. We know very well that routine access to trade credit is needed to outlive foreign markets, and well-functioning financial markets are crucial to export performance (Manova, Reference Manova2012; Lin, Reference Lin2017). Eventually, external finance helps firms gain and keep access to foreign markets despite the high beach-head costs, especially for smaller producers who have a reduced ability to provide collateral to financial institutions (Chor and Manova, Reference Chor and Manova2012). In this context, we believe exporting scores are potentially valuable to better target financial institutions’ credit policies in a familiar way, e.g., by considering credit risk classes. To better grasp our previous intuitions, we propose a simple back-of-the-envelope exercise that estimates, ceteris-paribus, how much cash resources and capital expenses firms need to switch across low, medium, and high-risk classes.
Moreover, from a macroeconomic viewpoint, one can use firms’ scoring as yet another indicator of the competitiveness of an economy (or lack thereof). Inspired by so-called growth diagnostics, international and national statistics offices have developed frameworks for assessing the potential of countries, regions, and industries to compete in international markets. See, for example, works on measuring trade competitiveness (Reis et al., Reference Reis, Wagle and Farole2010; Gaulier et al., Reference Gaulier, Santoni, Taglioni and Zignago2013). In the case of French manufacturing, we show how potential exporters are unevenly distributed across industries and regions. We believe there is no reason why an indicator such as ours about the potential of extensive margins should not find room in a standard trade diagnostic kit.
Finally, we want to remark on how ours is one of the first attempts to exploit statistical learning techniques in international economics. As far as we know, only a few notable efforts are in progress (see Gopinath et al., 2020 and Breinlich et al., Reference Breinlich, Corradi, Rocha, Ruta, Santos Silva and Zylkin2021). Yet, we believe that statistical learning exercises have great potential and should find their way in a field such as international economics, where one often needs to extract valuable information from big and complex datasets, which can be dealt with by a combination of both predictive tasks and standard causal inference exercises (Mullainathan and Spiess, Reference Mullainathan and Spiess2017; Athey, Reference Athey2018).
3. Data
We source firm-level information from ORBISFootnote 3 compiled by the Bureau Van Dijk. Notably, France is a much-explored case study of firm-level trade data, allowing us to confront previous literature (see among others Crozet et al., 2011 and Fontagné et al., 2018). Our main outcome of interest is the export status of a firm that we derive from information on export revenues.Footnote 4 Prima facie, we will consider a firm as an exporter if it reports positive export revenues. In Sections 6 and 7, we will challenge our baseline definition to comply with the phenomenon of temporary trade (Békés and Muraközy, Reference Békés and Muraközy2012) when it is optimal for firms to export every once in a while. As for firm-level predictors of exporting status, we employ a battery of 52 indicators elaborated on original financial accounts that we use to train our models. Details on our choice are discussed in Section 4.2.
To grasp the coverage of our sample, we compare our sample industry and geographic figures with the one provided by Eurostat census in 2018. We do find that relevant exporters are in every NUTS-2 region, as from our sample. Moreover, we have fair coverage by 2-digit industries since the correlation by industry shares is about 0.90. Yet, according to Eurostat business demographics, our sample covers 32.6% of firms’ population which represents about 75% of total operating revenues in France. As largely expected, we cannot retrieve the financial accounts of smaller firms because they are not required to comply with accounting regulations in the same way as medium and larger ones. In the following paragraphs, we will show how our baseline analysis can handle non-random missing values in financial information.
4. The empirical strategy
Our main intuition is that we can predict out-of-sample exporting capability based on the in-sample experience of both exporters and non-exporters. The first step is to find the best algorithm that is able to separate exporters and non-exporters after conditioning on financial information. Our prior is that exporters and non-exporters are statistically different, as acknowledged by previous literature reported in Section 2. Thus, once we assess the method that assures the best predictive accuracy with the minimum numbers of false positives and false negatives (see Section 5.1), we can test out-of-sample and use the distribution of predictions to assign each firm an exporting score that is bounded, by construction, in an interval from 0 to 1. The higher the score, the better the chances a firm is able to make it on foreign markets.
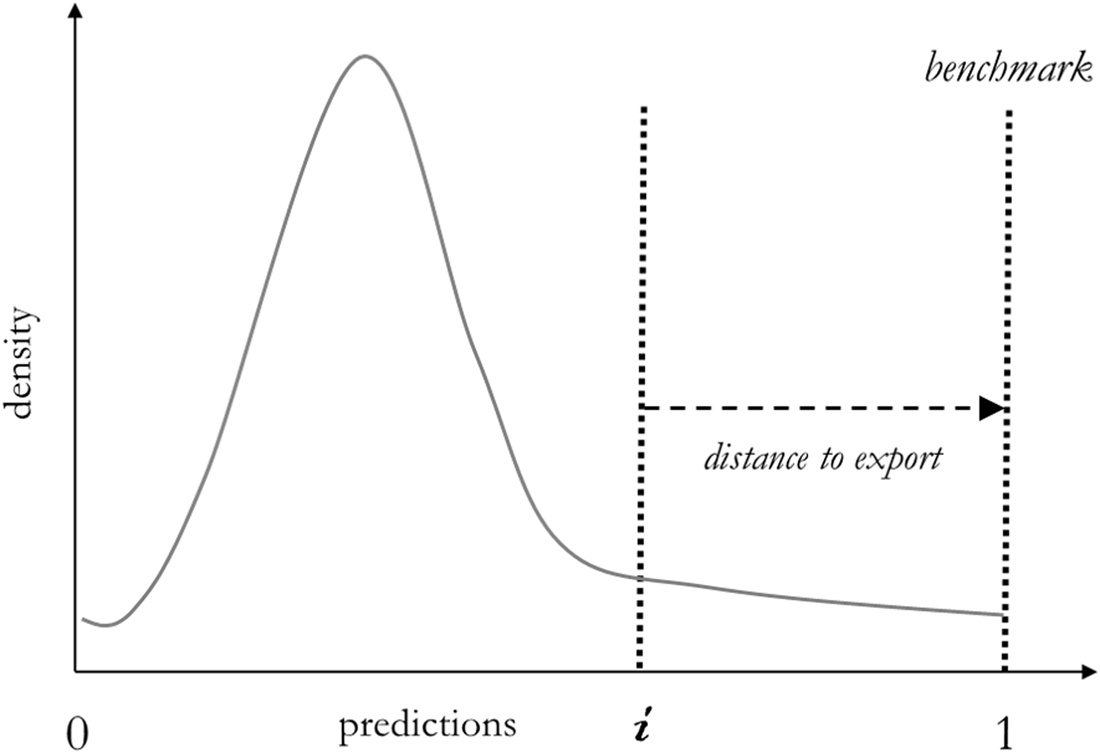
In Figure 1, we report a visual fictional representation of our intuition. Assuming that we did a good job in training and that prediction accuracy is acceptable, we can reasonably test on new firms and locate actual exporters at the end of the right tail of the distribution of exporting predictions. Thus, any ith non-exporting firm located on the left of predicted exporters will come with a positive distance, which will convey non-trivial information on how viable that firm is to start exporting. In other words, we take as a reference point the export status at 1 and, thus, we check how far a company is from that reference point.
Visual intuition of an exporting score
Note: We represent a fictional distribution of predictions of exporting status by definition bounded in an interval [0, 1]. Along the distribution, we could spot an ith non-exporting firm. We reasonably assume that actual exporters locate at the end of the right tail. By definition, non-exporters are less likely to start exporting at an increasing distance from predicted exporters.

In Section 8, we will provide a framework for the interpretability of predictors by catching the influence of each of them in getting the exporting scores. That is, we are able to sum up how important one predictor is with respect to the entire set in any out-of-sample exercise we may run. Obviously, given the predictive nature of our analyses, we will not be able to attach any causal interpretation to our exercise. For our purpose, we will make use of VIPs, i.e., the proportion of times a predictor is selected as a splitting rule for the construction of the random trees. The construction and interpretation of VIPs are discussed in Section 8. Notably, selected predictors are contingent on the trained sample, i.e., their role will not have any external validity. Yet, we argue that identifying the drivers of the model performance helps further comment on the nature of exporting scores.
4.1 Methods
We train and compare different statistical learning techniques to get our best predictions. Thus, we make use of the generic predictive model for firms’ export status in the form:
 $$f( {\bf X}_i) = Pr( Y_i = 1\> \vert \> {\bf X}_i = x) $$
where Y i is the binary outcome that assumes value 1 if the ith firm is exporting and 0 otherwise.  ${\bf X}_i$ is a matrix that includes a full battery of firm-level predictors, which we discuss in detail in the following Section 4.2. Please note that, at this stage, we do not consider the time dimension, i.e., we train the predictive model considering the export status of a firm in relation to present predictors. In this baseline model, it is entirely possible that a firm is considered an exporter in one year and a non-exporter in another year. See Section 7, where we consider heterogeneous exporting patterns.
The functional form that links predictors to outcomes is ex-ante unknown and looked for by the generic supervised machine learning technique. We provide an overview of our different methods in Section 4.1. The advantage is to extract information from many predictors while catching non-linearities that may be present in the association with export status. Briefly, the generic predictive model has to pick the best in-sample loss-minimizing function in the form:
 $$\arg \;\min \sum\limits_{i = 1}^N L ( f( x_i) , \;y_i) \quad {\rm over}\quad f( {\cdot} ) \in F\quad s.\> t.\quad R( f( {\cdot} ) ) \le c$$
where F is a function class from which to pick the specific function f( ⋅ ). Importantly, R(f( ⋅ )) is the generic regularizer that summarizes the complexity of f( ⋅ ). The latter is a tool that allows us to solve the common trade-off between an as high as possible in-sample fit and an as high as possible flexibility of the prediction model able to take on board new out-of-sample information. It is the solution to the so-called bias–variance trade-off. The set of regularizers, R's, will change following the standards proposed by each method that we compare in the following paragraphs. Eventually, any method, while searching for the function that can be better used to process new out-of-sample information,will minimize the constrained loss function represented in equation (2).
As a common strategy across our different models, we will pick at random 80% of our French firms to be considered as in-sample information. We will then use it to train the generic statistical learning algorithm. We will keep the remaining 20% as out-of-sample information to predict export status. Hence, we will be able to assess the accuracy of our predictions within the limit of our data sources. As it is standard in similar exercises, we perform a cross-validation check, described in Section 6, to verify that a specific segment of the sample does not affect prediction accuracy.
In the following paragraphs, we show how a specific variant of the Bayesian Additive Regression Tree (BART) performs better than others because it is able to consider the presence of non-random missing values as further predictors for the outcome. The variant we use is the BART with Missingness In Attributes (BART-MIA). For more details, see also Kapelner and Bleich (Reference Kapelner and Bleich2015). For a previous application to firms’ dynamics, see Bargagli-Stoffi et al. (Reference Bargagli-Stoffi, Riccaboni and Rungi2020).
In general, any classification tree  ${\cal T}$ is built on if–then statements that split the training data according to the observed values of predictors, allowing for non-linear relationships between the predictors and the outcomes. Thus, the generic algorithm for the construction of a classification tree,
 ${\cal T}$, is based on a top-down approach that recursively splits the main sample into non-overlapping sub-samples (i.e., the nodes and the leaves). Therefore, to stop trees developing too many layers, the tree is pruned iteratively with the generic regularizer R to improve its predictive ability while avoiding overfitting.Footnote 5
As in the baseline version (Chipman et al., Reference Chipman, George and McCulloch2010), BART-MIA is a sum-of-trees ensemble with an estimation approach relying on a fully Bayesian probability model. The algorithm elaborates the ensemble by imposing a set of Bayesian priors that regularize the fit by keeping the individual trees’ effects small in an adaptive way. The result is a sum of trees, each of which explains a small and different portion of the predictive function. The BART-MIA variant we adopt can be expressed as:
 $${\rm {\mathbb P}}( Y = 1\vert {\bf X}) = \Phi ( {{\cal T}_1^{\cal M} ( {\bf X}) + \ldots + {\cal T}_q^{\cal M} ( {\bf X}) } ) , \;$$
where Φ denotes the cumulative density function of the standard normal distribution and the distinct binary trees are denoted by T q, each being a single tree coming with an entire structure made of nodes and leaves. The sum-of-trees model serves as an estimate of the conditional probit at  ${\bf X}$, which can be easily transformed into a conditional probability estimate of Y = 1.Footnote 6 The Bayesian component of the BART includes three priors that have been demonstrated to use the data at disposal efficiently:
1. the prior on the probability that a node will split at depth k is β(1 + k)−η, where β ∈ (0, 1), η ∈ [0, ∞), and the hyper-parameters are chosen to be η = 2 and β = 0.95;
2. the prior on the probability distribution in the leaves is a normal distribution with zero mean:
 ${\cal N}( 0, \;\sigma _q^2 ) $, where $\sigma _q = 3{\rm /}d\sqrt q $ and d = 2;
3. the prior on the error variance is σ 2 = 1.


Thus, the regularization parameter R( ⋅ ) in the general formulation of ML algorithm 2 corresponds to the priors themselves. Finally, the BART-MIA algorithm employs a Metropolis-within-Gibbs sampler (Hastings, Reference Hastings1970; Geman and Geman, Reference Geman and Geman1984) to generate draws from the posterior distribution of  ${\rm {\mathbb P}}( {\cal T}_1^{\cal M} , \;\ldots , \;{\cal T}_m^{\cal M} , \;1\vert \Phi ( Y) ) $.Footnote 7 Let us denote with K the size of the sample of the draws
 ${ p_1^\ast , \;\ldots , \;p_K^\ast } $ from the posterior distribution. Then, the prediction
 $p( x) = P( Y = 1\vert {\bf X}) $ at a particular x, is
 $$p^\ast ( x) = \sum\limits_{k = 1}^K {\,p_k^\ast } ( x) $$
In addition to the Bayesian component, the BART-MIA variant augments the original algorithm by exploiting information on missing values and splitting on missingness features that are used as additional predictors in each binary-tree component.
Eventually, the BART-MIA is chosen in the following as the baseline method after a comparison with four other alternatives. At first, we compare with a simple logistic regression (LOGIT), which is a classical econometric technique for binary outcomes with a specific ex-ante assumption on the functional form linking predictors with the outcome. Then, we perform three other methods based on regression trees, namely a Classification and Regression Tree (CART) (Breiman et al., Reference Breiman, Friedman, Olshen and Stone1984), a Random Forest (RF) (Breiman, Reference Breiman2001), and the original unaugmented BART. CART is the most basic regression tree, while RF is an ensemble method that aggregates different regression trees to get a stronger predictive power, as the BART does, but without a Bayesian framework. Finally, we compare previous regression trees’ models with the Least Absolute Shrinkage and Selection Operator (LASSO) in the form:
 $$_{\beta \in {\mathbb R}^p}^{{\rm arg\ min}} \;\displaystyle{1 \over {2N}}\sum\limits_{i = 1}^N {{( {y_i( x_i^T \beta ) -{\rm log}( 1 + e^{( x_i^T \beta ) }) } ) }^2} \;{\rm subject}{\mkern 1mu} {\mkern 1mu} {\rm to}{\mkern 1mu} {\mkern 1mu} {\rm \Vert }\beta {\rm \Vert }_1 \le k.$$
where y i is a binary variable equal to 1 if a firm i is an exporter and 0 otherwise. Any x i is a predictor chosen in ℝp, whereas  ${\parallel} \beta \parallel _1 = \sum _{j = 1}^p \vert {\beta_j} \vert $ and k > 0. The constraint
 ${\parallel} \beta \parallel _1 \le k$ limits the complexity of the model to avoid overfitting, and k is chosen, following Ahrens et al. (Reference Ahrens, Hansen and Schaffer2020), as the value that maximizes the Extended Bayesian Information Criteria (Chen and Chen, Reference Chen and Chen2008). To account for the potential presence of heteroskedastic, non-Gaussian and cluster-dependent errors, we adopt the rigorous penalization introduced by Belloni et al. (Reference Belloni, Chernozhukov, Hansen and Kozbur2016).
4.2 Predictors
To increase models’ predictability, we include a full battery of 52 predictors that we derive from firms’ balance sheets and profit and loss accounts. Broadly speaking, we choose to include:
1. original financial accounts without any elaboration;
2. financial ratios and other proxy indicators (e.g., productivity, economies of scale, spillovers) that we expect to be correlated with exporting activity;
3. firms’ locations, ownership status, and industry affiliations, which can help in spotting categories of firms at a competitive advantage or disadvantage.
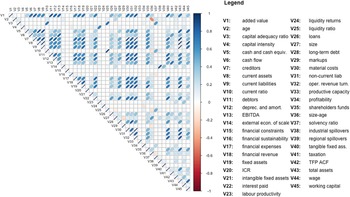
Usefully, in Figure 2, we show a correlation matrix including all numeric predictors. Please note how some of them are indeed much cross-correlated with values well above 0.6. Yet, high correlations are not that relevant to our case since, in a context of pure prediction such as ours, we do not (want to) estimate coefficients. At this stage, we also do not need a prior on which financial information conveys the highest predictive power. Hence, we choose not to discriminate among predictors ex ante, although we do have information provided by previous literature that some variables more than others are associated with exporting activity (productivity, firm size, financial constraints, etc.). See also a specific robustness check in Section 6, where we show what happens when we reduce our set of predictors. In other words, we are well aware that our long list of predictors entails a great deal of endogeneity among variables that are otherwise studied in different structural relationships. As we are not interested in obtaining estimates for determinants of trade, such endogeneity is not relevant for our purpose. What we need to do is to minimize the prediction errors given, albeit marginally useful observable information. In Section 9, we further discuss the limits and benefits of a pure predictive exercise when it comes to the interpretability of predictors.
Correlation matrix of predictors
Note: We report a correlation matrix of the predictors we use. Non-numeric predictors are excluded here but included in the following analyses: NUTS-2 locations, NACE Rev.2 industries, a categorical variable for consolidated accounts, patents’ dummy, inward FDI, outward FDI, and corporate control. Positive correlations are reported as upward-sloping ellipses, while negative correlations are reported as downward-sloping ellipses. The color intensity and the ellipse width indicate the strength of the correlation.

5. Results
5.1 Models’ horse race
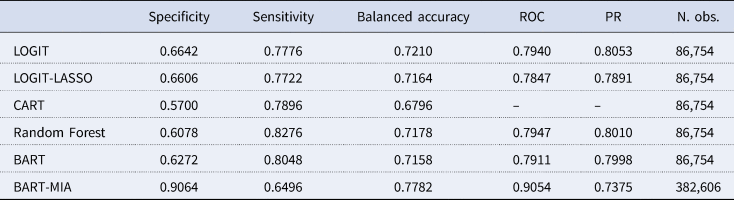
In Table 1, we compare measures of standard prediction accuracy across the methods we test. Briefly, what we can see is that Sensitivity focuses on the ability to predict exporters, i.e., the amount of true positives, while Specificity focuses on the ability to predict non-exporters, i.e., the amount of true negatives. Balanced Accuracy is an arithmetic mean between Sensitivity and Specificity. Importantly, the receiver operating characteristic (ROC) curve evaluates the predictive performance at different classification thresholds and it is our baseline measure of performance across different models. Finally, Precision-Recall is of help to us in assessing the trade-off between returning accurate results (high precision) vis-á-vis returning a majority of positive results (high recall).
Prediction accuracies

Note: We report standard measures of prediction accuracies (by column) for different methods we train (by row). Any observation is a firm-year present in the sample. All methods but BART-MIA do not train or test on observations when at least one predictor is missing.
From Table 1, we immediately notice that BART-MIA outperforms other methods with an ROC equal to 0.9054, a value that is considerably higher than in the case of other methods. In fact, BART-MIA is in general more able than others to predict both exporters and non-exporters, with a Balanced Accuracy of 0.77.
Yet, when we look at Specificity vis-ávis Sensitivity values, we realize it predicts relatively better non-exporters rather than exporters. The reason is that the boost in overall prediction accuracy by BART-MIA is largely due to an efficient use of the non-random missing values on smaller firms reporting incomplete financial accounts. See also the specific robustness checks performed in Section 6. As largely expected, smaller firms with partial information are also the ones that are more likely to be classified as non-exporters, because: (i) larger size is more likely to be associated with an export status, and (ii) smaller firms do not have to report financial information as complete as that required of bigger companies.
Since BART-MIA is able to include the missingness of any single feature as an additional predictor (i.e., as yet another branch of the regression tree), we understand why it outperforms other methods, which instead simply drop from computation companies that have any missing values in predictors.
Finally, a simple comparison between the accuracy of BART and the one of BART-MIA allows us to quantify what is the gain in considering the predictive power of missing values. Overall, we observe a 14.4% increase in ROC, which we take as our baseline measure of prediction accuracy. We will further discuss the trade-off between Specificity and Sensitivity once we challenge our results in Section 7. Suffice it to say here that, in general, predicting true exporters is made difficult by the presence of temporary trade, i.e., when firms export in some years and not in others, thus breaking the time series.
5.2 Predictions
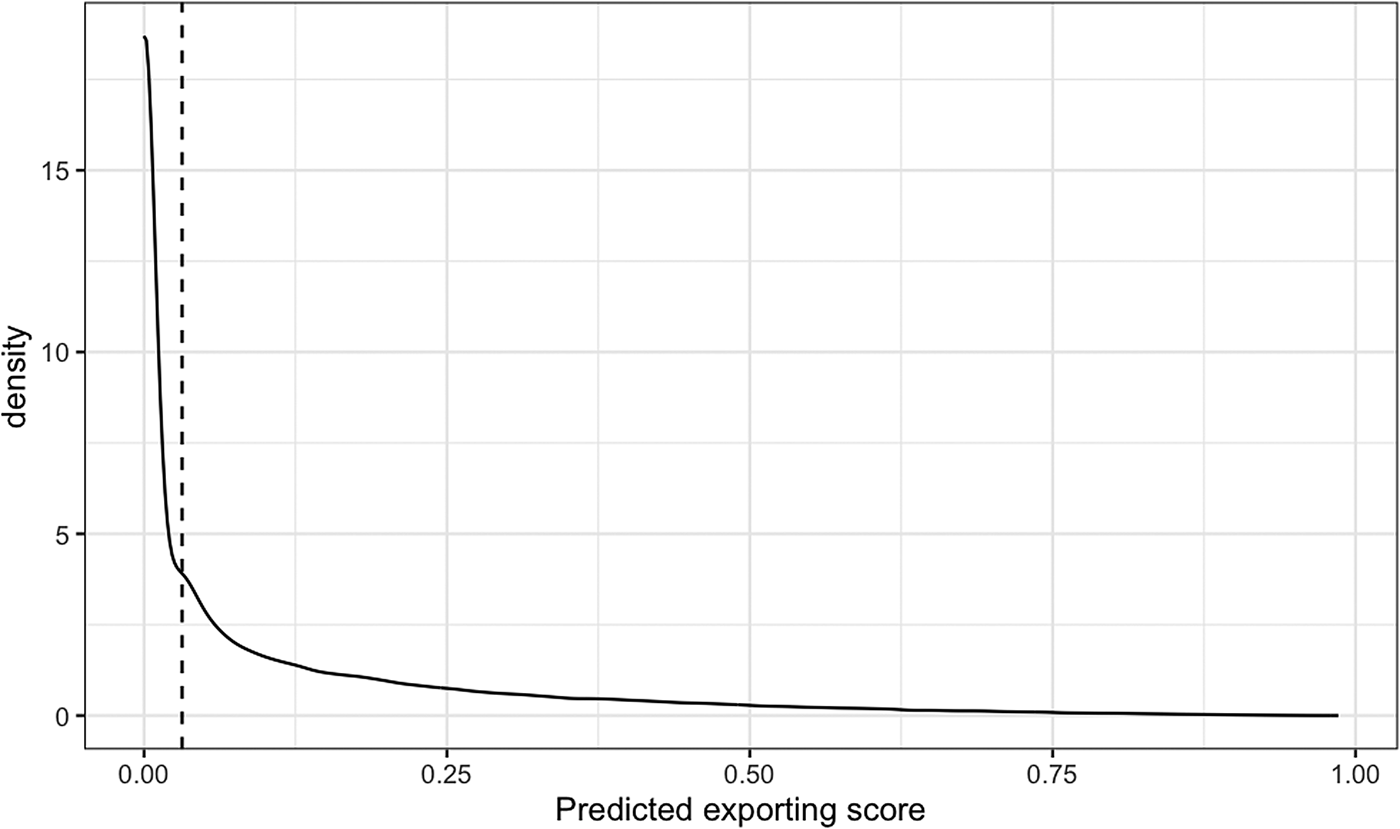
In Figure 3, we report the entire distribution of predicted scores for non-exporters that we obtain from our baseline BART-MIA. Without any selection threshold, these are the values that one could consider for evaluating how far a company is from export status. What is relevant to observe here is that the distribution is much skewed, hence the majority of non-exporters in France is located on a thick left tail, thus far from being able to propose on foreign markets. Briefly, the distribution of scores that we obtain here is consistent with the idea of firm heterogeneity that we take from trade literature, as introduced in Section 2. In other words, only a relatively small number of non-exporters is proximate to the right tail's goal. The observation that firms are heterogeneous also in exporting scores is relevant for taking informed policy decisions that we discuss in Section 10.
Distributions of exporting scores of non-exporters after BART-MIA
Note: We report the distribution of the score after implementing BART-MIA on the entire sample and selecting all non-exporting firms. The vertical line identifies the median non-exporting firm.

6. Robustness checks
So far, we adopted a relatively standard 80 − 20 random partition of the firms in the sample at our disposal when training our model (Athey et al., Reference Athey, Imbens, Metzger and Munro2021). Therefore, our first concern here is to cross-validate our choice by repeating the prediction exercise four more times with a similar random partition. We want to check that our high prediction accuracy is not due to a fortunate selection of the training-and-testing partition. Any time, we train on a random 80% of the dataset that we consider as in-sample information, then we test the accuracy of our predictions on the remaining 20%, which we take as out-of-sample information. We obtain similar performance scores across all exercises, and we pick BART-MIA once again as the most predictive algorithm. We conclude that previous results had not been driven by a specific selection of training vis-á-vis testing data.
Our second concern is that prediction accuracies are robust to different definitions of exporters. So far, we defined an exporter as any firm with positive exporting revenues. Tto make our results robust to the presence of so-called passive exporters, here, we will define an exporter as a firm whose export share over total revenues is higher than a specific minimum threshold(Geishecker et al., Reference Geishecker, Schröder and Sörensen2019), i.e., domestic firms that engage in one-off exporting events.
We run simulations by excluding from the category of exporters those firms that report export shares lower than the first, second, and fifth percentile. Prediction accuracies are similar in magnitude to those of our benchmark definition. Latter evidence suggests that baseline predictions are not affected by the presence of a few less proactive firms.
A third concern we have is to verify the robustness to changes in predictors. Our problem here is whether we could obtain similar prediction accuracy with less effort, such as neglecting variables that have relatively little predictive power. For this purpose, we perform a Logit-LASSO exercise before running again the models described in Section 4.1. As in standard applications (Belloni et al., Reference Belloni, Chernozhukov, Fernández-Val and Hansen2017), the Logit-LASSO selects a subset of best predictors (in our case, 23 out of 52) to contribute relatively more in predicting export status. Once again, BART-MIA outperforms other statistical learning techniques. However, when we perform BART-MIA including only such a subset of predictors, we obtain lower accuracy than baseline results. Yet, we gather there is no reason to exclude available predictors despite the high cross-correlations we observed in Figure 2.
A fourth concern we have is the need to check whether the time of training and testing matters for predictions. So far, we have considered firms and their export status throughout the entire period at our disposal, between 2010 and 2018. Now, we train and test our predictive model separating each year and find that the predictions do not change dramatically over the timeline.
A fifth concern is that performance measures are robust to different probability thresholds for predicting the exporting status. In baseline analyses, we adopt a quite standard cut-off value set at 0.5 to separate exporters and non-exporters in prediction. We know that exporting is a relatively rarer event than non-exporting, and our prediction accuracies can suffer from a bias. The choice of the threshold is, indeed, crucial for the computation of most prediction accuracies because the values in Table 1 are threshold-specific. For a similar case in trade literature, see Baier et al. (2014). Here we want to check that a different threshold does not alter the ranking of methodologies obtained by comparing prediction accuracies in Table 1. Therefore, we check if the performance measures vary when we choose, for each model, the optimal cut-off value obtained following Liu (Reference Liu2012), who aims at maximizing the product of sensitivity and specificity. When an optimal threshold is set, the evidence of BART-MIA superiority is even more striking as it outperforms the others by all measures of prediction accuracy except for PR. We will discuss in Section 7 how the latter is negatively affected by the presence of discontinuous exporters. Note, however, that both PR and ROC are not affected by the change in cut-off values because they are independent of thresholds by construction. The latter is also the reason why we consider them as baseline measures of performance.
A final concern is that baseline predictions improve mechanically only because the sample size is bigger in BART-MIA than in other exercises. In fact, we want to investigate whether improvements actually come from missing values. For our purpose, we perform two different exercises: (i) we add ex ante a predictor to our original set that catches the relative missingness of financial information at the firm-level; (ii) we impute missing values on single predictors based on median values available from other companies’ financial accounts. From a combined reading of both exercises, we better understand the role of missingness.
Interestingly, prediction accuracies do increase overall for all methods after predictors’ imputation, although classification trees, BART,Footnote 8 and Random Forest, perform relatively better along the different segments of the distribution (ROCs are 0.907 and 0.905, respectively). Eventually, when we check for the relative importance of a predictor on missingness, we find that it is always selected as the best predictor no matter what procedure we choose. We conclude that missing values do have a prediction power, yet our baseline BART-MIA better catches their role without introducing unnecessary data manipulation.
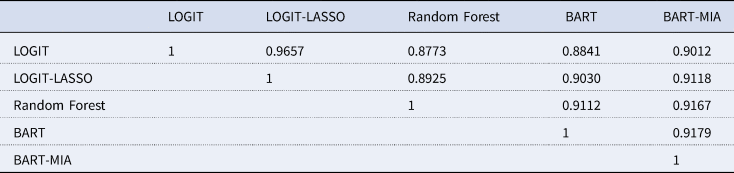
Eventually, we consider useful also reporting Spearman's rank correlations in Table 2, to test whether rankings in predictions are sensitive to the choice of predictive models in Table 1. Please note how, by construction, the Spearman's rank correlations can be performed only on the subset of the data where every technique obtains predictions.
Spearman's rank correlations of predicted probabilities from different models

Note: We report a Spearman's rank correlation among out-of-sample predictions to show how rankings in export status are sensitive to changes in predictive models. All models, including BART-MIA, are thus trained and tested on the same observations.
As a matter of fact, we get relatively high rank-correlations across predictive models with a minimum of 0.87 and a maximum of 0.96. In general, models do not dramatically alter the relative positions of firms on the distribution of predictions. Interestingly, please note that rank-correlation between the simpler BART and the BART-MIA is about 0.92. Although the latter is just a variant of the first with missingness of values as an additional feature, the rankings in predictions are different. The latter is a significant result that allows us to further qualify the difference between the simpler BART and its variant. The bottom line is that information from firms with missing values in predictors allows BART-MIA to identify different thresholds on predictors’ distributions, which in turn change the relative positions of firms on the distribution of predictions.
7. Sensitivity to temporary trade
We investigate in this section the sensitivity of our results to the presence of discontinuous exporting activity, i.e., when firms engage in trade relationship that are temporary (Békés and Muraközy, Reference Békés and Muraközy2012). Indeed, the biggest challenge we face when predicting exporters is that firms can export in some years and then lay idle for a while before re-proposing (or not) on foreign markets. This is especially true for smaller firms or for firms that are specialized in manufacturing capital goods. Thus, our prior is that discontinuity is not at random; it could be correlated with some firms’ attributes, and our previous predictions could therefore be sensitive to the relevance of temporary trade within our sample.
For our purpose, we perform separate checks by classifying firms into five categories:
1. firms that always export, which we call constant exporters;
2. firms that never export, which we call non-exporters;
3. firms that start exporting at some period t and always export afterwards, which we call switching exporters;
4. firms that export in all periods until t and never export afterwards, which we call switching non-exporters;Footnote 9
5. discontinuous exporters, which export with an irregular pattern with more than one gap along the timeline.
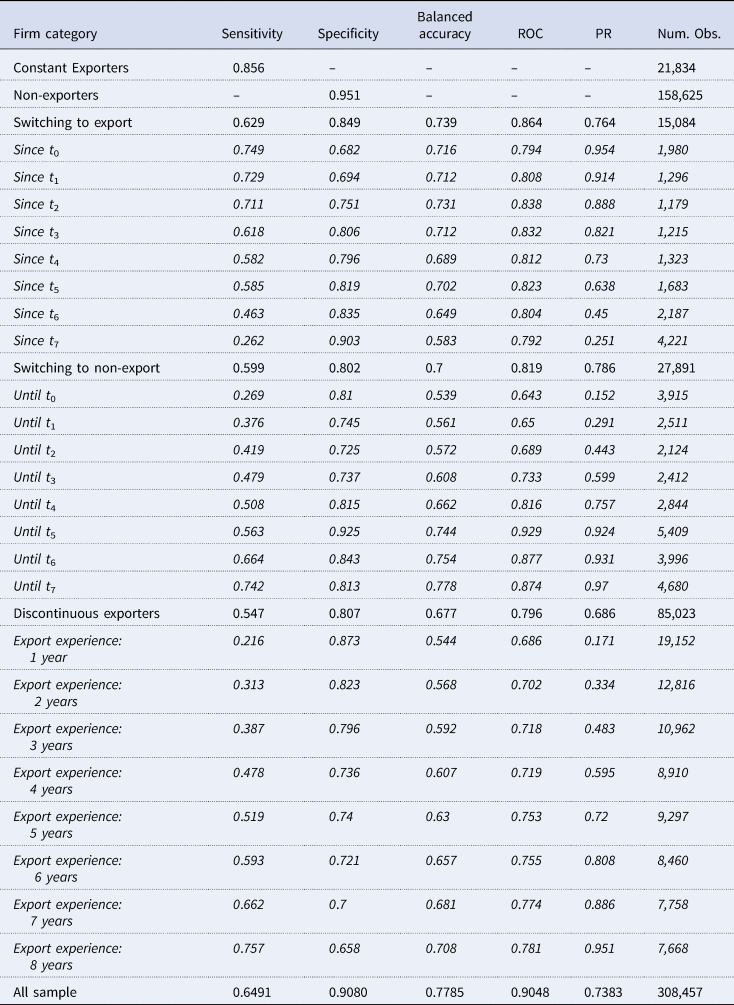
Prediction accuracies are reported in Table 3, after testing out-of-sample our baseline BART-MIA algorithm. As expected, we observe that our predictive model performs quite well in separating constant exporters from non-exporters, since Sensitivity and Specificity are about 0.86 and 0.95, respectively.Footnote 10 However, predictions become relatively less accurate when we look at out-of-sample information on firms that show gaps along the timeline. In general, in the case of switching exporters and switching non exporters, we still have acceptable accuracies as the ROCs reach up to 0.86 and 0.81, respectively. In line with our prior knowledge, the quality of predictions is proportional to the number of years that the firms actually exported. Predictions are more accurate when firms started (stopped) exporting sooner (later) in our data.
Prediction accuracies and temporary trade

Note: We report prediction accuracies after BART-MIA for firms with different exporting patterns. For switching-exporters and switching-non-exporters we identify the year when they are observed changing status, i.e., the year when the firm passes from never exporting to always exporting, and vice versa. For discontinuous exporters. we distinguish by number of exporting years over the sample timeline.
Finally, we focus on the category what we define discontinuous exporters, when firms have more than one break in the time series, entering and exiting the export status. In this case, at the bottom of Table 3, we find that prediction accuracy reached a relatively lower albeit acceptable threshold (ROC:0.80). The accuracy is lower than the one obtained in predicting constant exporters and non-exporters. Interestingly, we do register that our procedure is less and less able to predict the export status in the case of firms that have less experience of foreign markets. This is however consistent with the idea that firms engaging in temporary trade may continue to do so systematically; hence, their lower predictability on a year-by-year basis.
Eventually, a final sensitivity check to temporary trade is performed by introducing a more liberal definition of exporters proposed by Békés and Muraközy (Reference Békés and Muraközy2012), according to whom only firms with at least four years of consecutive exporting can be actually considered as permanent exporters vis-ávis temporary exporters. As largely expected, we find in that prediction accuracies for permanent exporters are relatively higher (AUC:0.849; PR:0.934) than in the case of temporary exporters. In particular, the model fails at predicting the export status of temporary exporters, i.e., it reports a relatively lower true positives’ rate, as shown by the low scores on sensitivity, PR and ROC.
From our viewpoint, it makes sense that exporters with irregular exporting patterns represent intermediate cases somewhere between firms that always export and firms that never export. Therefore, classification algorithms struggle to separate intermediate cases on a binary outcome. Based on financial accounts, such firms can be seen neither as fit for exporting as constant exporters nor as unfit as non-exporters. Yet, it is more likely that such intermediate cases are of less interest in policy applications because trade promoters or financial institutions need instead to understand whether a firm that never exported at all needs some support or not.
8. Interpretability of predictors
In line with our empirical strategy, we have focused so far on prediction accuracy while neglecting the role of single predictors. We discussed in Section 4 how our choice is driven by the necessity to maximize prediction accuracy. Therefore. we have been using an as complete as possible list of predictors, even though we are aware that we carried on with a compound of endogenous variables that are highly cross-correlated, as commented after Figure 2.
What we want to do now is to show how predictors do have different influence on the outcome, and we can still discuss their influence on predictions without implicating any causality. On the contrary, the internal validity of our ‘influential predictors’ is to us more important than an external validity. They are relevant because we can interpret them in relationship with the specific prediction exercise on which we want to comment. If we consider a different sample, those ‘influential predictors’ will almost certainly be different.
VIPs are our baseline method for the interpretability of a BART-MIA exercise).Footnote 11 The VIP for any given predictor represents the proportion of times that a variable is chosen as a splitting rule out of all splitting rules among the posterior draws of the sum-of-trees model (Kapelner and Bleich, Reference Kapelner and Bleich2013). It is computed as follows: (1) Across all q trees in the ensemble we examine the set of predictor variables used for each splitting rule in each tree; (2) for each sum-of-tree model, we compute the proportion of times that a split using x p as a splitting variable appears among all splitting variables  ${\bf X}$ in the model; with (3) K being the number of the sum-of-tree models
 $f_k^\ast $, drawn from the posterior distribution
 ${\rm {\mathbb P}}( {\cal T}_1^{\cal M} , \;\ldots , \;{\cal T}_m^{\cal M} , \;1\vert \Phi ( Y) ) $, and z pk being the proportion of all splitting rules that use the pth component of
 ${\bf X}$ in model
 $f_k^\ast $, the VIP is computed as
 $$v_p = \displaystyle{1 \over K}\sum\limits_{k = 1}^K {z_{\,pk}} $$
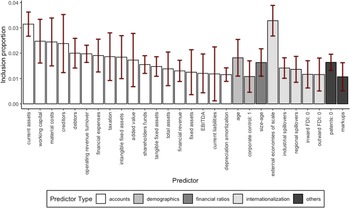
Thus, we report in Figure 4 a visualization of the VIPs accompanied by a standard deviation that is computed after running five different random tests. Please note how averaging across multiple trials allows us to improve the stability of estimates, as suggested by Kapelner and Bleich (Reference Kapelner and Bleich2013). For the sake of visualization, we report in Figure 4 only those predictors that register a VIP equal to or higher than 1%.
Variable inclusion proportions after BART-MIA
Note: We report VIPs, i.e., the proportion of times each predictor is chosen for a splitting rule in BART-MIA. Of all the predictors in baseline, we visualize only those with a VIP higher than 1%. The bars represent standard deviations of inclusion proportions obtained by replicating five different times the BART-MIA on the same random training set.

When we look at Figure 4, we document that the best predictor in our baseline exercise is the proxy we use for the existence of external economies of scale, which indicates the presence of other firms in the same industry and in the same region, as suggested by Bernard et al. (1995). Once again, we want to stress that since we are in a pure prediction framework, we cannot say whether external economies of scale, measured in this way, are an actual determinant of export status. We cannot exclude reversal causality. On the one hand, it is indeed possible that local spillovers help neighbouring firms to start exporting after, for example, sharing infrastructures or intangible knowledge about foreign markets: Dhyne et al. (2023) found such a dynamic using buyer–seller linkages in the Belgian production network. On the other hand, it is possible that firms in industries at a comparative advantage locate in geographical proximity before becoming exporters. In any case, it is beyond the scope of our analysis to unravel the endogeneity of this specific relationship or any other we know we have among predictors and the outcome. Suffice it to say that the industrial concentration of exporting firms in a region of France is a good, albeit not unique, predictor of export status for the representative firm located in that area.
Notably, we observe in Figure 4 how original accounts altogether provide an important contribution to predict export status. However, no single predictor contributes more than 4% in any of the tests we performed. Besides financial accounts, business demography has predictive power: firm age has an inclusion proportion higher than2%. It also makes perfect sense that the activities of multinational enterprises play a role in export status. Being either a foreign subsidiary (inward FDI) or owning a subsidiary abroad (outward FDI) affects the probability of exporting. As expected, the ability to innovate and register patents is also related to the likelihood of becoming an exporter.
Eventually, we want to bring the attention on the absence of Total Factor Productivity (TFP). Among the predictors shown in Figure 4, which we however included following the methodology by Ackerberg et al. (2015). Although TFP is a much-studied determinant of export status, we do not find it to be among the most relevant predictors in a machine learning exercise. Our educated guess is that the role of TFP is already captured by the sample variation in raw financial accounts that are also needed to compute it as a residual from a firm-level production function (turnover, costs of materials, employees, etc.).
9. Internal vs. external validity
In this section, we discuss the reproducibility of our predictive exercise in different contexts, i.e., the external validity of our results.
A first concern we want to address is the possibility to replicate our study in the case of other countries, e.g. in the case of countries that differ in economic development. In this contribution, we investigate the case of France mainly because French firm-level data has been used extensively in related literature. Yet, we argue that our predictive setup can be applied to any country, regardless of its economic development, provided that financial accounts have predictive power on a firm's export status. We have already discussed in Section 2 how we rely on extensive literature that supports the evidence that exporters are significantly different from non-exporters when we look at financial accounts (Bernard and Jensen, Reference Bernard and Jensen1999; Melitz, Reference Melitz2003; Melitz and Ottaviano, Reference Melitz and Ottaviano2008; Bernard et al., 2012; Melitz and Redding, Reference Melitz, Redding, Gopinath, Helpman and Rogoff2014; Lin, Reference Lin2015; Hottman et al., Reference Hottman, Redding and Weinstein2016). Therefore, in the case of developing countries, we do expect exporters and non-exporters to be at least as statistically different in financial accounts as in the case of a developed country. In the case of developing countries, we actually expect domestic allocative inefficiencies to be higher and exporters to be relatively larger and more productive than non-exporters, very concentrated at the top of the distribution (Tybout, Reference Tybout2000; Alfaro et al., Reference Alfaro, Charlton and Kanczuk2009). In this case, we expect our algorithm, if anything, to perform at least as good in a developing country as in the case of France.
A second concern relates the external validity of our results on the prediction power of single financial accounts in Section 8. Can we assume that they will have a similar predictive power in other contexts? We argue they will not. VIPs constitute a posterior probability that the variable x k has a (linear or non-linear) association with the response variable (Bleich et al., Reference Bleich, Kapelner, George and Jensen2014). Variables selected through VIPs would be almost certainly different if we considered different countries or regions. Yet, we argue that the relevance of VIPs resides in their internal validity, given the peculiarity of each predictive exercise. For example, one could compare across different countries or regions how the relative importance of predictors changes and use that information to take solid policy decisions. To make our point, we replicate our exercise after separating Île-de-France from the rest of the country.
We observe that not only the set of influential predictors differs, but also that the relative importance of predictors changes from one exercise to the other. This hints at the presence of locally different dynamics. For example, the predictor (log of) number of employees is selected in the sample excluding Île-de-France, but not in Île-de-France, where there is possibly more homogeneity in terms of firm size. In contrast, the predictor patent is influential in Île-de-France, but not elsewhere, possibly indicating that in the first there is a comparative advantage in more innovative activities that have the potential to reach foreign markets. Prima facie, the latter evidence is consistent with our prior knowledge about the landscape of the French economy.
A third concern we want to address is the validity of our methodology in presence of structural breaks or external shocks, e.g. in the case of policy changes. In this regard, please note that ours is a cross-sectional classification exercise: we use information on both exporters and non-exporters to understand how non-exporters are statistically different from exporters. We could pool data over longer periods in order to increase the training set's size. However, it is unnecessary for our scope, and we included a few robustness checks in Section 7 when we changed the pooling strategy. Eventually, in our case, the levels of prediction accuracy depend only on the ability of predictors to capture the statistical difference between exporters and non-exporters within the same period in different contexts. Structural breaks or policy shocks are of no concern to us as far as we do not use variation from the past to predict the future. Our only concern is that our list of predictors includes the different dimensions that can contribute to the gap between exporters and non-exporters in different policy environments. A discussion of the rationale for single predictors was included in Section 4.2.
10. How to use exporting scores
We now provide new examples of possible applications of exporting scores as either indicators for trade credit or a tool for assessing the trade potential of regions and industries. Based on the prior knowledge that exporters and non-exporters are statistically different across financial attributes, we use in-sample information to predict out-of-sample capability to export. Thus, it is possible to build a continuous indicator that provides an exporting score based on our baseline predictions to indicate the potential of companies to successfully enter foreign markets, i.e., their distance from export status. We visualize our intuition in Figure 1.
Briefly, we can get a basic and simple export (probabilistic) score for any out-of-sample non-exporting ith firm in the form:
 $${\rm distanc}{\rm e}_i = 1-Pr( Y_i = 1\> \vert \> {\bf X}_i = x) $$
which is by definition bounded in a range (0, 1), and made conditional on the set of predictors,  ${\bf X}_i$, as from previous exercises.
To illustrate our idea of the relationship with creditability, we perform back-of-the-envelope estimates here to predict how much capital and cash resources may be needed by a company to become fit for export. We classify firms in different risk categories, i.e., categories based on a partition of the distribution of exporting scores obtained in Figure 3. For simplicity, let us consider all firms included in a decile of predictions as belonging to the same risk category. Obviously, the higher the distance from export status, 1 − Pr(Y i), the higher the risk for trade credit. We obtain symmetric segments of length equal to 0.1, i.e., about ten percentage points of lower risk in each category when approaching export status. Therefore, we can run the following simple specification:
 $$\log Y_{it} = \beta _0 + \mathop \sum \limits_{10}^{{\rm risk} = 1} \theta _{{\rm risk}} + \beta _1x_{it} + { + } \phi _t + \delta _s + \eta _r + \epsilon $$
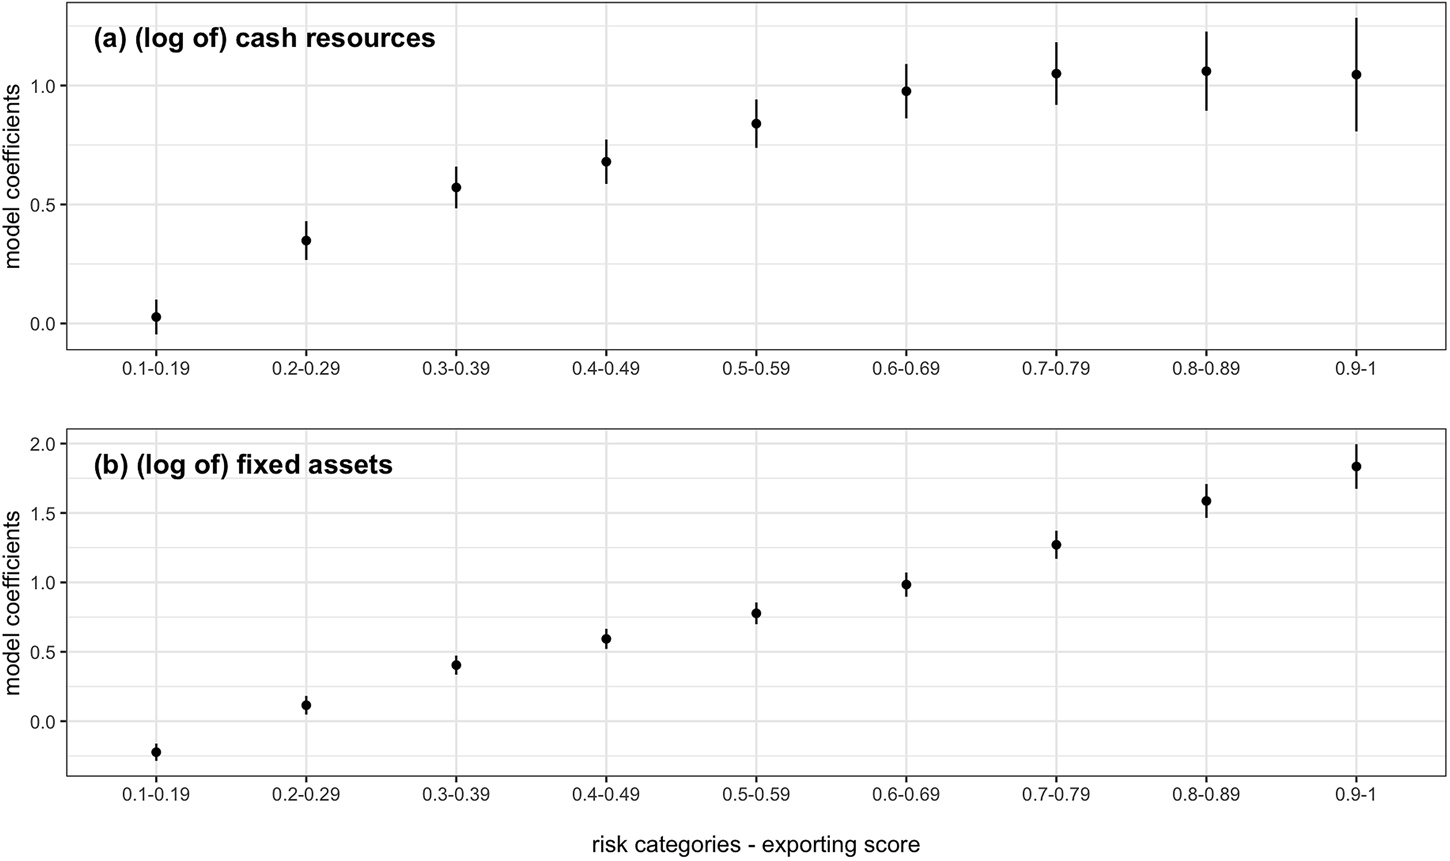
where Y it is either cash resources or fixed assets for firm i at time t, and x it is its firm-level size. We will always control for time (ϕ t), four-digit NACE sector (δ t), and two-digit NUTS region (η r) fixed effects. We cluster standard errors at the firm level. Crucially, our coefficients of interest are the ones on θ risk, as these are the risk classes we built on exporting scores. We report them in decreasing order of risk in Figure 5 together with 99% confidence intervals. Once we omit the first segment [0, 0.09], the estimated intercepts of equation (7) will indicate (logs of) cash resources and fixed assets needed by a representative firm that is more distant from export status. To obtain what is on average needed by a firm in a risk category, we predict (log) premia with respect to the baseline omitted first segment. For example, the representative firm with exporting scores lower than 0.1 operates with  ${\rm exp}( \widehat{{\beta _0}}) = {\rm exp( }11.6338) \approx 112, \;850$ euro of cash resources and
 ${\rm exp}( \widehat{{\beta _0}}) = {\rm exp}( 13.4027) \approx 661, \;790$ euro of fixed assets. Firms in the fifth category, when exporting scores are in a range [0.4, 0.5), will need
 ${\rm exp}( \hat{\beta }_0 + \widehat{{\theta _5}}) = ( 11.6338 + 0.6797) \approx 222, \;690$ euro of cash resources and
 ${\rm exp}( \hat{\beta }_0 + \widehat{{\theta _5}}) = exp( 13.4027 + 0.5933) \approx 1, \;197, \;800$ euro of fixed assets. To put it differently, we can say that a firm that is in a medium-risk category needs about 97% more cash resources and about 81% more fixed assets compared with a firm with the lowest exporting scores.
Premia on relevant firm dimensions across exporting scores
Note: Fixed effects on segments of exporting scores after linear regressions where the outcomes are (log of) cash resources and (log of) fixed assets, respectively. We always control for firm size, NUTS 2-digit regions, NACE 2-digit industries, and fixed time effects. Errors are clustered at the firm level.

However, if we look at firms in a comfort zone with exporting scores in a range [0.9, 1], we see that they operate with  ${\rm exp}( \hat{\beta }_0 + \widehat{{\theta _{10}}}) = {\rm exp}( 11.6338 + 1.0459) \approx 321, \;160$ euro of cash and
 ${\rm exp}( \hat{\beta }_0 + \widehat{{\theta _{10}}}) = {\rm exp}( 13.4027 + 1.8348) \approx 4, \;145, \;360$ euro of fixed assets. Please note that the higher the probability that a firm starts exporting, the higher the cash resources and capital expenses it needs. In the latter case, if we compare with average exporting scores in the fifth risk class, we find that medium-risk firms need 44% more cash resources and up to 246% more capital expenses to look like firms that have been classified under the lowest risk category.
We observe that there is an increasing need for financial resources to climb risk categories and reduce the distance from export status. Based on predictions made on the experience of both exporters and non-exporters, a financial institution could evaluate whether it wasworth the effort to invest in internationalization, and how many resources a firm would need to reach its target.
Finally, we spend a few words to show how exporting scores can help assess the potential for expanding the number of exporters in a region or an industry, i.e., the potential for a trade extensive margin. Openness to international trade is a determinant of economic growth. Consumers can gain from trade thanks to differential comparative advantages and economies of scale. Both developed and developing economies have benefited from integration into the global economy through export growth and diversification. Thus, export performance has been long used as yet another proxy for measuring countries’ competitiveness by a consolidated tradition in economic literature and by international organizations (Leamer and Stern, Reference Leamer and Stern1970; Richardson, Reference Richardson1971a, Reference Richardson1971b; Gaulier et al., Reference Gaulier, Santoni, Taglioni and Zignago2013).
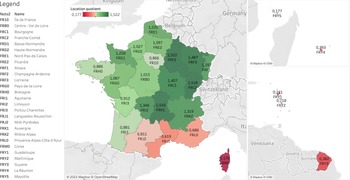
To make our point, we follow a dartboard approach as in Ellison and Glaeser (Reference Ellison and Glaeser1997) (see Figure 6 for further details on computations). Regions with location quotients greater than 1 are the ones where potential exporters are more concentrated than what one would expect. Eventually, we did find a geographic pattern since non-exporters with the highest potential are mainly present in North-Eastern regions. In contrast, Southern regions and overseas territories lag behind in trade potential.
The potential for extensive margin across France
Note: We report location quotients of non-exporters whose score is above the median in the national distribution. Regions with location quotients greater than 1 (lower than 1) are those where potential exporters are more (less) concentrated than what one would expect given manufacturing density.

Eventually, more sophisticated analyses on the distribution of exporting scores in industries and regions can be performed to evaluate trade potential. For example, one could exploit the variation in time to understand how competitive a region or an industry is becoming. Also, one could compare across countries to check whether there is different potential for trade beyond actual export performance. We believe any of them could be a useful tool in the analysis that aims at assessing the trade competitiveness of an economy.
11. Conclusions
This paper exploited statistical learning techniques to predict firms’ export ability. After showing how financial accounts convey non-trivial information in order to separate exporters from non-exporters, we propose predictions as a tool that can be useful for targeting trade promotion programs, trade credit, and in assessing firms’ trade potential. The central intuition is that exporters and non-exporters are statistically different in their financial structures since they have to sustain the sunk costs of gaining access to foreign markets, where regulations and consumer tastes differ. Thus, we train and test various algorithms on a dataset of French firm-level data from 2010 to 2018. Eventually, we find that the Bayesian Additive Regression Tree with Missingness In Attributes (BART-MIA) outperforms other models due to efficient use of the non-random missing information on smaller firms reporting incomplete financial accounts.
Notably, prediction accuracy is rather high, up to 90%, and robust to both changes in the definition of exporters and different machine learning training strategies. Interestingly enough, our framework allows handling cases of discontinuous exporters, as they are intermediate cases between permanent exporters and non-exporters. Eventually, we discuss how predictions can be used as scores to catch firms’ internationalization strategies and creditability. For example, imitating what a financial institution would professionally do, we order firms along risk categories. Thus, we show back-of-the-envelope estimates of how much cash resources and capital a firm would need to climb risk classes and become fit for foreign markets.
To conclude, we argue that exporting scores obtained as predictions from firm-level financial accounts can be yet another useful tool in the analyst kit to evaluate trade potential at different levels of aggregations. As we show in the case of France, for which we provide summary statistics where a high heterogeneity of trade potential is detected across regions.
Supplementary Materials
To view supplementary material for this article, please visit https://doi.org/10.1017/S1474745623000265.
Acknowledgements
We want to thank Tommaso Aquilante, Gabor Bekes, Kristina Bluwstein, Falco Bargagli Stoffi, Mahdi Ghodsi, Andreas Joseph, Massimo Riccaboni, Michele Ruta, Gianluca Santoni, Beata Smarzynska Javorcik, Maurizio Zanardi for valuable comments. We want also to acknowledge valuable suggestions by participants to the annual meeting of the European Economic Association 2022, the seminar series jointly organized by FIW and WiiW in Vienna, and to the European Trade Study Group 2021 in Ghent. Armando Rungi claims financial support from Artes 4.0 - Industry 4.0 Competence Center on Enabling Digital Technologies and Systems.