I. INTRODUCTION
Owing to great applications in novel electronic devices, such as thermal transducers Reference Vasil'ev1 and chip interconnects, Reference Murarka, Verner and Gutmann2,Reference Tsang and Hui3 copper (Cu) nanofilms have attracted a lot of research interest in recent years. For example, Dingreville et al. Reference Dingreville, Kulkarni, Zhou and Qu4 developed a semianalytical method to compute elastic moduli of copper nanofilms and to examine the effects of size and surface orientation on the elastic moduli. Gan and Chen Reference Gan and Chen5 studied the influence of size, temperature, and strain rate on thermomechanical properties (such as the strength and modulus) of copper nanofilms. Chang and Ding Reference Chang and Ding6 examined the effects of grain size and film thickness on elastic and plastic properties of copper nanofilms. Recently, Jing et al. Reference Jing, Liu and Yao7 investigated deposition and annealing behaviors of Cu atoms onto a copper substrate. Besides mechanical properties, melting temperatures and the corresponding melting behaviors of copper nanofilms are another critical issue for the development and design of electronic devices because they impose restrictions on the operation range of the devices. Concerning the melting temperatures, it has been reported that the melting temperatures of nanomaterials, such as nanoparticles, nanowires, and nanofilms, are size dependent and significantly deviate from their bulk values. Reference Buffat and Borel8–Reference Zhang and He10
Because only few research works on melting behaviors of copper nanofilms are available in the literature, several related research works are illustrated for ease of discussion. Yang and Wu Reference Yang and Wu11 studied the melting point, the melting mechanism, and the corresponding melting behavior of the Nb(110) nanofilm. They found that the melting point of the Nb(110) nanofilm is about 2568 K, which is much lower than that of 2740 K for the bulk niobium. Shi et al. Reference Shi, He, Kong, Lin and Hong12 investigated the melting process of Ag nanowires with and without Ni coating. They found that the Ag nanowires with Ni coating can be superheated depending on their radius and size because the epitaxial Ag/Ni interface can suppress the nucleation and growth of melt. Wang et al. Reference Wang, Rokhlin and Farson13 demonstrated the reversible inhomogeneous surface premelting of Au nanoparticles. It is noticed that liquid-like atoms first appeared at some vertices and edges of surface facets and then small liquid regions grew at temperatures close to the particle's melting temperature, with most of the remaining solid-like surface atoms residing on {111} planes, which are the most stable planes against surface premelting. Adnan and Sun Reference Adnan and Sun14 addressed the size-dependent melting behavior of Au nanofilms and observed that melting of the nanofilms is a progressive process from surface to interior, which results in a conclusion that melting of the Au nanofilms took place at a temperature range (from melting initiation to melting completion), instead of at a specific temperature.
Regarding the melting of copper nanofilms, Häkkinen and Manninen Reference Häkkinen and Manninen15 used molecular dynamics (MD) and effective-medium theory to study disordering and premelting of copper nanofilms with different surface orientations. Small simulation models with the number of atoms below 2300 were used in their study. They found that the order in surface thermostability follows the order in packing density of the nanofilm's surface. The determined melting point for bulk copper is about 1240 K, which is much lower than the experimental value of 1358 K for bulk copper. Reference Callister and Rethwisch16 Manai and Delogu Reference Manai and Delogu17 used MD simulations with semiempirical tight binding (TB) potential to investigate melting behaviors and melting mechanisms of bulk and nanometer-sized copper systems. The melting point determined for bulk crystalline copper is about 1550–1600 K, which is much higher than the experimental value for bulk copper. In addition, Sanchez and Mengüç Reference Sanchez and Mengüç18 used MD simulations combined with results from a Monte Carlo method to study melting and vaporization of Cu and Ni films during electron-beam heating. Phase change processes in those films during the electron-beam heating were examined in their study.
Although some efforts have been directed to the study of melting behavior of nanomaterials, it is still inconclusive at certain points. For example, some suggested that, unlike bulk solids, nanomaterials melt over a temperature range rather than at a specific point. Reference Adnan and Sun14 Yet, there is no systematic investigation on size and crystal orientation dependence of melting temperature and latent heat of fusion for copper nanofilms. To attain better designs and to explore potential applications for copper nanofilms, it is worthy to further understand these issues. For this purpose, this paper dealt with the influence of film thickness and surface orientation on melting behaviors of copper nanofilms. MD simulations combined with the embedded atom method (EAM) were used in this study. Melting of the copper nanofilms was monitored by examining the equilibrium potential energy of the simulation systems, as well as the variations in the radial distribution function and in the mean square displacement near the melting of the copper nanofilms.
II. METHODOLOGY
MD simulations were used to investigate the melting behavior of copper nanofilms. The parallel MD code, ParaDyn, developed in Sandia National Laboratory, was used for the simulation. The EAM potential, Reference Daw and Baskes19–Reference Daw, Foiles and Baskes21 which was applied successfully to predict crystalline configuration and physical properties of face-centered cubic (fcc) metals, e.g., copper, silver, and gold, was used to describe the interatomic interactions between copper atoms. In EAM potential, the total potential energy E tot of an N-atom system can be expressed as
 $${E_{{\rm{tot}}}} = \mathop\sum\limits_{i = {\rm{1}}}^N F {\rm{(}}{{\rm{\rho }}_i}{\rm{)}} + {{\rm{1}} \over {\rm{2}}}\mathop\sum\limits_{i = {\rm{1}}}^N {\mathop\sum\limits_{j \ne i}^N {V{\rm{(}}{r_{ij}}} } {\rm{)}}\quad {\rm{,}}$$
where F(ρ i ) is the embedding energy to embed atom i into the system; ρ i represents the electron density at atom i owing to all its neighbors; V(r ij ) is the pairwise potential between atoms i and j separated by a distance r ij . Functions F and V as well as the potential parameters used to describe interactions of copper atoms could be found in Refs. Reference Daw and Baskes19–Reference Daw, Foiles and Baskes21.
Several copper nanofilms having various film thicknesses and different surface orientations were investigated to examine the influence of film thickness and surface orientation on melting behaviors of the nanofilms. In the beginning, the nanofilm was modeled as a rectangular film with fcc configuration. Periodic boundary conditions were applied to the in-plane directions, namely, the x and y directions as shown in Fig. 1. Four values of film thickness (i.e., 25, 36, 54, and 90 Å) and three surface orientations were considered in this study. Table I lists the crystal orientations of the three types of nanofilms with the surface normal directed in z direction (namely, [001], [011], and [111], respectively). A schematic diagram for the nanofilm with the surface normal of [001] direction (Film 1) is shown in Fig. 1. The number of atoms used in the simulation model ranges from 6048 to 22,500. For comparison purposes, a cubic model with periodic boundary conditions in all the three directions was also simulated to investigate the melting behavior of the bulk crystalline copper.
Schematic diagram of the nanofilm with the surface normal of [0 0 1] direction (Film 1).

The crystal orientations of the three types of nanofilms.

The MD simulations were carried out at a constant temperature and zero pressure condition [namely, in isobaric-isothermal (NPT) ensembles]. In the simulations, Gear's fifth order predictor–corrector algorithm Reference Gear22,Reference Haile23 was used for the integration of the system's equations of motion with a time step of 1 fs (10−15 s). To simulate melting behaviors of the nanofilms and the bulk solid, the system's temperature was set to increase in an incremental stepwise manner from an initial temperature of 1000 K to a final designated temperature.
For the sake of simulation efficiency, a coarse temperature increment of 100 K was used initially and a finer temperature increment of 20 K was applied near the melting of the system. To obtain reliable melting behaviors, an equilibrium procedure was performed at each temperature step. For each temperature, the potential energy of the system at each time step was monitored and the equilibrium process would continue until the potential energy became stabilized with small fluctuations, within 1% deviation from the average value. The total simulation time would vary depending on the model size, ranging from 100 ps (10−12 s) to several nanoseconds. This procedure is to ascertain that the system’s equilibration had been achieved before further temperature increase of the system. Equilibrium data in the last 20 ps of each temperature step were averaged to provide the reliable melting behavior of the system.
III. RESULTS AND DISCUSSION
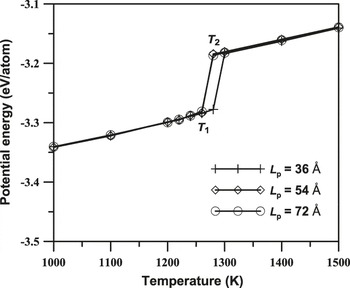
Influence of film thickness and surface orientation on melting behaviors of copper nanofilms was investigated. Since periodic boundary conditions were adopted in the in-plane directions of the model to simulate an infinite large nanofilm, an appropriate periodic length for the simulation model should be examined for the convergence before further investigating the melting behavior. The concern for the periodic length (L p) is that it should be large enough to have convergent and consistent melting behaviors of the nanofilms but not too large for the consideration of the computational efficiency. Figure 2 shows the variations in equilibrium potential energy during the incremental heating of Film 1, a film thickness of 36 Å, for various periodic lengths of 36, 54, and 72 Å, respectively. It was noticed that the potential energy curves for the three periodic lengths have a similar trend. The potential energy per atom increased gradually as the system’s temperature increased up to a particular point (denoted T 1 in Fig. 2), after which the potential energy began to rise sharply until a specific point T 2 (also shown in Fig. 2). Beyond T 2, the potential energy remains increasing gradually with the rising temperature. The increase of equilibrium potential energy with the system’s temperature implies the enlargement of the interatomic distance, which indicates a positive thermal expansion coefficient for the copper nanofilm. Besides that, the sudden jump in the potential energy (from temperature T 1 to T 2) indicates that there exists an abrupt increase in the interatomic distance. The abrupt increase in the potential energy and the interatomic distance is attributed to the adsorption of latent heat of fusion when the system’s temperature increases from T 1 to T 2. It was observed that a periodic length of 54 Å and beyond in the in-plane directions of the simulation model is sufficient to provide consistent melting behaviors of Film 1. As a result, the periodic length of 54 Å was used for Film 1 in the following studies. Similar convergence tests were also performed for Film 2, Film 3, and the bulk model.
Variations in equilibrium potential energy during the heating of Film 1 (film thickness of 36 Å) for the three periodic lengths. Temperatures T 1 and T 2 denote the premelting and melted temperature, respectively.

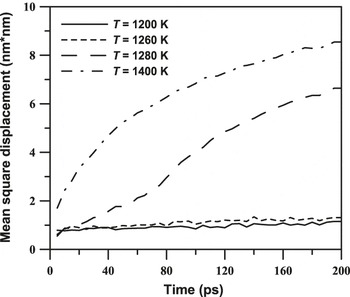
In addition to the equilibrium potential energy, both the radial distribution function Reference Haile23,Reference Rapaport24 and mean square displacement Reference Haile23 near the temperatures T 1 and T 2 were examined to make sure that the nanofilm transforms from a solid into a liquid phase. Figures 3 and 4 display the radial distribution function and mean square displacement of Film 1 with a film thickness of 36 Å and a periodic length of 54 Å at various temperatures. The temperatures T 1 and T 2 determined for this case are 1260 and 1280 K, respectively (referring to Fig. 2). The radial distribution function describes how density varies as a function of distance from a reference atom in a material, which can illustrate the structural arrangement of atoms. It is obvious that at 1280 and 1400 K, the atoms start to lose the long-range order. From Fig. 4, it was also noticed that the mean square displacement remained nearly constant at a temperature below T 1 (1260 K), which indicates that the atoms only vibrate at their equilibrium positions and thus, the nanofilm remained in solid phase. Above the temperature T 2 (1280 K), the value of mean square displacement increased with time, which implied that any small perturbation would cause the atoms to move constantly. Hence, the nanofilm transformed into fluid phase at temperatures above 1280 K. It is clear that melting of the nanofilms should occur between temperatures T 1 and T 2, denoted as the premelting temperature and melted temperature, respectively.
The radial distribution function of Film 1 (film thickness of 36 Å) at various temperatures.

The mean square displacement of Film 1 (film thickness of 36 Å) at various temperatures.

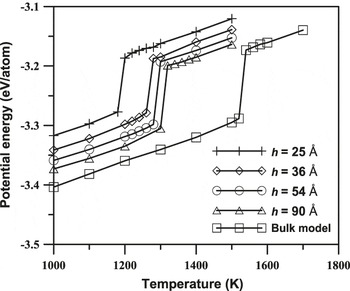
Influence of film thickness on melting behaviors of the copper nanofilms was examined. Figure 5 displays the variations in equilibrium potential energy of Film 1 during the stepwise heating of the simulated models with various thicknesses. For comparison purposes, the stepwise heating results of the bulk model, a side length of 54 Å, were also illustrated in the figure. It was noticed from Fig. 5 that both the premelting and the melted temperatures of Film 1 increase with the film thickness and approach the bulk values. The premelting temperature and the melted temperature for the bulk copper are 1520 and 1540 K, respectively, which are very close to the values (1550 and 1600 K) reported by Manai and Delogu Reference Manai and Delogu17 using TB potential.
Variations in equilibrium potential energy during the stepwise incremental heating of Film 1 for various film thicknesses.

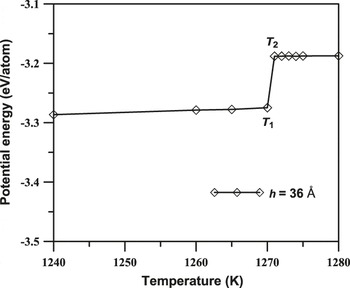
It should be noted that, for the sake of efficiency, a temperature increment of 20 K was used near the melting, which consequently restricted the premelting and melted temperatures with 20 K resolution. To resolve the question whether that the melting of nanofilms occurs at a specific temperature or within a temperature range, Reference Adnan and Sun14 a refined temperature increment between the premelting temperature (1260 K) and the melted temperature (1280 K) for Film 1, a film thickness of 36 Å, was adopted for further examination. Figure 6 shows variations in equilibrium potential energy of the nanofilm during refined heating. With further inspection of radial distribution function and mean square displacement, it was observed that the melting of the nanofilm occurred at some specific temperature between 1270 and 1271 K, with maximum 1 K error. Contrary to the progressive melting reported by Adnan and Sun, Reference Adnan and Sun14 a specific melting point within 1 K resolution for the nanofilm could be assured, which is similar to the melting of gold nanofilms observed by Sankarasubramanian and Kumar. Reference Sankarasubramanian and Kumar25 It is speculated that the continuous heating scheme with an extremely high heating rate of 10 K/ps, under which the nanofilms could not reach their equilibrium states before more energy pumping in, might be the reason for the contradictive melting behaviors.
Variations in equilibrium potential energy of Film 1 (film thickness of 36 Å) during the refined incremental heating near the melting.

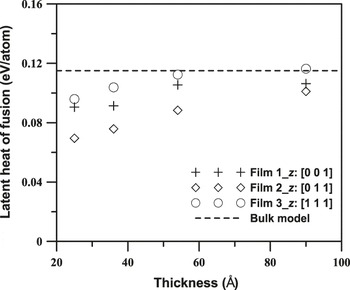
Nonetheless, for the sake of simulation efficiency, a temperature increment of 20 K was still used near the melting of the copper nanofilms in the following study. To investigate the influence of surface orientation on melting behaviors of copper nanofilms, two other nanofilms with the surface normal of [011] and [111] directions, respectively, were simulated and the variations in equilibrium potential energy during the stepwise incremental heating for various film thicknesses were shown in Figs. 7 and 8, respectively. It is observed that the premelting temperature, the melted temperature, and the latent heat of fusion increase with the film thickness, irrespective of the surface orientations. The premelting and melted temperatures (illustrated by 20 K error bars) and the latent heat of fusion of nanofilms for various film thicknesses with various surface orientations were collected in Figs. 9 and 10, respectively. The melting of the copper nanofilms occurred at a certain point inside the melting temperature range. Moreover, the bulk values were also marked for comparison. Both the melting temperature and latent heat of fusion approach their corresponding bulk values as the film becomes thicker irrespective of the surface orientations. However, the difference in the melting temperature between the thickest nanofilm and the bulk is not negligible. The difference does not seem to diminish even when a much thicker nanofilm was simulated. The difference is attributing to the surface effect since the surface atoms have higher energy than the interior atoms. Normally at melted temperature, melting initiates from the surface and penetrates inside the nanofilm while the temperature holds. It is also observed that the solid and liquid phases coexist in the nanofilm for some period of simulation time and eventually transform into a pure liquid state. However, the simulated bulk model does not have any surface and all the atoms are the interior ones, which is the constraint imposed by adopting the periodic boundary conditions. In the melting simulation of bulk copper, it is always observed that the atomic model immediately transforms into a liquid phase right after the temperature increasing to 1540 K. Hence, the simulated melting temperature of bulk model is actually the spinodal temperature, at which the solid phase ceases to be a local free-energy minimum and loses its mechanical stability. It is worth to point out that the spinodal temperature could not be identified as melted temperature of the bulk copper, at which the solid and liquid phases coexist. The spinodal temperature is much higher than the melted temperature and thus, the melting temperature determined either from the present study or the work of Manai and Delogu Reference Manai and Delogu17 is higher than the experimental melting point of 1358 K for bulk copper. Reference Callister and Rethwisch16 Moreover, the difference may also attribute to single-crystalline and perfect-structure models used in MD simulations while the bulk copper in the experiment is not as perfect. The melting temperature of bulk model could be determined by adopting the nonequilibrium simulation procedure on a solid and liquid coexisted system proposed by Celestini and Debierre Reference Celestini and Debierre26 .
Variations in equilibrium potential energy during the heating of Film 2 for various film thicknesses.

Variations in equilibrium potential energy during the heating of Film 3 for various film thicknesses.

The dependence of the premelting and melted temperatures on film thicknesses for the three types of nanofilms.

The dependence of latent heat of fusion on film thicknesses for the three types of nanofilms.

It was noticed that Film 3 (with the surface normal of [111] direction) has higher melted temperature and larger latent heat of fusion than the other two surface-orientated nanofilms of a similar thickness. This is because that the surface energy of Film 3 is the smallest among three surface-orientated nanofilms. The surface energy depends on the surface atom-packing density, and the atom planar density for the (001), (011), and (111) planes of a fcc crystal structure is
 ${\rm{2/}}{a^{\rm{2}}}$
,
 $\sqrt {\rm{2}} {\rm{/}}{a^{\rm{2}}}$
, and
 ${\rm{4}}\sqrt {\rm{3}} {\rm{/3}}{a^{\rm{2}}}$
(a: length of a unit cell in the structure), respectively. Hence, Film 3 has the closest packed surface among the three types of nanofilms examined and the highest melted temperature. The larger values of Film 3 could be ascribed to the least surface energy (and thus the lowest free energy) among the three types of nanofilms.
As the film thickness reduces, the ratio of the number of surface atoms (the atoms on the surface of the nanofilm) to the total number of atoms in the nanofilm increases. Reference Safaei, Shandiz, Sanjabi and Barber9,Reference Kulkarni and Zhou27 Since the surface atoms have greater energy than the interior atoms, a thinner nanofilm has higher free energy than a thicker nanofilm. This results in a lower melting point and a smaller latent heat of fusion for the thinner nanofilm. With the increase in the film thickness, the surface effects diminish and the bulk feature grows. Meanwhile, it was observed that the difference between the melted temperatures of Film 1 and Film 2 is not significant, which is similar to the observation of gold nanofilms. Reference Sankarasubramanian and Kumar25 It is our speculation that the surface energies of nanofilms also depend on the film thickness and the size dependence was not the same for various surface orientations. Hence, the dependence of the melted temperatures for Film 1 and Film 2 might not be simply explained by the surface energy comparisons of [001] and [011] planes.
In contrast, as can be seen from Fig. 10, the influence of surface orientation on latent heat of fusion of the copper nanofilms was found to be more evident as compared with those on the melted temperature. The closest packed nanofilm (Film 3) has the largest latent heat of fusion, whereas the loosest packed nanofilm (Film 2) has the smallest latent heat of fusion.
IV. CONCLUSIONS
Influence of film thickness and surface orientation on melting behaviors of copper nanofilms was investigated using MD simulations. The EAM interatomic potential and NPT ensembles were used in the simulations. An incremental stepwise heating scheme, instead of continuous heating, was used to make sure that the nanofilm reached thermal equilibrium before proceeding to the next temperature step. Due to the limitations on temperature increment resolution, two critical points, i.e., the premelting temperature and the melted temperature, were used to identify the melting of the copper nanofilms. Melting of the copper nanofilms was monitored by examining the equilibrium potential energy of the simulation system, the variations in the radial distribution function, and the mean square displacement near the melting.
From simulation results, it was found that the premelting temperature, the melted temperature, and the latent heat of fusion of the copper nanofilms decrease with reduction in the film thickness, irrespective of the surface orientations. Surface effects, which are significant in the scale of nanometer, are the main reason for the decreasing dependence. Moreover, the simulated melting temperature of bulk copper is much higher than the experimental value and is actually the spinodal temperature, at which the solid phase ceases to be a local free-energy minimum and loses its mechanical stability. The nanofilm with (111) plane surface was noticed to have the highest melted temperature and the largest latent heat of fusion, as compared with the other two surface-orientated nanofilms. This is because the (111) plane of a fcc crystal structure is the closest packed plane and possesses the lowest surface energy.
ACKNOWLEDGMENTS
The authors gratefully acknowledge the support provided to this research by the National Science Council of the Republic of China under Project Grant Nos. NSC 100-2221-E-006-060 and NSC 99-2923-E-006-006-MY3. The authors are also grateful to the Taiwan National Center of High-Performance Computing for providing computer time and facilities.