INTRODUCTION
Tropical intertidal habitats are diverse, complex and dynamic transitional ecosystems (Alongi, Reference Alongi1990). Traditionally, sewage disposal in the marine environment has been practiced globally (Ganesh et al., Reference Ganesh, Rakhesh, Raman, Nanduri, Moore and Rajanna2014). Increased nutrients, organic matter, sediments and pollutants are widespread evidence of coastal ecosystem deterioration, consequently causing detrimental effects on water and sediment quality as well as on the benthic community (Halpern et al., Reference Halpern, Walbridge, Selkoe, Kappel, Micheli, D'Agrosa, Bruno, Casey, Ebert and Fox2008; Ganesh et al., Reference Ganesh, Rakhesh, Raman, Nanduri, Moore and Rajanna2014). The ever-increasing human pressure on coastal and marine environments is likely to accelerate in tropical, developing South-east Asian countries including India, putting ecological and human health at significant risk (Islam & Tanaka, Reference Islam and Tanaka2004).
In view of aquatic environmental deterioration, several law enforcement agencies have synthesized protocols for monitoring, assessing and managing the ecological quality of water bodies (Van Hoey et al., Reference Van Hoey, Borja, Birchenough, Buhl-Mortensen, Fleischer, Kerckhof, Magni, Muxika, Reiss, Degraer, Schröder and Zettler2010; Rice et al., Reference Rice, Arvanitidis, Borja, Frid, Hiddink, Lorance, Ragnarsson, Sköld, Trabucco, Enserink, Norkko and Krause2012). The European Union Water Framework Directive (WFD, 2000/60/EC) and the Marine Strategy Framework Directive (MSFD, 2008/56/EC) are examples, which urge member states to achieve healthy and productive ecosystems of their transitional and coastal waters, and ensure sustainable utilization and maintenance of ecosystems into good ecological quality (GEQs; Borja & Tunberg, Reference Borja and Tunberg2011). Both of these directives consider sea-floor integrity as an indicator to describe the quality of the environmental status. This includes the functional components of the ecosystem (biological, physical and chemical) and the anthropogenic impact (Van Hoey et al., Reference Van Hoey, Borja, Birchenough, Buhl-Mortensen, Fleischer, Kerckhof, Magni, Muxika, Reiss, Degraer, Schröder and Zettler2010; Rice et al., Reference Rice, Arvanitidis, Borja, Frid, Hiddink, Lorance, Ragnarsson, Sköld, Trabucco, Enserink, Norkko and Krause2012).
The community level approach of macrobenthic attributes (species composition, abundance, biomass and ecological function), are regarded as valid diagnostic tools for benthic quality assessment (Reiss & Kröncke, Reference Reiss and Kröncke2005; Afli et al., Reference Afli, Ayari and Zaabi2008; Borja & Tunberg, Reference Borja and Tunberg2011; Sampaio et al., Reference Sampaio, Rodrigues and Quintino2011; Valença & Santos, Reference Valença and Santos2012; Cai et al., Reference Cai, Meng, Liu and Lin2014). Taking this biological element into account, several marine biotic indices have been developed in recent years (Birk et al., Reference Birk, Bonne, Borja, Brucet, Courrat, Poikane, Solimini, van de Bund, Zampoukas and Hering2012). The aim of all of these indices is to reduce the complex theoretical aspect of ecological conditions into a simple mathematical model. Therefore, index level approaches for evaluation of quality status become easier and more practical to exercise management decisions (Borja & Tunberg, Reference Borja and Tunberg2011; Riera & de-la-Ossa-Carretero, Reference Riera and de-la-Ossa-Carretero2014). Nevertheless, inconsistencies with physico-chemical proxies and incompatibility in lower latitudes and their regional specificity have been critically reviewed (Afli et al., Reference Afli, Ayari and Zaabi2008; Bigot et al., Reference Bigot, Grémare, Amouroux, Frouin, Maire and Gaertner2008; Sampaio et al., Reference Sampaio, Rodrigues and Quintino2011; Dauvin et al., Reference Dauvin, Alizier, Rolet, Bakalem, Bellan, Gomez Gesteira, Grimes, de-la-Ossa-Carretero and Del-Pilar-Ruso2012; Valença & Santos, Reference Valença and Santos2012; Chan et al., Reference Chan, Xu, Liu, Cheung and Shin2015). Therefore, none of the existing indices represent discrete measures of biological responses (Afli et al., Reference Afli, Ayari and Zaabi2008; Birk et al., Reference Birk, Bonne, Borja, Brucet, Courrat, Poikane, Solimini, van de Bund, Zampoukas and Hering2012). Hence the combination of indices based on different ecological principles seems inevitable and has been strongly suggested by numerous authors (Salas et al., Reference Salas, Marcos, Neto, Patíciob, Pérez-Rizafa and Marques2006; Afli et al., Reference Afli, Ayari and Zaabi2008; Cai et al., Reference Cai, Meng, Liu and Lin2014; Sivadas et al., Reference Sivadas, Nagesh, Gupta, Gaonkar, Mukherjee, Ramteke and Ingole2016).
Andaman and Nicobar (A&N) is a union territory of India and its state affairs come under the country's jurisdiction. It constitutes a pristine, dynamic, diverse, productive and inherently sensitive Islands ecosystem, located between 6–14°N and 92–94°E in the northern part of the Indian Ocean. The union territory stretches 800 km in a north–south direction and covers 59.7 × 10⁴ sq. km of territorial waters. Its long shoreline (1962 km) includes a variety of coastal wetland habitats (1.078 km2 Singh, Reference Singh2003). Port Blair (11°41′–11°38′N 92°45′–92°42′E) is the capital city of the island's archipelago, situated in the South Andaman group of islands (third largest island). About 62% of the total human population of the A&N Islands (population ~380,000) is settled in the South Andaman group of islands (Census 2011 A&N Administration), ~56% of which is an urban population congregated within the city's limits. As in other parts of the tropics, human population, tourism, recreation, sewage and land reclamation have introduced moderate amounts of organic matter and sewage associated pollutants into Port Blair's coastal waters (Sahu et al., Reference Sahu, Begum, Khadanga, Jha, Vinithkumar and Kirubagaran2013; Narale & Anil, Reference Narale and Anil2017). According to Islam & Tanaka (Reference Islam and Tanaka2004), annual urban and domestic sewage production of a given population can be estimated. It can be as high as 8.55 × 10¹⁰ m3 of the sewage with 1.71 × 10⁹ kg of organic matter (1 l of sewage containing 20 mg of OM) discharged directly into the coastal marine environment. Major sources of benthic disturbances identified include sewage discharge from households, urban, hotels and resorts, dumping and shipping activities, all posing stress on the coastal habitats. As a result, socio-economic services, environmental quality as well as the human well-being of Port Blair coasts are systematically declining.
Despite their socio-economic and ecological importance, tropical intertidal habitats have not been given due attention (Froján et al., Reference Froján, Kendall, Paterson, Hawkins, Nimsantijaroen and Aryuthaka2009). There have been no studies to assess the coastal quality status of the Port Blair coast conducted to date. Furthermore, it is not clearly understood whether the physiological responses of tropical benthos in the face of organic enrichment are similar to those observed for the benthos of temperate latitudes (Bigot et al., Reference Bigot, Grémare, Amouroux, Frouin, Maire and Gaertner2008; Ansari et al., Reference Ansari, Ingole and Abidi2014; Ganesh et al., Reference Ganesh, Rakhesh, Raman, Nanduri, Moore and Rajanna2014). Several studies have reported the application, testing and calibration of temperate biotic indices in tropical and sub-tropical shallow, estuarine and bay regions (Afli et al., Reference Afli, Ayari and Zaabi2008; Bigot et al., Reference Bigot, Grémare, Amouroux, Frouin, Maire and Gaertner2008; Valença & Santos, Reference Valença and Santos2012; Cai et al., Reference Cai, Meng, Liu and Lin2014; Ganesh et al., Reference Ganesh, Rakhesh, Raman, Nanduri, Moore and Rajanna2014; Chan et al., Reference Chan, Xu, Liu, Cheung and Shin2015; Sigamani et al., Reference Sigamani, Perumal, Arumugam, Jose and Veeraiyan2015; Sivadas et al., Reference Sivadas, Nagesh, Gupta, Gaonkar, Mukherjee, Ramteke and Ingole2016). However, only a few studies represent intertidal habitats assessed globally. For example, the following authors used a combination of benthic indices and tested their sensitivity and suitability on soft bottom intertidal habitats (Cai et al., Reference Cai, Tam, Wong, Ma, Gao and Wong2003; Blanchet et al., Reference Blanchet, Lavesque, Ruellet, Dauvin, Sauriau, Desroy, Desclaux, Leconte, Bachelet, Janson, Bessineton, Duhamel, Jourde, Mayot, Simon and de Montaudouin2008; Omena et al., Reference Omena, Lavrado, Paranhos and Silva2012; Daief et al., Reference Daief, Borja, Joulami, Azzi, Fahde and Bazairi2014; Brauko et al., Reference Brauko, Muniz, Castro and Lana2016; Song et al., Reference Song, Zou, Zhang, Yu, Zang and Wang2016).
The primary aim of the current study was to evaluate the benthic quality status of three sheltered, spatially distant and variously disturbed intertidal habitats. Simple and traditional univariate and benthic biotic indices were used to assess the coastal quality status. The efficiency of temperate benthic indices were tested against the background of mild organic enrichment during the stable dry period for tropical intertidal habitats.
MATERIALS AND METHODS
Study area
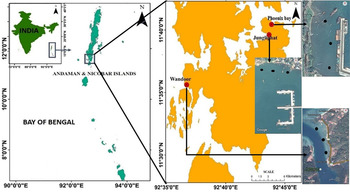
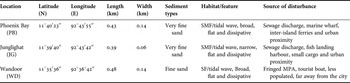
The study was conducted in Port Blair Bay, an environment subjected to intense harbour activities (marine wharf, Indian naval base and floating dockyard). Two sampling locations, Phoenix Bay (PB) and Junglighat (JG), were situated in the bay region. PB is sheltered with jetties and piers, situated in the outer bay region (Figure 1 & Table 1), an area, which receives large amounts of urban and domestic sewage of high organic loads and nutrients. Inter-island ferries operate and boat repairs/dry docking activities take place. The JG is situated in the inner bay region, detrimental effects come from fish landings (supplying more than 50% of the local fish demand), fish discards and direct discharge of domestic sewage. Wandoor (WD), located 18 km from the city, is in the fringe area adjacent to Mahatma Gandhi Marine National Park (MGMNP; area 281.5 km2). This location, facing towards the Bay of Bengal on the west coast of the South Andaman Island, is relatively undisturbed and supports a healthy coral reef.
Map showing the sampling sites of urban proximity (Phoenix Bay and Junglighat) and reference (Wandoor – Marine Protected area) locations of the Port Blair coast.

Details of sampling locations, habitat characteristics and human pressure.

SMF, sandy-mud flat; SF, sand flat.
Environmental regime
Overall annual mean temperature for the region is 28°C. The relative humidity of ambient air in the region reaches ~80% (Sahu et al., Reference Sahu, Begum, Khadanga, Jha, Vinithkumar and Kirubagaran2013). The island's geographic position falls under the ITCZ (Inter-Tropical Convergence Zone), in association with the dominant monsoonal wind pattern in the Indian Ocean, the region receives copious rainfall. 3000 mm mean annual rainfall has been recorded (Sahu et al., Reference Sahu, Begum, Khadanga, Jha, Vinithkumar and Kirubagaran2013). Climate is typically tropical and can be summarized into two distinct seasons; the wet season (south-west monsoon – heavy rainfall during late May to early October with strong winds, cyclones and high wave action/water turbulence) and the dry season (north-east monsoon – November to April with a faint spell of rainfall during November–December and limited wind, reduced intensity of wave action/relatively calm) (IMD, Port Blair, Sahu et al., Reference Sahu, Begum, Khadanga, Jha, Vinithkumar and Kirubagaran2013). The semidiurnal tidal amplitude ranges from 0.035 to 2.47 m with a mean of 1.21 m.
Selecting the reference condition
Reference conditions are described by a high biological quality element and are the basis for classifying the ecological quality status (Muxika et al., Reference Muxika, Borja and Bald2007; Basset et al., Reference Basset, Barbone, Borja, Elliott, Jona-Lasinio, Marques, Mazik, Muxika, Neto, Reizopoulou, Rosati and Teixeira2013). For an effective assessment, the appropriate selection of a reference condition is crucial. The WFD offers four criteria to select reference conditions: (1) sites with no or minor disturbance; (2) historical data representing formerly undisturbed or less disturbed sites; (3) applying modelling techniques to predict reference conditions; (4) using expert judgement (Basset et al., Reference Basset, Barbone, Borja, Elliott, Jona-Lasinio, Marques, Mazik, Muxika, Neto, Reizopoulou, Rosati and Teixeira2013). The WFD also recommends the definition of the reference state to be expressed as an Ecological Quality Ratio (EQR) of the considered parameters or index values between the monitored and reference site (Bigot et al., Reference Bigot, Grémare, Amouroux, Frouin, Maire and Gaertner2008; Gillett et al., Reference Gillett, Weisberg, Grayson, Hamilton, Hansen, Leppo, Pelletier, Borja, Cadien, Dauer, Diaz, Dutch, Hyland, Kellogg, Larsen, Levinton, Llansó, Lovell, Montagna, Pasko, Phillips, Rakocinski, Ranasinghe, Sanger, Teixeira, Van Dolah, Velarde and Welch2015). EQRs can be transferred into EcoQ (ecological quality) through scaling from 0 representing bad, to 1 representing high. High EQRs were obtained for the physico-chemical conditions as well as index values at Wandoor, thus providing reference conditions as per the first criterion of the WFD (no or minor disturbance).
Environmental parameters
Temperature, salinity, dissolved oxygen (DO) and pH were measured from adjacent surface waters. Temperature was measured using a 0–50°C high precision N2 filled thermometer. Salinity was determined by refractometer (ATAGO-0109540) whereas DO, water pH and sediment pH were measured by Winkler titration method, pH meter (Esico-1010) and soil tester (DM-13; Takemura Inc.) respectively. In addition, a 200 g sediment core sample (2.5 cm internal diameter and 10 cm depth) was collected at each sampling site, dried at 60°C for 48 h and kept for sediment textural and organic matter content analysis. Total organic carbon (TOC) content in the sediment was estimated using the Walkley–Black wet oxidation method (Gaudette et al., Reference Gaudette, Wilson, Toner and Folger1974). Total organic matter (OM) values were obtained by multiplying the TOC by a factor of 1.724 (Trask, Reference Trask1939). Sediment texture (% sand, silt and clay via pipette analysis) and grain size (using a mechanical tap shaker) were analysed according to the standard procedure (Buchanan, Reference Buchanan, Holme and McIntyre1984) and expressed at Wentworth scale.
Benthic sampling
Based on the Pearson & Rosenberg (Reference Pearson and Rosenberg1978) model of macrobenthic secondary succession, quantitative benthic samplings were carried out at three locations during the dry period (January, February and March) for 3 years (2014, 2015 and 2016). Quadrats (25 × 25 cm; 15–20 cm depth) were used along the intertidal saturation zone of low water line (Daief et al., Reference Daief, Borja, Joulami, Azzi, Fahde and Bazairi2014). Three replicates (1 m apart in a triangular fashion) were collected at three sites (situated ~50 m distance) at each sampling location during the spring low tide ebb. In total, 243 samples were collected during the entire study period i.e. 27 samples from each study location each year (3 replicates × 3 sites × 3 locations × 3 months × 3 years). Samples were sieved in the field through a 0.5 mm mesh and fixed in a 5% buffered formaldehyde rose Bengal mixed solution. In the laboratory animals were sorted, counted and estimates of abundance (ind. m−2) and wet weight biomass (paper blotted WWT g m−2) were made for each sample. WWT biomass was measured with an electronic balance of three decimals accuracy. The majority of faunal taxa were identified to genus level and further divided into five ecological groups according to their ecological responses (sensitive, indifferent, resistant or tolerant, second order opportunistic and first order opportunistic) by following the AMBI V.5 Nov2014 taxa list (http://ambi.azti.es).
Indices used for habitat quality assessment
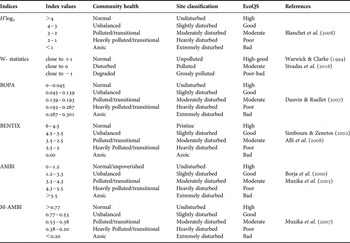
Univariate measures N (ind. m−2), species richness (S), Margalef's d′, Shannon–Wiener diversity (H′log2), evenness (j′), dominance (D′) and modified Hulbert index (ES50) of Sanders' (Reference Sanders1968) rarefaction technique were applied. Hulbert index, which is less sample size dependent, was calculated by extrapolating the species accumulation within the fixed number of individuals (Ganesh et al., Reference Ganesh, Rakhesh, Raman, Nanduri, Moore and Rajanna2014; Sivadas et al., Reference Sivadas, Nagesh, Gupta, Gaonkar, Mukherjee, Ramteke and Ingole2016). Shannon–Wiener H′log2 was used for the assessment and classification of ecological quality into five EcoQS (Table 2).
Summary of threshold values used to evaluate the ecological quality status in present study.

The W-statistic (Warwick & Clarke, Reference Warwick and Clarke1994) was applied, derived from the sample based ABC (Abundance/Biomass) curve proposed by Warwick (Reference Warwick1986) and reinforced by Dauer et al. (Reference Dauer, Luckenbach and Rodi1993). Based on abundance and biomass curve position, three stressed statuses of benthic community could be inferred in accordance with W-statistic score ranges between −1 to +1. Values close to +1 represent unpolluted/un-stressed communities, close to or equal to 0 polluted/stressed, and close to −1 grossly polluted/stressed (Sigamani et al., Reference Sigamani, Perumal, Arumugam, Jose and Veeraiyan2015; Sivadas et al., Reference Sivadas, Nagesh, Gupta, Gaonkar, Mukherjee, Ramteke and Ingole2016).
Most indices are based on the classical Pearson & Rosenberg model (Reference Pearson and Rosenberg1978) of secondary succession of benthic communities in a stressed environment. Demonstration of low diversity, dominance of tolerant and decimation of sensitive species (Bigot et al., Reference Bigot, Grémare, Amouroux, Frouin, Maire and Gaertner2008) led the paradigm shift to put forward the assumption regarding different adaptive strategies (k-strategist/conservative, r-strategist/opportunistic and T-strategist/tolerant) of macrobenthic communities in stressed environments (Warwick, Reference Warwick1986; Dauer et al., Reference Dauer, Luckenbach and Rodi1993; Borja et al., Reference Borja, Franco and Pérez2000). Five ecological groups (EGs) were established based on their sensitivity to a stress gradient caused by organic matter enrichment (OME; Grall & Glémarec, Reference Grall and Glémarec1997): EGI – species very sensitive to OME and present under unpolluted conditions; EGII – indifferent to enrichment, always in low density; EGIII – tolerant to excess OME, stimulated in slightly unbalanced situations; EGIV – second-order opportunistic species, small-sized polychaetes, subsurface deposit feeders, abundant in unbalanced situations; and EGV – first-order opportunistic species, deposit feeders and proliferate in reduced sediments. The BOPA (Benthic Opportunistic Polychaetes Amphipods ratio) index is based on relative frequencies (0; 1) of opportunistic polychaetes and sensitive amphipods (except Jassa sp.) and is calculated by using the equation BOPA = log [(f P/f A + 1) + 1] (Dauvin & Ruellet, Reference Dauvin and Ruellet2007). BOPA scores define five ecological qualities (as per the WFD directives) and range between 0 (ƒP = 0) for high and 0.3 (log2; ƒA = 0) for bad status. In this study opportunistic polychaetes were assigned as either EGIV and EGV, and sensitive amphipods as EGI from the AMBI taxa list. AMBI (AZTI Marine Biotic Index) was calculated for each sample with the formula AMBI = [(0 × %EGI) + (1.5 × %EGII) + (3 × %EGIII) + (4.5 × %EGIV) + (6 × %EGV)]/100 proposed by Borja et al. (Reference Borja, Franco and Pérez2000). AMBI qualifies five quality statuses on a scale of 0 to 7 from high to bad. Assigning species to their respective EGs can be particularly difficult, especially in the tropics and sub-tropics where information regarding ecological attributes or responses of macrobenthic community are still lacking (Bigot et al., Reference Bigot, Grémare, Amouroux, Frouin, Maire and Gaertner2008; Valença & Santos, Reference Valença and Santos2012; Ganesh et al., Reference Ganesh, Rakhesh, Raman, Nanduri, Moore and Rajanna2014). In the current study, taxa were assigned to their EGs by following the AMBI V.5 Nov2014 taxa list. Taxa not resolved to species level were assigned to closely related species and mostly to genus level. Taxa not in accordance with the AMBI list were re-assigned by seeking expert advice (A. Borja, S.K. Sivadas, personal communication). A maximum of 2–8% of the taxa could not be assigned to any EG, which contributed to <1% of the total faunal abundance. BENTIX (Benthic Index) adopts a similar procedure as AMBI but reduces the EGs into three classes (Simboura & Zenetos, Reference Simboura and Zenetos2002). EGI, EGII and EGIII of BENTIX were adopted here by following Blanchet et al. (Reference Blanchet, Lavesque, Ruellet, Dauvin, Sauriau, Desroy, Desclaux, Leconte, Bachelet, Janson, Bessineton, Duhamel, Jourde, Mayot, Simon and de Montaudouin2008) as EGI of AMBI as EGI, EGII and III of AMBI as EGII, and EGIV and V of AMBI as EGIII of BENTIX. BENTIX was calculated manually using the formula BENTIX = [6 × %EGI + 2(%EGII + %EGIII)]/100 for each of the replicates. M-AMBI (Multivariate AMBI) is the multi-factorial analysis of species richness, Shannon–Wiener H′log2 and AMBI scores (Muxika et al., Reference Muxika, Borja and Bald2007). Since EQRs were highest at the reference location (Wandoor), M-AMBI was calculated as the default set up. For bad status S = 0, H′log2 = 0 and AMBI = 6, and for high status, the highest S, H′log2 and lowest AMBI were considered from the dataset. The default boundaries were set as high/good 0.77, good/moderate 0.53, moderate/poor 0.38 and poor/bad 0.20.
Data treatment and statistical analysis
Eighty-one mean biological samples were used for benthic habitat quality assessment. Before mean replicates were taken, samples consisting of only 1–3 taxa, or fewer than three individuals were removed (2% of all replicates) following Borja & Muxika (Reference Borja and Muxika2005) and Cai et al. (Reference Cai, Meng, Liu and Lin2014). Species richness (S), Shannon–Wiener diversity index (H′log2), AMBI and M-AMBI were calculated by using AMBI v.5 software package (downloaded on 17.11.2015, http://www.azti.es) while BOPA and BENTIX were calculated manually for each replicate. Margalef diversity index (d′), Hulbert index (ES50), equitability J′ (evenness), Simpson dominance D′ and W-statistics (Abundance-Biomass curve; ABC) were calculated using PRIMER v. 6.1.10 (Clarke & Gorley, Reference Clarke and Gorley2006). Sediment grain size (GS) was estimated by GRADISTAT excel v. 15.0 (Blott & Pye, Reference Blott and Pye2001). The differences of benthic indices (H′log2, BOPA, BENTIX, AMBI and M-AMBI) between locations were tested by Kruskal–Wallis one-way ANOVA, whereas temporal differences within the same location were analysed by the pairwise Mann–Whitney U test. Differences were considered significant at P < 0.05. Canonical Correspondence Analysis (CCA) triplot ordination was used to explain the relationship between the environmental parameters and biological variance, and the biotic indices as supplementary variables to show their influence on the observed ordination using CANOCO version 4.5. (ter Braak, Reference ter Braak1986; Leps & Smilauer, Reference Leps and Smilauer2003).
RESULTS
Environment variables and sediment characteristics
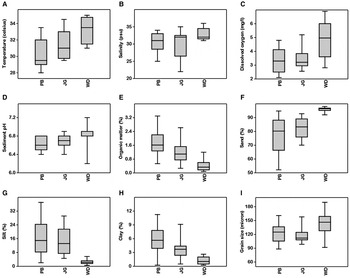
Overall mean surface water temperature (31.4 ± 1.6), salinity (31.1 ± 3.2) and dissolved oxygen (3.9 ± 1.2) were observed to be high at the reference location (WD), where DO reached a maximum of 6.9 mg l−1. Conversely, a three-fold, high sediment OM (mean %OM 1.1 ± 0.8) was recorded proximal to the urban locations (PB & JG) than the reference site (WD), and varied by a maximum of 3.3%. OM decreased from January to March each year and at each sampling location. Though the highest values of % sand and mean grain size were recorded at WD, the sand fraction (78–95%) was the predominant textural class at all the three locations. Box-whisker plots showing spatial variations in environmental parameters are shown in Figure 2.
Box-whisker plot for environmental parameters during 2014–2016 in dry period (January–March). (A) surface water temperature, (B) salinity, (C) dissolved oxygen, (D) sediment pH, (E) organic matter, (F) sand, (G) silt, (H) clay and (I) mean grain size. Median (horizontal line), 25–75% quartile deviation (box) and Range (whisker). PB, Phoenix Bay; JG, Junglighat; and WD, Wandoor.

Community structure and ecological groups (EGs)
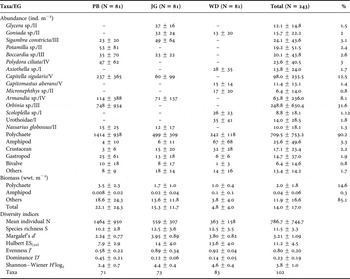
A total of 102 taxa representing six different phyla (Annelida, Crustacea, Mollusca, Echinodermata, Sipuncula and Nemertea) were recorded in 243 replicate samples. Polychaetes were the most abundant (90%) and diverse (61 taxa) group followed by crustaceans (5.5%), molluscs (2.7%) and others (Echinodermata, Sipuncula and Nemertea, contributing 1.7% of total faunal abundance). Bray–Curtis similarity matrix constructed from square-root transformed faunal abundance data, and cluster analysis showed three distinct assemblages at 40% similarity, which was also confirmed on an nMDS ordination (N = 9; 2D stress: 0.11; figures not shown).
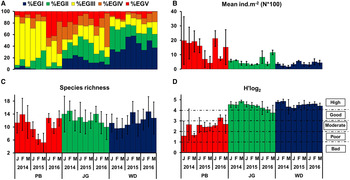
EGI and II represented 60% of the total taxa. In spite of a diverse representation of EGI and II, their density contributed to a maximum of only 6.5% of total faunal abundance, mostly by sensitive Urothoidae (amphipods) Axiothella sp., Scoloplella sp. and Micronephthys sp. at WD. The highest faunal abundance was shown by EGIII (43.2%), followed by EGIV (16%), EGV (14.5%), EGII (14%) and EGI (11.5%) (Figure 3A). Mean abundance (748 ± 934 ind. m−2) of Orbinia sp. was observed to be highest in 2014 (1382 ind. m−2) and decreased exponentially from 2015 (508 ind. m−2) to 2016 (261 ind. m−2) at PB. A high density of Capitella singularis was observed during January 2016 proximal to urban locations (PB 931 ind. m−2; JG 173 ind. m−2) while Armandia sp. was observed at PB (727 ind. m−2) and JG (394 ind. m−2) in March 2016. Other dominant groups were Sigambra constricta (EGIII), Boccardia sp. (EGIII) and Polydora ciliata (EGIV) at both of the disturbed sites (Table 3).
Temporal and spatial variations of the benthic macrofauna. (A) ecological groups (EGI EGII EGIII EGIV EGV), (B) mean individuals abundance m−2, (C) species richness and (D) Shannon-Wiener diversity H′log2 (mean ± SD).

Summarized information on dominant taxa (contributing >10 ind. m−2 or 0.5% of the total population) and diversity indices at each location.

EG, Ecological group; N, number of samples; wwt, wet weight biomass in grams; Mean ± SD, mean ± standard deviation.
Biotic indices and ecological quality status (EcoQS)
UNIVARIATE INDICES
Overall faunal mean abundance N (786 ± 744 ind. m−2) ranged between 96 and 3824 ind. m−2. A large difference in abundance was observed and recorded in order of 2.5:1.5:1.0 at PB, JG and WD respectively (Figure 3B). Species richness S, Margalef's diversity d′ and Hulbert Index (ES50) followed the reverse trend to that of abundance, in the order PB < WD < JG (Figure 3C). Evenness was recorded as high at WD, while as expected, a high dominance was observed at PB (Table 3). Shannon diversity was recorded as equally high (4.6 and 4.4) at WD and JG (Figure 3D). H′log2 classified the entire datasets (N = 81) into five ecological quality categories: high (26%), good (44%), moderate (13%) and poor classes (16%). The majority of samples from WD and JG fell into the high and good quality statuses (high 33 & 44% and good 63 & 51%). However, moderate (31%), poor (50%) and bad (4%) statuses were assigned to the majority of the samples from PB. Significant differences of H′log2 were observed between the PB vs WD and PB vs JG (Kruskal–Wallis test P < 0.001), whereas the difference between JG vs WD was not significant (P > 0.05).
ABUNDANCE-BIOMASS PATTERN AND W-STATISTICS
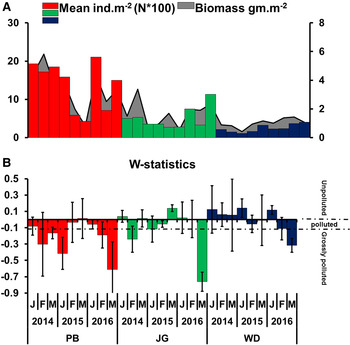
The mean polychaete abundance distribution was above that of the biomass curve at both impacted sites (PB & JG), and was apparent during 2016 (Figure 4A). On the following scale, where equal or above 0 = unpolluted, between 0 to −0.1 = polluted, and lower than −0.1 = grossly polluted, W scores classified the majority of the samples within grossly polluted (44%). Sixty-nine per cent of samples from PB were classified as grossly polluted, whereas 56 and 41% samples from WD and JG were classified as unpolluted respectively. In general, at JG and WD, W-statistic scored above zero in half of the samples (Figure 4B).
Temporal and spatial variations. (A) polychaete mean abundance (primary axis) and wet weight biomass (secondary axis). (B) evaluation of benthic condition scaled by W-statistics scores (mean ± SD).

BIOTIC INDICES BASED ON ECOLOGICAL ATTRIBUTES
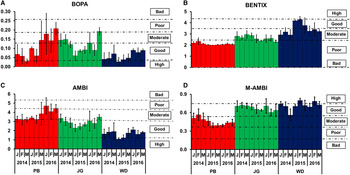
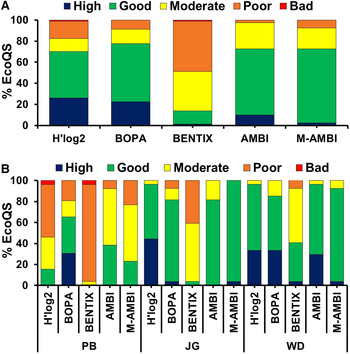
The contribution of opportunistic polychaetes (ƒP) to the total benthic population varied significantly between locations (PB, 28%, JG 42% and WD 15%). Faunal abundance at PB was mostly contributed by species belonging to EGIII (Orbinia sp.), while abundance of sensitive amphipods (ƒA) were found to be higher at WD (17%). A high value of BOPA was observed at JG, and low from WD (Figure 5A). Overall BOPA classified all benthic samples into four classes: high (22%), good (55%), moderate (14%) and poor (9%). Significant differences of BOPA scores were observed between JG vs WD (Kruskal–Wallis test P < 0.001). Mann–Whitney pairwise U test showed mixed trend of BOPA scores between the sampling years of each location (Monte Carlo P < 0.05). BENTIX described the majority of samples as poor status, mostly from PB and JG, varying between 2.0 at PB to 5.0 at WD. BENTIX is known for its severe treatment and was observed at WD where index scores evaluated the majority of samples as having moderate (52%) to poor statuses (11%). Overall BENTIX qualified PB as having a poor status, JG as moderate and WD as good status (Figure 5B). Significant differences were observed between all locations (P < 0.01). A wide range of values were obtained for AMBI, ranging between 0.37 at PB and 5.62 at WD. The AMBI index classified all samples into four categories between high and poor quality status. The majority of samples were classified in good (62.5%) and moderate (25%) categories. PB samples were classified into three categories: good (38%), moderate (54%) and poor quality status (8%). JG into two categories of good (81%) and moderate status (19%), and WD were classified into three categories of high (30%), good (67%) and moderate (3%) quality status. Moderate-poor quality status at PB and good-moderate status at JG were mostly represented by samples collected in March throughout the sampling regime (Figure 5C). Significant spatial differences of AMBI values were observed between PB vs WD and JG vs WD (P < 0.001). M-AMBI analysis classified the samples (N = 81) into four categories (Figure 5D). About 70% of samples were identified as good status and 20% as moderate status. PB was identified as ecologically deprived at all stations (moderate 54% and poor 23%), while compared to the reference location WD (high 11%, good 85% and moderate 4%) JG was classified as having a good status (high 4% and good 96%). M-AMBI qualified the PB into moderate, JG into good and WD into good-high quality status as expected. Except JG vs WD, differences were highly significant (Kruskal–Wallis P < 0.000) while inter-annual differential comparisons were significant between 2014 vs 2015 and 2016 at PB (Monte Carlo P = 0.02, 0.01) and no differences were observed in JG and WD. M-AMBI remained consistent throughout the study period.
Temporal and spatial distribution of ecological quality status scaled by complementary indices. (A) BOPA, (B) BENTIX, (C) AMBI and (D) M-AMBI scores (mean ± SD).

BIOTIC AND ABIOTIC RELATIONSHIP
Non-parametric Spearman rank order correlation test was performed between sediment OM and community descriptors (N, S, d′, D′, ES50 and species density) along with synthetic biotic indices (H′log2, BOPA, BNETIX, AMBI and M-AMBI). Except species richness, the correlation coefficients of all community measures were significant at P < 0.05. Orbinia sp., C. singularis and P. ciliata expressed strong correlation with OM (P < 0.001) while Axiothella sp., Scoloplella sp., Urothoidae and Hayalidae showed strong negative correlations (P < 0.001). AMBI showed high correlation (r = 0.527, P = 0.000) with OM while H′log2, BENTIX and M-AMBI exhibited strong negative correlations (P < 0.001), while BOPA did not show any correlation.
Numerically important taxa were identified for each location using SIMPER routine. Orbinia sp., C. singularis, Potamilla sp. and Armandia sp. were dominant groups (cumulative cut-off 50%) at PB (average similarity 63.3%). Sigambra constricta, C. singularis, Goniada sp., Glycera sp., Armandia sp., Nephthys macroura, Decamastus sp. and Boccardia sp. were major contributing species at JG (av. sim. 65%) and WD (av. sim. 53%) was represented by Scoloplella sp., Urothoidae, Capitomastus aberans, Goniada sp., Axiothella sp., Micronephthys sp., Hyalidae and Sipuncula.
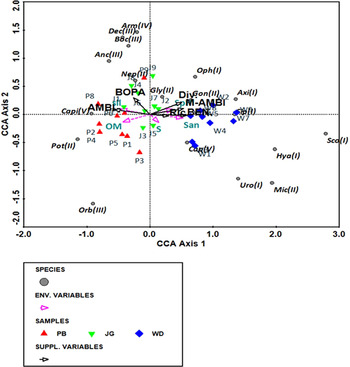
For the CCA analysis, the Monte Carlo test was run to identify significant environmental variables influencing the observed variability. Sand, sediment pH, salinity, OM and silt were identified as important variance descriptors (least F = 2.03, P = 0.03 for silt). Fifty-three per cent of biological and synthetic index variability were explained at the first four axes by these parameters. The first and the second canonical axes explained together up to 79.6% of the total variance (56.1 and 23.5%). Samples were equally distributed along both first and second axes and no environmental variables played an important role in samples dispersion. Samples from impacted (PB) and non-impacted (WD) sites were grouped in opposite directions along the first axis (Figure 6), while samples from JG remained intermediate in both domains. OM and silt content chiefly explained urban proximity areas (PB & JG) that were related to moderate to bad quality assigned by high AMBI and BOPA scores. OM showed an inverse relation with Shannon diversity index, M-AMBI, BENTIX, species richness, sand and sediment pH which all together explained much of the variability at the reference location WD. Species belonging to the sensitive group were present at the reference site. BOPA and AMBI were mostly defined by presence of total OM and silt, while H′log2, species richness, BENTIX and M-AMBI showed consistency with surface water salinity, sediment pH and sand proportion.
CCA plot of scaling type 1 between the dominant species, significant environmental variables (using Monte-Carlo test) and biotic indices as supplementary variables. The angles between variables reflect their correlations (angle near 90 indicates no correlation, near 0 indicates high correlation and near 180 indicates high negative correlation).

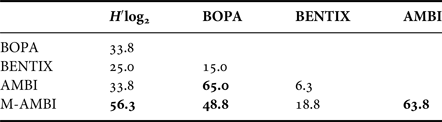
Degrees of similarity or agreement between the indices were low (Figure 7A, B). For the same ecological quality status only 5% of samples were in agreement for all of the indices for the entire dataset. Highest agreement was observed between AMBI and BOPA (65%) followed by AMBI and M-AMBI (63.8%) and M-AMBI and H′log2 (56.3%). Major agreement between the indices was observed for good to moderate status. For the high quality status, almost all indices disagreed (Table 4). However, all the indices unanimously justified the high to good quality status of reference condition.
Performances of five benthic biotic indices (in percentage) for assigning the health quality. (A) Samples (N = 81) of all three locations and (B) location-wise PB (N = 27), JG (N = 27) and WD (N = 27). Colour scheme after Dauvin et al. (Reference Dauvin, Alizier, Rolet, Bakalem, Bellan, Gomez Gesteira, Grimes, de-la-Ossa-Carretero and Del-Pilar-Ruso2012).

Degree of similarity/agreement between the indices used for the same ecological quality status by each pair of indices.

≈ 50% or above degree of similarity marked in bold.
DISCUSSION
The objective of the present study was to assess the benthic quality status of the Port Blair coast in variously disturbed intertidal habitats. Laterally, performances of indices were also tested against mild organic enrichment, urban proximity gradient, absence of natural disturbances and by setting natural reference condition.
The bay environment, benthic community and assignment of ecological groups (EGs)
The dry season at tropical latitudes is characterized by relative calm, less turbulence, high salinity, temperature and pH compared with the wet season (south-west monsoon) (Alongi, Reference Alongi1990). The monsoon mediated land-based runoff accumulates high nutrients and organic matter in the Port Blair Bay system. Subsequently, nutrient enrichment triggers a high rate of phytoplankton production (Narale & Anil, Reference Narale and Anil2017). Oxidative degradation of organic products consequently results in anaerobic bacterial degradation, which causes a reduced environment. As a result, the system suffers a high biological oxygen demand, reduction in dissolved oxygen concentration and lowering of water pH (Sahu et al., Reference Sahu, Begum, Khadanga, Jha, Vinithkumar and Kirubagaran2013). Sahu et al. (Reference Sahu, Begum, Khadanga, Jha, Vinithkumar and Kirubagaran2013) have recognized PB and JG as potential sites of human activities (including sewage disposal, boat, cargo, ferries, tourism and hotel) with a high load of fine sediments (total suspended solids and turbidity).
The monsoonal runoff also causes high silt and clay (mud < 63 µm) deposition in urban proximity (PB and JG) areas making the sedimentary environment heterogeneous (sandy-muddy). Sediment heterogeneity plays a dual role in the distribution of macrobenthic population (Afli et al., Reference Afli, Ayari and Zaabi2008). Fine sand compositions are known for pollutant and organic matter accumulation (Afli et al., Reference Afli, Ayari and Zaabi2008; Sivadas et al., Reference Sivadas, Nagesh, Gupta, Gaonkar, Mukherjee, Ramteke and Ingole2016). Certain species show natural growths in fine muddy environments, mostly belonging to EGIII of tolerant surface and sub-surface deposit feeders e.g. the cirratulid Chaetozone sp., Magelona sp. and some spionids spp. (Afli et al., Reference Afli, Ayari and Zaabi2008; Sivadas et al., Reference Sivadas, Nagesh, Gupta, Gaonkar, Mukherjee, Ramteke and Ingole2016). However, isopods, amphipods and other polychaetes prefer coarse to fine grade sediments of low organic matter content, mostly belonging to EGI and II that are sensitive or indifferent to disturbances (Afli et al., Reference Afli, Ayari and Zaabi2008; Blanchet et al., Reference Blanchet, Lavesque, Ruellet, Dauvin, Sauriau, Desroy, Desclaux, Leconte, Bachelet, Janson, Bessineton, Duhamel, Jourde, Mayot, Simon and de Montaudouin2008; Dauvin et al., Reference Dauvin, Alizier, Rolet, Bakalem, Bellan, Gomez Gesteira, Grimes, de-la-Ossa-Carretero and Del-Pilar-Ruso2012). Overall, urban areas were characterized by the disturbed benthic community of numerically abundant species of EGIII, IV and V (tolerant, second and first order opportunistic) while numerical presence of all the ecological groups EGI, II, III, IV and V (sensitive, indifferent, resistant, second order and first order opportunistic) were observed at the reference site (WD). The present study signifies that the macrofaunal mean abundance patterns were suggestive of OM induced responses rather than absolute granulometric factors. Results also suggested that the benthic community patterns were distinct for each sampling location and reflected the stress gradient from moderately to mildly enriched conditions at PB, mildly to normal at JG, and normal to pristine at WD. Prediction of tolerant and sensitive species distribution patterns along a disturbance gradient has been previously described (Pearson & Rosenberg, Reference Pearson and Rosenberg1978; Grall & Glémarec, Reference Grall and Glémarec1997; Bigot et al., Reference Bigot, Grémare, Amouroux, Frouin, Maire and Gaertner2008; Ganesh et al., Reference Ganesh, Rakhesh, Raman, Nanduri, Moore and Rajanna2014). Multivariate analysis (CCA) also supported our prediction of faunal assemblages and gave insight to identify the responsible factors for variations. Independent (sand, sediment pH, salinity, OM and silt) and response variables (richness, Shannon diversity and biotic indices) were significantly correlated with benthic faunal abundance. Similar findings were reported by Sigamani et al. (Reference Sigamani, Perumal, Arumugam, Jose and Veeraiyan2015) in the Indian Vellar-Coleroon estuarine system.
Information regarding macrobenthic community responses with respect to organic matter accumulation in the tropics is poorly known and sporadic (Bigot et al., Reference Bigot, Grémare, Amouroux, Frouin, Maire and Gaertner2008; Ansari et al., Reference Ansari, Ingole and Abidi2014; Ganesh et al., Reference Ganesh, Rakhesh, Raman, Nanduri, Moore and Rajanna2014). Wrong assignment of species into EGs may lead to misinterpretations due to underestimation or overestimation of index scores. To assign the species into their respective ecological groups we relied on AMBI taxa list and expert opinion (as suggested by Borja & Muxika, Reference Borja and Muxika2005). On the basis of the response of Orbinia sp., which appeared to be more resistant or tolerant (sub-surface deposit feeders, strong correlation with OM content and equally dominant with first and second order opportunistic species). As with Grall & Glémarec (Reference Grall and Glémarec1997) and A. Borja (personal communication), the present study assigned the Orbinia sp. into the EGIII (previously assigned to EGI in AMBI taxa list) as an indicator of the mildly stressed coastal environment of the region.
Reference conditions
Reference conditions with high biological quality elements are widely used (Song et al., Reference Song, Zou, Zhang, Yu, Zang and Wang2016) and strongly recommended (Muxika et al., Reference Muxika, Borja and Bald2007; Borja et al., Reference Borja, Dauer and Grémare2012; Basset et al., Reference Basset, Barbone, Borja, Elliott, Jona-Lasinio, Marques, Mazik, Muxika, Neto, Reizopoulou, Rosati and Teixeira2013) for the assessment of ecological quality status. M-AMBI calculations are required to set the threshold boundaries when there is an ambiguity for setting the reference condition with low ecological values, or when the study exercises three other criteria of WFD (Daief et al., Reference Daief, Borja, Joulami, Azzi, Fahde and Bazairi2014; Borja et al., Reference Borja, Dauer and Grémare2012; Cai et al., Reference Cai, Meng, Liu and Lin2014; Song et al., Reference Song, Zou, Zhang, Yu, Zang and Wang2016). Setting up a natural reference condition with high EQR may prove difficult when assessing intertidal habitats (Blanchet et al., Reference Blanchet, Lavesque, Ruellet, Dauvin, Sauriau, Desroy, Desclaux, Leconte, Bachelet, Janson, Bessineton, Duhamel, Jourde, Mayot, Simon and de Montaudouin2008; Daief et al., Reference Daief, Borja, Joulami, Azzi, Fahde and Bazairi2014; Brauko et al., Reference Brauko, Muniz, Castro and Lana2016). Wide ranges in variations of coastal morphodynamics reduce the homogeneous condition of soft bottom benthic environments, making it difficult to delineate the natural- and human-induced changes (Daief et al., Reference Daief, Borja, Joulami, Azzi, Fahde and Bazairi2014). The current study has addressed the aforementioned difficulties by the following set-ups: (1) All three of the sites under investigation were sheltered and had a gentle slope of sandy substrata (Table 1) where the environmental regime was related to tidal currents rather than wave dynamics (Omena et al., Reference Omena, Lavrado, Paranhos and Silva2012) and sediments were characterized by a narrow range of mean grain size (2). The study period covered 3 years of continuous monitoring during the stable dry period, thereby delineating the natural disturbances (3). The efficiency of all of the indices were tested with a single disturbance agent (mild organic enrichment) as there are no large-scale industrial establishment sites in the A&N Islands. The EQR of environmental parameters (DO, salinity, temperature, pH and grain size), biological elements (biomass, number of taxa and H′log2) and index scores were found to be highest at the reference site (WD). Fine to medium grain size fractions are known to have a high rate of aeration and dissipative nature within intertidal habitats, which support rich faunal assemblages structured by community determinants (competition, predation and k-strategy) (Barboza & Defeo, Reference Barboza and Defeo2015).
Ecological quality status of the Port Blair coast
In general, the Shannon diversity index assessed the benthic community of PB as moderate and that of JG and WD as having a high status (Table 5). Though H′ index is not a robust measure of benthic habitat quality assessment (Chan et al., Reference Chan, Xu, Liu, Cheung and Shin2015), it was able to detect a disturbance gradient and qualified all samples into five EcoQS. Surprisingly, H′ index scorings were found to be in good agreement with BOPA and AMBI for allocating a high quality status and with AMBI and M-AMBI for a good quality status. However, some ambiguity between the indices existed, for example H′ index completely disagreed with BOPA at PB. A high similarity was only observed at WD and lowest at JG (Figure 7A, B). Numerical dominance is known to reduce H′ values (Blanchet et al., Reference Blanchet, Lavesque, Ruellet, Dauvin, Sauriau, Desroy, Desclaux, Leconte, Bachelet, Janson, Bessineton, Duhamel, Jourde, Mayot, Simon and de Montaudouin2008), which was three-fold higher at PB than at JG and WD. Moderate abundance and almost equal dominance at JG and WD observed more agreement between H′log2 and AMBI. Similarly, a high agreement between H′log2 and M-AMBI was not surprising since M-AMBI shows more affinity to species richness and diversity relative to the AMBI scores (Muxika et al., Reference Muxika, Borja and Bald2007).
Ecological Quality Status (EcoQS) of Port Blair coast assessed by selected biotic indices.

Values are mean ± SD.
W statistics classified the three locations into grossly polluted (PB), polluted (JG) and unpolluted (WD). The results of W-statistics suggested that small-sized r-selected macrofaunal species were dominant in areas proximial to urban centres, while larger-sized species and moderate abundances were observed at the reference site (WD). W-statistics take into account taxonomic sufficiency and require no reference points to be set in order to assess the environmental quality (Dauer et al., Reference Dauer, Luckenbach and Rodi1993; Cai et al., Reference Cai, Meng, Liu and Lin2014). Furthermore, comparison of W scores to reference sites further validates the theoretical assumption of benthic abundance/biomass (k-selected or r-selected) responses against the disturbance magnitude.
BOPA classified all sites uniformly and qualified them as having a good quality status. BOPA qualified about 80% of the samples as having a high to moderate ecological condition at PB (high 31%, good 35%), whilst other indices assigned these to a moderate to poor status. The insensitivity of BOPA at PB was mainly due to a high density of EGIII (Orbinia sp.), which is not considered in derivation scores and therefore gives a frequency weighting to opportunistic or sensitive organisms. The poor performance of BOPA was only observed during 2016 due to high numerical abundance of the opportunistic polychaete C. singularis and Armandia sp. Overall the sensitivity of BOPA appeared to be less than any other complementary indices and failed to detect the stress gradient, qualifying all the sites as having a good status. A similar result from utilizing BOPA was observed by Blanchet et al. (Reference Blanchet, Lavesque, Ruellet, Dauvin, Sauriau, Desroy, Desclaux, Leconte, Bachelet, Janson, Bessineton, Duhamel, Jourde, Mayot, Simon and de Montaudouin2008) and Sivadas et al. (Reference Sivadas, Nagesh, Gupta, Gaonkar, Mukherjee, Ramteke and Ingole2016) where BOPA showed the reverse trend to the rest of the indices calculated. However, in this study, BOPA results obtained from the two other sampling locations were satisfactory and showed good agreement with both AMBI and M-AMBI. The unsatisfactory performance of BOPA at PB might be due to mild organic enrichment (OM-1.7%) as BOPA is known to be sensitive in strongly impacted areas (Riera & de-la-Ossa-Carretero, Reference Riera and de-la-Ossa-Carretero2014).
BENTIX divided all the locations into three gradients of disturbances as poor (PB), moderate (JG) and good condition (WD). However, AMBI qualified PB into moderately disturbed and JG and WD into slightly disturbed habitats and M-AMBI classified PB into moderate, JG into good and WD into high/good ecological quality status. BENTIX classified 85% of all the samples into moderate to poor quality, while conversely AMBI and M-AMBI classified more than 85% of the samples in good to moderate quality (AMBI good-62.5%, M-AMBI good-70%). The reasoning behind the underestimation of the BENTIX index has been previously reported, as it reduces the numerical abundance weighting into three EGs, limiting the threshold boundaries lower than the AMBI and M-AMBI and downgrades the overall environmental health (Brauko et al., Reference Brauko, Muniz, Castro and Lana2016). Poor performance of BENTIX is known in moderately disturbed environments (Brauko et al., Reference Brauko, Muniz, Castro and Lana2016). The performance of EGs based indices have also been reported to be worst in naturally organic rich muddy environments (Blanchet et al., Reference Blanchet, Lavesque, Ruellet, Dauvin, Sauriau, Desroy, Desclaux, Leconte, Bachelet, Janson, Bessineton, Duhamel, Jourde, Mayot, Simon and de Montaudouin2008). Instead of sensitivity or tolerance measures of species, the results showed that there was a surprisingly clear-cut low level agreement between the BENTIX, AMBI and M-AMBI (Table 4). Brauko et al. (Reference Brauko, Muniz, Castro and Lana2016) observed similarly a very high disagreement between BENTIX and AMBI and M-AMBI on Brazilian coasts. Although, the BENTIX index has been applied successfully even at higher taxonomic magnifications (Simboura et al., Reference Simboura, Zenetos and Pancucci-Papadopoulou2014). The performance of BENTIX is related more to the local benthic faunal composition and is therefore likely to be different, in particular tropical intertidal habitats. Multifactorial M-AMBI followed the same pattern as AMBI and coincided in the majority of samples (64%). However, in terms of qualifying ecological quality status, M-AMBI differed from AMBI scores with the latter having a reduced degree of severity. This has been observed previously for example, AMBI samples with a high/good status have been reduced to good/moderate or poor quality status with M-AMBI (Sivadas et al., Reference Sivadas, Nagesh, Gupta, Gaonkar, Mukherjee, Ramteke and Ingole2016). In general, tolerant and opportunistic species (Orbinia sp., C. singularis, Polydora ciliata, Boccardia sp. and Armandia sp.) were observed as dominant in organic rich sediments, which resulted in a poor to moderate status for PB and JG. Song et al. (Reference Song, Zou, Zhang, Yu, Zang and Wang2016) observed a similar pattern of species distributions from different EGs in an intertidal zone from the East coast of China, where intertidal areas with sandy substrata were in healthy condition compared with the areas with high OM, silt and clay deposition. Sigamani et al. (Reference Sigamani, Perumal, Arumugam, Jose and Veeraiyan2015) also found an increasing trend of AMBI scores in relation to OM content of sediments in an estuarine complex and concluded that the low organic content of sandy substrata are favourable for EGI and II, explaining the good to high quality conditions.
Efficiency, suitability and problems with benthic biotic indices in intertidal habitats
The use of a combination of indices, based on different ecological principles has previously been reported as adding more complexity than clarity (Blanchet et al., Reference Blanchet, Lavesque, Ruellet, Dauvin, Sauriau, Desroy, Desclaux, Leconte, Bachelet, Janson, Bessineton, Duhamel, Jourde, Mayot, Simon and de Montaudouin2008). Univariate indices such as richness, evenness and diversity are measures of taxonomic information rather than ecological function/response of species to disturbances (Blanchet et al., Reference Blanchet, Lavesque, Ruellet, Dauvin, Sauriau, Desroy, Desclaux, Leconte, Bachelet, Janson, Bessineton, Duhamel, Jourde, Mayot, Simon and de Montaudouin2008; Chan et al., Reference Chan, Xu, Liu, Cheung and Shin2015), whereas biodiversity measures are habitat type, sample size and sampling methodology dependent attributes (Reiss & Kröncke, Reference Reiss and Kröncke2005; Sampaio et al., Reference Sampaio, Rodrigues and Quintino2011). This was observed in JG, where univariate measures of community descriptors were recorded equally high as for WD (natural reference condition), even though the amount of disturbances at JG can be considered equally high as for PB. A high community characteristic might be the response of intermittent disturbances suggesting a transitional state of system degradation (Pearson & Rosenberg, Reference Pearson and Rosenberg1978). W-statistics is largely a high-scale sample-based procedure (Dauer et al., Reference Dauer, Luckenbach and Rodi1993; Cai et al., Reference Cai, Meng, Liu and Lin2014) and its suitability has not been tested at large scales (Dauer et al., Reference Dauer, Luckenbach and Rodi1993). Since W-statistics classifies into three quality statuses, while the WFD recommends five ecological quality based classes, this makes W-statistics more vulnerable to be ignored. Similarly, BOPA supports the principle of taxonomic sufficiency for reduction in investment of taxonomic efforts (Dauvin et al., Reference Dauvin, Alizier, Rolet, Bakalem, Bellan, Gomez Gesteira, Grimes, de-la-Ossa-Carretero and Del-Pilar-Ruso2012) and was originally developed to assess the oil pollution impact on sensitive amphipods (Dauvin & Ruellet, Reference Dauvin and Ruellet2007). Numerically, amphipods are less abundant (Sivadas et al., Reference Sivadas, Nagesh, Gupta, Gaonkar, Mukherjee, Ramteke and Ingole2016) and naturally devoid in muddy or fine substrata and their sensitivity level varies from species to species depending on the pollutant (Afli et al., Reference Afli, Ayari and Zaabi2008). Detection of stress gradients by BOPA can only occur when there is high numerical abundance of opportunistic species as observed at PB and sensitive species at WD. Inconsistency among indices based on ecological attributes is likely to be related to the formulation of their algorithm for score derivation; AMBI reflects the proportions of five ecological groups of different coefficients (Borja & Muxika, Reference Borja and Muxika2005; Brauko et al., Reference Brauko, Muniz, Castro and Lana2016), BENTIX reduces into three ecological groups and gives equal abundance weighting (Salas et al., Reference Salas, Marcos, Neto, Patíciob, Pérez-Rizafa and Marques2006; Blanchet et al., Reference Blanchet, Lavesque, Ruellet, Dauvin, Sauriau, Desroy, Desclaux, Leconte, Bachelet, Janson, Bessineton, Duhamel, Jourde, Mayot, Simon and de Montaudouin2008), while M-AMBI is a multifactorial extension of AMBI scores, Shannon–Wiener diversity and species richness measures (Muxika et al., Reference Muxika, Borja and Bald2007; Daief et al., Reference Daief, Borja, Joulami, Azzi, Fahde and Bazairi2014; Brauko et al., Reference Brauko, Muniz, Castro and Lana2016). In comparison to natural conditions, M-AMBI may overestimate the quality status of infrequently disturbed habitats which are likely to harbour rich biodiversity (intermediate disturbance hypothesis, Connell, Reference Connell1978; Pearson & Rosenberg, Reference Pearson and Rosenberg1978).
Nevertheless, marine biotic indices have been applied and successfully used to assess intertidal habitats around the globe (Blanchet et al., Reference Blanchet, Lavesque, Ruellet, Dauvin, Sauriau, Desroy, Desclaux, Leconte, Bachelet, Janson, Bessineton, Duhamel, Jourde, Mayot, Simon and de Montaudouin2008; Omena et al., Reference Omena, Lavrado, Paranhos and Silva2012; Daief et al., Reference Daief, Borja, Joulami, Azzi, Fahde and Bazairi2014; Brauko et al., Reference Brauko, Muniz, Castro and Lana2016; Song et al., Reference Song, Zou, Zhang, Yu, Zang and Wang2016). In the present study, except for the BOPA index, the performance of all indices (H′log2, W-statistics, BENTIX, AMBI and M-AMBI) was deemed satisfactory and efficient to describe the status of the intertidal benthic quality and detection of a gradient of disturbance level. Instead of a low level of agreement, all indices utilized unanimously described the high-good health condition of the reference site (WD). However, no single index was consistent and their suitability appeared to be site specific for the majority of samples. For example, the samples were overestimated by H′log2 and M-AMBI at JG while the samples were underestimated by BENTIX at WD. The results of the present study suggest that precautionary measures should be taken when assessing the quality status of benthic habitats, particularly in tropical intertidal habitats which are assessed using different marine biotic indices. The use of the BOPA index in muddy or mildly disturbed environments should be avoided. The severity of BENTIX can be minimized by exercising intercalibration by broadening the threshold boundaries for each classes. However, BENTIX will still tend to minimize scores if the species of EGIII and IV are in moderate abundances as their presence will increase the weighting of EGII and III of BENTIX. Similarly, the overrating of H′log2 and M-AMBI can be adjusted by setting a natural reference condition for high EQR, or increasing or decreasing the highest score of diversity and AMBI by 15% (for further explanation, see Borja et al., Reference Borja, Dauer and Grémare2012; Cai et al., Reference Cai, Meng, Liu and Lin2014; Daief et al., Reference Daief, Borja, Joulami, Azzi, Fahde and Bazairi2014; Sivadas et al., Reference Sivadas, Nagesh, Gupta, Gaonkar, Mukherjee, Ramteke and Ingole2016; Song et al., Reference Song, Zou, Zhang, Yu, Zang and Wang2016). In summary, AMBI and M-AMBI were robust measures to detect the scale of disturbances and can be efficiently used for coastal quality evaluation of this region.
CONCLUSIONS
This study concludes that temperate benthic biotic indices can be used in tropical littoral habitats and has tested their sensitivity under mild organic enrichment and stable dry periods (avoiding strong seasonality in tropics) by setting natural reference conditions. Despite the inconsistencies in sediment organic matter, all indices indicated a lowering trend of habitat quality from 2014–2016. Temporal variation of macrobenthic community was reflected as increased or decreased values of benthic indices. Further studies are required for testing and validation of index performances during wet periods. In terms of sensitivity, all indices except one (BOPA) were successful in detecting the degree of disturbance, while in terms of similarity/agreement of the five different biotic indices, only the BENTIX index showed less congruency (similarity). Consistency and strong correlation between environment parameters and synthetic indices were observed and appeared to be strong community descriptors. Between all the suites of complementary indices, H′log2, AMBI and multi-factorial extension (M-AMBI) appeared coherent in terms of qualifying the benthic Ecological Quality Status of tropical A&N coastal waters while W-statistics, BOPA and BENTIX required readjustment of their threshold boundaries for quality classification. For an efficient use of benthic biotic indices and reliable and meaningful assessment of tropical intertidal habitats, inclusion of natural reference conditions (no or reduced disturbance) and sampling in dry periods (stable and calm) are highly recommended. Nevertheless, in order to test the performance of biotic indices, a long-term monitoring approach of integrating abiotic and biotic descriptors is strongly recommended.
ACKNOWLEDGEMENTS
The authors express gratitude to the Pondicherry University for providing facilities for this study. JE extends his sincere thanks to Mr Ravi Rai and Mr Ravi Pratap Singh for their indispensable support during sample collection and laboratory analysis. The authors are grateful to two anonymous reviewers for improving the manuscript. We further acknowledge Mr Chandrakanta Ojha for helping with the maps included in the manuscript.