INTRODUCTION
The existence of former lakes and wetlands provides valuable insights to the environments met by the first humans (Homo sapiens) when they arrived in the Levant from Africa (Bar-Yosef and Belfer-Cohen, Reference Bar-Yosef and Belfer-Cohen2013; Breeze et al., Reference Breeze, Groucutt, Drake, White, Jennings and Petraglia2016; Bae et al., Reference Bae, Douk and Petraglia2017). The timing of this migration and the associated patterns of human dispersal likely were strongly influenced by the availability of freshwater resources (Vaks et al., Reference Vaks, Bar-Matthews, Ayalon, Matthews, Halicz and Frumkin2007, Reference Vaks, Bar-Matthews, Matthews, Ayalon and Frumkin2010) from either rainfall runoff or groundwater-fed springs along the way (Mischke et al., Reference Mischke, Opitz, Kalbe, Ginat and Al-Saqarat2015; Engel et al., Reference Engel, Matter, Parker, Parton, Petraglia, Preston and Preusser2016; Ginat et al., Reference Ginat, Opitz, Ababneh, Faershtein, Lazar, Porat and Mischke2017; Roberts et al., Reference Roberts, Stewart, Alagaili, Breeze, Candy, Drake and Groucutt2018). The deserts of the southern Levant are hyperarid today, with rainfall of <50–100 mm/yr, but the scatter of palaeolakes and wetlands is a compelling sign of the hydrological transformations of the past (Litt et al., Reference Litt, Ohlwein, Neumann, Hense and Stein2012; Mischke et al., Reference Mischke, Ginat, Al-Saqarat and Levin2012, Reference Mischke, Opitz, Kalbe, Ginat and Al-Saqarat2015; Abbas et al., Reference Abbas, Al-Saqarat and Al-Shdaifat2016; Breeze et al., Reference Breeze, Groucutt, Drake, White, Jennings and Petraglia2016; Groucutt et al., Reference Groucutt, Grün, Zalmout, Drake, Armitage, Candy and Clark-Wilson2018; Goder-Goldberger et al., Reference Goder-Goldberger, Crouvi, Caracuta, Horowitz, Neumann, Porat and Scott2020). The first human migrants arriving from Africa are thought to have crossed the Levantine deserts during an interval of wetter climate sometime between about 130 and 90 ka (Vaks et al., Reference Vaks, Bar-Matthews, Ayalon, Matthews, Halicz and Frumkin2007; Waldmann et al., Reference Waldmann, Torfstein and Stein2010; Frumkin et al., Reference Frumkin, Bar-Yosef and Schwarcz2011; Lazar and Stein, Reference Lazar and Stein2011; Breeze et al., Reference Breeze, Groucutt, Drake, White, Jennings and Petraglia2016), and there is still much to discover about how these people utilized the hydrological systems they encountered (Goldberg, Reference Goldberg1986; Jones and Richter, Reference Jones and Richter2011; Tooth and McCarthy, Reference Tooth and McCarthy2007). Sites of intermittent freshwater remain poorly dated in the southern Levant deserts, and the palaeoclimate records documented thus far are insufficient to evaluate water resources during the critical 130–90 ka time window of human migration from Africa (Yasin, Reference Yasin2000; Moumani et al., Reference Moumani, Alexander and Bateman2003; Ginat et al., Reference Ginat, Opitz, Ababneh, Faershtein, Lazar, Porat and Mischke2017). Key questions concern the distribution of freshwater sites during wetter intervals and locations that may have served as plausible stepping-stones to better-watered areas. Evidence for such sites may be preserved, for instance, as sedimentary deposits of palaeolakes or wetlands where the most salient information to be documented includes the time interval(s) of water availability and the depth and persistence of the water body (Breeze et al., Reference Breeze, Groucutt, Drake, White, Jennings and Petraglia2016; Ginat et al., Reference Ginat, Opitz, Ababneh, Faershtein, Lazar, Porat and Mischke2017). Such information is pivotal to our growing knowledge of the Levantine desert environments met by the first humans.
Wadi Gharandal, a riverine oasis in southern Jordan
One possible stepping-stone is Wadi Gharandal (30.085°N, 35.209°E), a potentially important site for human migration located ~65 km north of Aqaba on the eastern flank of the ‘Arabah valley, and the junction of an important eastern route from the ‘Arabah valley through the rift margin highlands to the east. Fluvial incision along Wadi Gharandal has exposed remnants of a former valley fill up to ~20 m thick, covering an area of ~0.17 km2, and lying inset between outcrops of chert-limestone Umm Rijam Formation (Palaeocene–early Eocene) and the Dana Conglomerate Formation (late Oligocene to early Pleistocene) (Ibrahim, Reference Ibrahim1993). This fill is a mix of fine-grained sandstone, finely laminated evaporites, organic laminae, claystone, pebbly conglomerates, green-grey marls with gypsum laminae, and grey-white sandy marls (Ibrahim, Reference Ibrahim1993). Based on its lithology, which is comparable with the late Pleistocene lacustrine Lisan Formation, the valley fill has been considered to represent a southern extension of Lake Lisan (Bender, Reference Bender1974; Ibrahim, Reference Ibrahim1993), the immediate precursor to the Dead Sea (Begin et al., Reference Begin, Ehrlich and Nathan1974; Bartov et al., Reference Bartov, Stein, Enzel, Agnon and Reches2002). This interpretation, however, is problematic (Henry et al., Reference Henry, Bauer, Kerry, Beaver and White2001), because: (1) the known southern limit of the Lisan Formation occurs ~100 km to the north (Neev and Emery, Reference Neev and Emery1967; Greenbaum et al., Reference Greenbaum, Ben-Zvi, Haviv and Enzel2006), and (2) the Lisan Formation has been observed no higher than 160 m below sea level (m bsl) (Bartov et al., Reference Bartov, Stein, Enzel, Agnon and Reches2002, Reference Bartov, Goldstein, Stein and Enzel2003; Waldmann et al., Reference Waldmann, Stein, Ariztegui and Starinsky2009; Torfstein and Enzel, Reference Torfstein, Enzel, Enzel and Bar-Yosef2017), which is ~90 m below the Gharandal sequence. Henry et al. (Reference Henry, Bauer, Kerry, Beaver and White2001) and also Braun (Reference Braun2015) suggest a natural dam had blocked the valley at the rangefront, while Ginat et al. (Reference Ginat, Opitz, Ababneh, Faershtein, Lazar, Porat and Mischke2017) propose a “tectonically controlled barrier.”
Several studies have investigated the history of hominin occupation in the ‘Arabah. Henry et al. (Reference Henry, Bauer, Kerry, Beaver and White2001) document artefacts with typologies denoting Middle Palaeolithic and Early Upper Palaeolithic ages (~150–30 ka) within the top 1.2 m of a “quasi-lacustrine” unit that is found at the modern surface. These artefacts were presumed to have been derived from shoreline encampments around a seasonal lake. Older Acheulean artefacts are reported from a nearby high terrace (Al-Nahar and Clark, Reference Al-Nahar and Clark2009). To resolve the nature of the water body at Gharandal, Braun (Reference Braun2015) studied the microfossils preserved within the valley fill and concluded that the ostracod assemblages indicate a riverine wetland (paludal) environment (Cowardin et al., Reference Cowardin, Carter, Golet and LaRoe1979), rather than a lake (Mischke et al., Reference Mischke, Ginat, Al-Saqarat, Faershtein, Porat, Braun, Rech, Enzel and Bar-Yosef2017; Ginat et al., Reference Ginat, Opitz, Ababneh, Faershtein, Lazar, Porat and Mischke2017). This result extinguishes the idea of any link to Lake Lisan (Bender, Reference Bender1974; Ibrahim, Reference Ibrahim1993) or a substantial volume of standing water (Henry, Reference Henry, Bauer, Kerry, Beaver and White2001). Braun (Reference Braun2015) reports two optically stimulated luminescence (OSL) dates (112 ± 9 ka and 32 ± 4 ka) and four 14C dates (38–25 cal ka BP) from organic-rich carbonates. The lower and upper parts of the Gharandal sequence were not dated. Moreover, given that the OSL and 14C ages are stratigraphically inconsistent (Braun, Reference Braun2015; Mischke et al., Reference Mischke, Ginat, Al-Saqarat, Faershtein, Porat, Braun, Rech, Enzel and Bar-Yosef2017; Ginat et al., Reference Ginat, Opitz, Ababneh, Faershtein, Lazar, Porat and Mischke2017), and 14C ages draw close to the limit of the method, there is a need for a better chronology for this site, especially in the context of the lithic artefacts observed within the stratified sediments by Henry et al. (Reference Henry, Bauer, Kerry, Beaver and White2001).
Here, we report the findings of a chronometric and sedimentological study of the Wadi Gharandal depositional sequence. We set out to: (1) resolve the damming mechanism that formed the wetland; (2) reconstruct the origin and the environment of deposition associated with the sedimentary archive at Wadi Gharandal; (3) determine the timing of the accumulation of the sedimentary facies based on OSL dating; (4) discuss any palaeoclimatic implications of the Gharandal wetland; and (5) consider the implications of freshwater availability for hominins traversing the Levantine deserts.
Physiographic setting
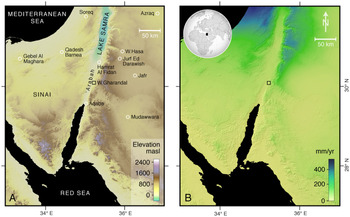
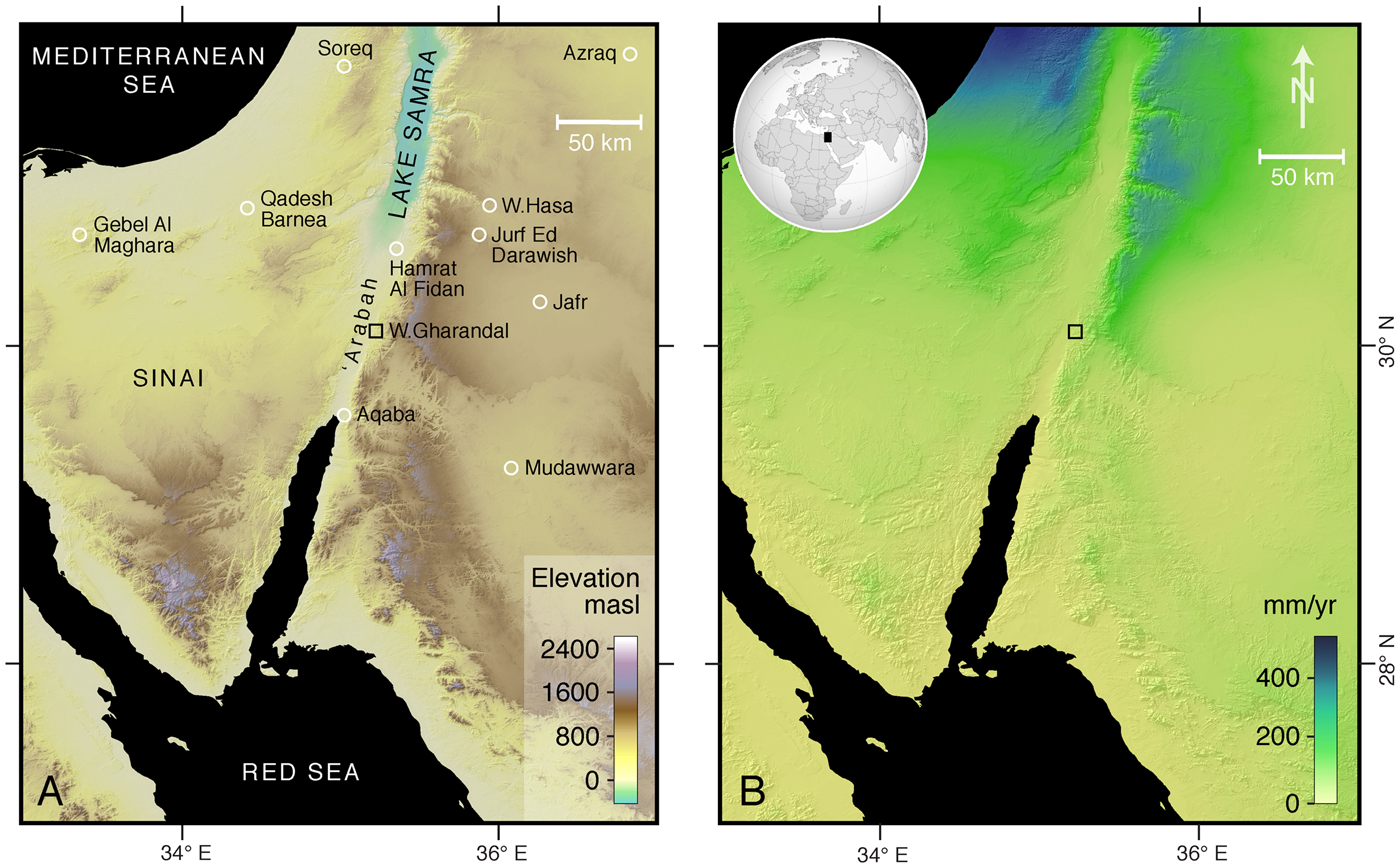
Wadi Gharandal today is an ephemeral stream that drains a small upland catchment of ~5.5 km2. Floodwaters meet with Wadi ‘Arabah (the axial drainage) following exceptionally rare, heavy rain. Large floods from Gharandal are likely to be triggered by inputs from Wadi al Siq, the adjoining catchment to the south that extends to the rim of the Jordan Plateau (~1400 m above sea level [m asl]) and possibly overspills into the Gharandal headwaters at a former drainage capture (~30.065° N, 35.233° E). This part of the ‘Arabah lowlands receives an average of ~50 mm/yr of precipitation (Fig. 1), though interannual variability is high, and orographically induced totals rise to ~300–400 mm/yr on the highlands (Fig. 1; Almomani et al., Reference Almomani, Al Shraydeh, Shakhatreh, Alroud, Brezat, Obayat and Atyeh2018). The region has a hot arid climate according to the Köppen-Geiger scheme (Kottek et al., Reference Kottek, Grieser, Beck, Rudolf and Rubel2006). The stony desert soils are bare of vegetation over wide areas with infrequent grasses, low-growing scrub, and scattered riparian reeds and phragmites reeds along the channel. Groundwater discharge supports a small oasis comprising a riparian grove of date palms and tamarisk (Figs. 2A and 3). About 200 m west of the Gharandal rangefront, a Roman military fort ‘Ayn Gharandal’ indicates the ready availability of water from the spring around the late third to early fourth century of the Common Era (Darby and Darby, Reference Darby and Darby2015).
(color online) (A) Location of the study area and neighbouring regions of the Levant and northern Arabia, including sites of palaeoclimatic records. The base map is a digital elevation model derived from 1 arc-sec Shuttle Radar Topography Mission data. (B) Estimated mean annual rainfall according to WorldClim 2.0 data (Fick and Hijmans, Reference Fick and Hijmans2017), which for Wadi Gharandal is ~50 mm/yr.
METHODS
Stratigraphy and chronology
Several excellent sedimentary exposures occur throughout the lower portion of the wadi. Three sections were chosen to represent the variation in the stratigraphy from: (1) close to the outlet of the wadi; (2) mid-wetland basin; and (3) towards the upstream extent of the basin (Figs. 2 and 3). The middle and upper portions of section 2 were inaccessible but were logged from photographs. Sections 1 and 3 were fully accessible. At these latter locations, small three-dimensional exposures were revealed as necessary using a trowel to identify the flow orientation of planar lamination and cross bedding. The grain size of strata was noted using a sand ruler. The basic stratigraphy was described and sketched. Photographs were taken of individual sections to develop the section descriptions further. Finally, the dam site was examined, including locally exposed faults and evidence for mass movement.
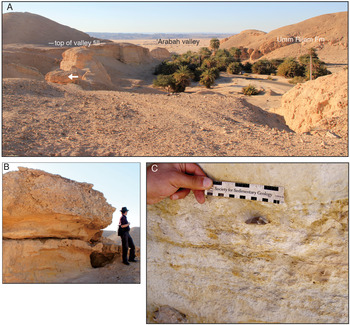
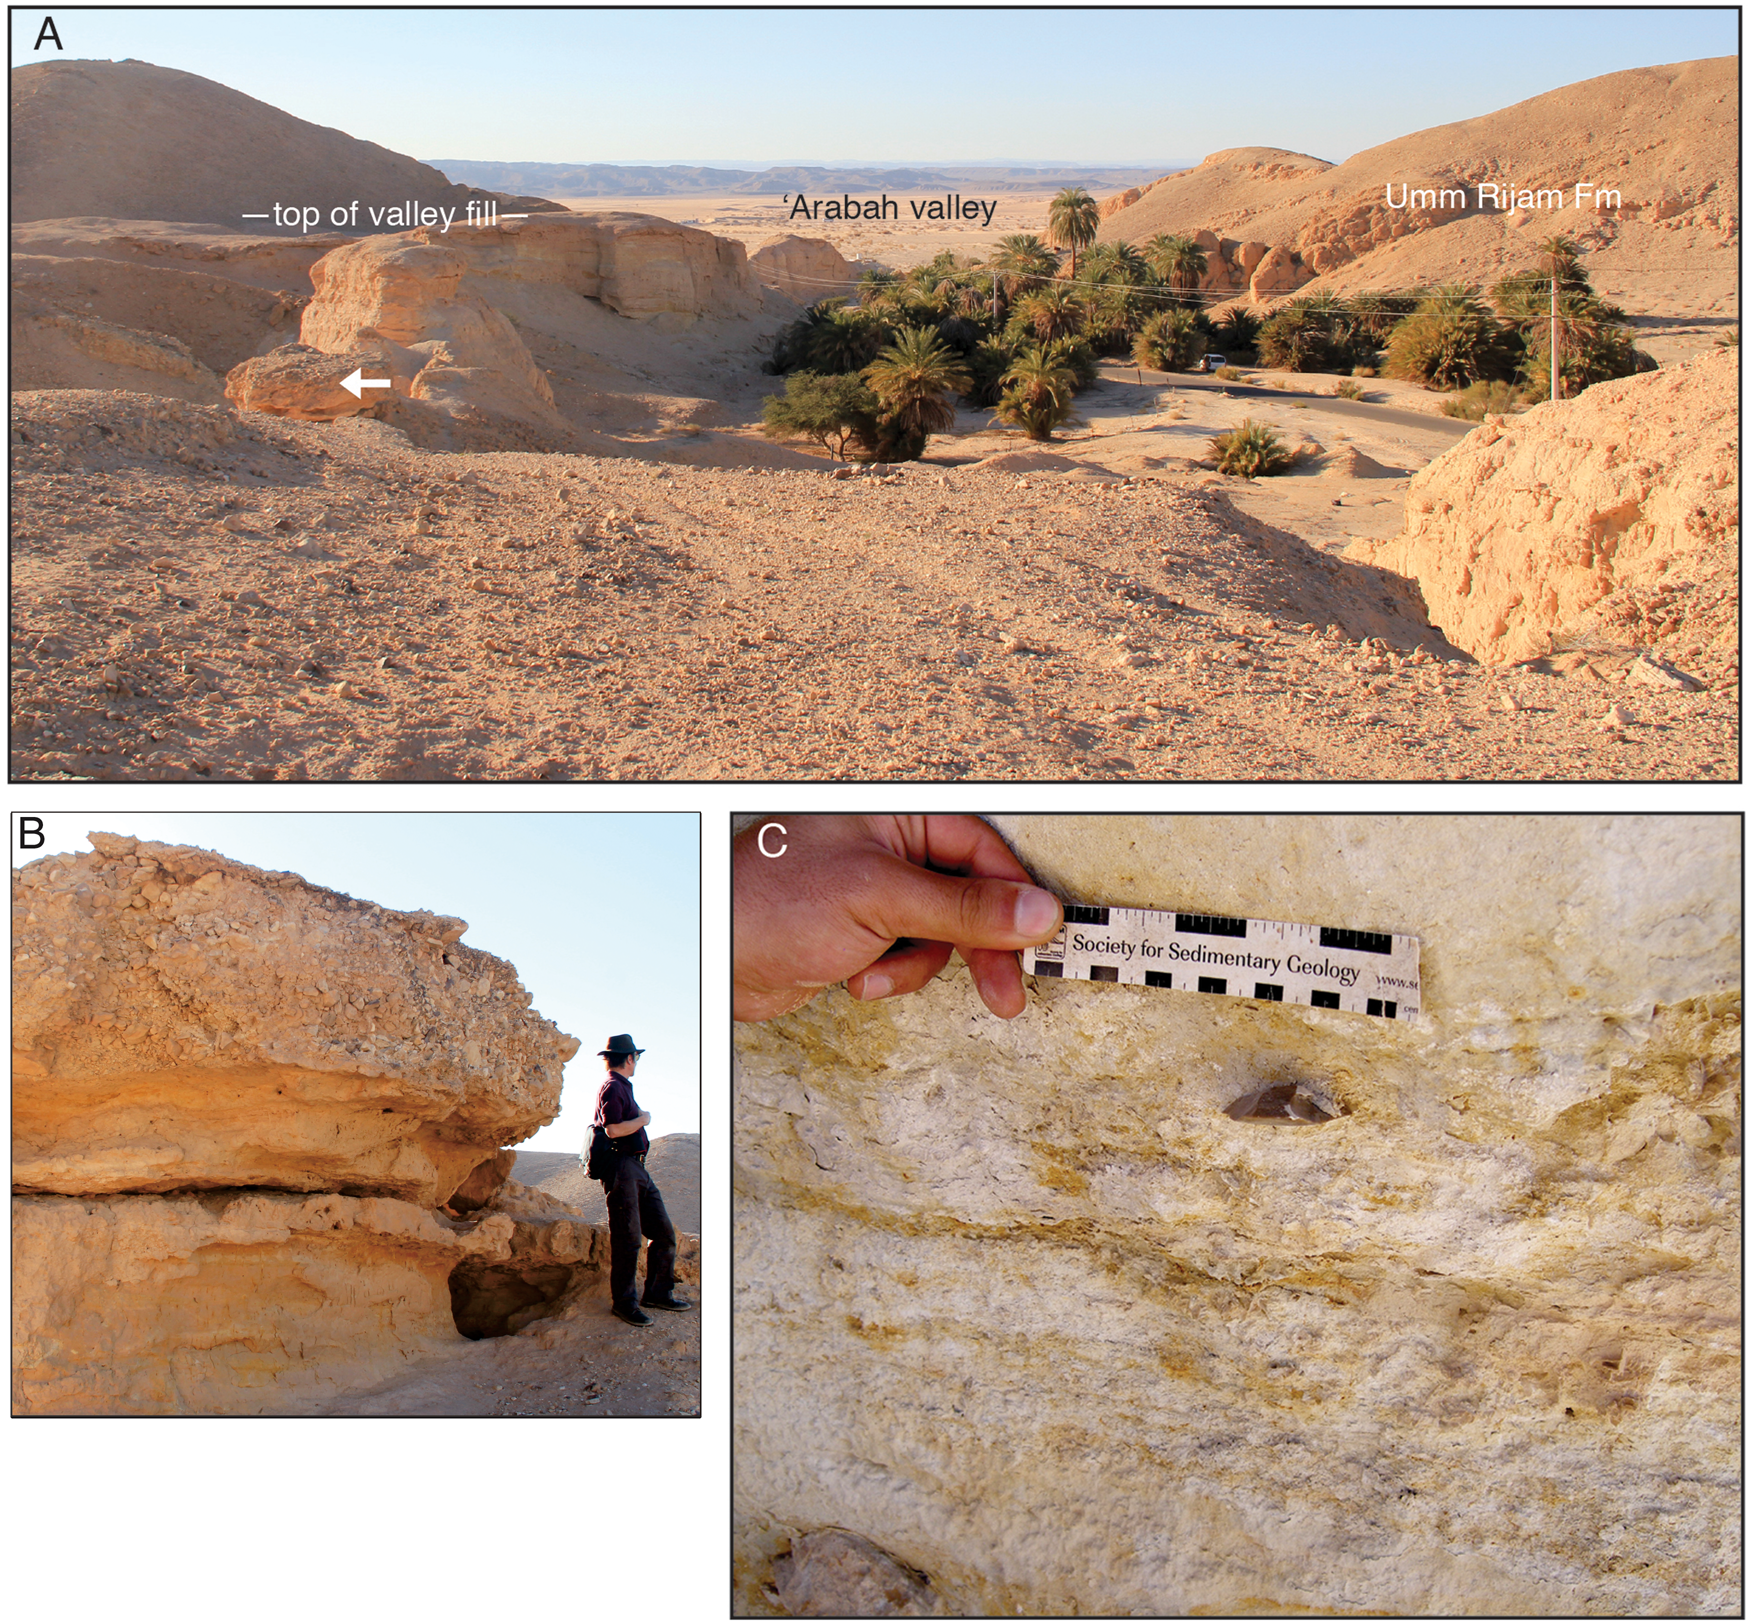
(color online) Photographs from Wadi Gharandal. (A) Overview of the Gharandal valley floor viewed from site 2, with the ‘Arabah valley beyond. White arrow marks gravelly outcrop (B). (B) Fluvial gravels that cap the paludal facies at site 2 (Fig. 5). (C) In situ lithic artefact GH3-1 (Fig. 7B), collected at site 3 and ascribed a minimum depositional age of 74 ± 7 ka; its stratigraphic position is shown in Fig. 5.
Chronometry focused on constraining the ages of the fine-sandy and marly, mud-rich beds in the three sections. Ten OSL samples were collected from the three sections by inserting a 40-mm-diameter stainless-steel tube into a freshly exposed face. The sections were linked relative to each other using a handheld laser rangefinder (Apresys Powerline 1000), with a horizontal distance measurement uncertainty of ± 1 m. To tie the sections to absolute elevation above sea level, we used a handheld Garmin™ global positioning system (GPS) with typical uncertainties of ± 10–15 m (x,y coordinates) to determine the x,y coordinates of a large flattish area above site 2. We located those x,y coordinates in Google Earth and accepted the absolute elevation attributed to that point.
The sampling strategy relates to the fact that prior studies consider the valley fill sequence to be paludal or fluvial. The OSL sampling aimed to bracket the likely paludal (fine-grained) facies by sampling basal and topmost fluvial (gravel) units. Seven OSL samples were taken from site 1 as follows: three in the basal sandy part, two in the highest sandy marl, and two in the upper sandy beds. The principle of sampling being that the sandy units represent fluvial sediments that would bracket the age of the carbonate-rich paludal facies. Similarly, at site 2, to delineate the temporal persistence of the carbonate-rich strata, a basal sample was obtained from a sand bed immediately below the first paludal unit and an upper sample for OSL dating was obtained from the highest sandy marl. A further OSL sample represents the sandy marl at site 3.
OSL analysis
Each sample tube was opened in the laboratory under subdued red light, ~3–4 cm of end material was discarded, and the interior unexposed material was retained for quartz purification via standard procedures (Aitken, Reference Aitken1998). Samples were treated with hydrochloric acid (10%) to remove carbonates, and for 2 weeks with hydrogen peroxide (30%) to remove organic materials. The 90–125 μm grain-size fractions were concentrated via wet sieving. Samples were then treated with hydrofluoric acid (40%) for 40 minutes to remove feldspars and to etch the outer ~10 μm alpha-irradiated rind of each quartz grain, followed by washing in hydrochloric acid (10%) to remove acid-soluble fluorides (Lai and Wintle, Reference Lai and Wintle2006; Lai et al., Reference Lai, Kaiser and Brückner2009). The purity of the quartz was checked by infrared stimulated luminescence (Lai, Reference Lai2010; Yu and Lai, Reference Yu and Lai2014), and none of the samples contained a notable feldspar amount. The quartz grains were mounted on 10 mm stainless-steel discs with silicone oil and loaded into a Risø DA-20 TL/OSL reader. The quartz grains were stimulated with blue (ʎ = 470 ± 20 nm) laser light at 130°C for 40 s, and the OSL emissions were detected with photomultiplier tube fitted with a 7.5-mm-thick U-340 filter (detection window 275–390 nm). Equivalent dose (De) values were determined via a single aliquot regenerative-dose (SAR) protocol (Murray and Wintle, Reference Murray and Wintle2000). For each sample, six aliquots were measured to generate six growth curves, and from those a standardised growth curve (Roberts and Duller, Reference Roberts and Duller2004; Lai, Reference Lai2006; Lai et al., Reference Lai, Wintle and Thomas2007). The natural signal, LN/TN (where LN is the natural luminescence signal, and TN is luminescence signal of a test dose applied to the aliquot after measuring LN), was determined for additional aliquots under the same conditions applied in the SAR protocol (Lai et al., Reference Lai, Mischke and Madsen2013). The resultant growth curves were fitted with a linear or exponential function. All samples yielded De values <100 Gy, except GH13 (144.53 ± 6.1 Gy) and GH31 (137.32 ± 4.07 Gy). Concentrations of uranium, thorium, and potassium in the samples were measured via neutron activation analysis (Table 1). The cosmic-ray dose rate was estimated for each sample as a function of burial depth, altitude, and geomagnetic latitude. The extreme dryness of the samples as collected in the field is not representative of their long-term average water content, given that the valley fill was occupied intermittently by a wetland; for such samples we assumed an average water content of 20 ± 5%.
Summary of optically stimulated luminescence (OSL) results and analyses. All uncertainties are ± 1σ (see Fig. 5).

a Lower average water content is assumed for sample GH17, because valley fill incision (and therefore drying) followed shortly after.
b For each sample, 12 aliquots were measured to determine the natural dose, and 6 aliquots to determine the equivalent dose, De.
RESULTS
Location and nature of the dam impounding the wetland
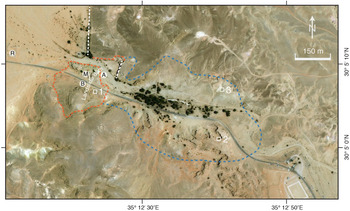
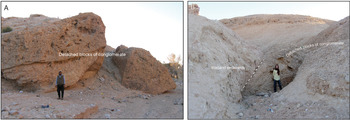
The exit from Wadi Gharandal to the ‘Araba valley was blocked by a landslide dam, although little of this structure remains today. The rangefront at Gharandal lies on, or close to, the eastern margin of the north–south-trending Dead Sea Transform (Ibrahim, Reference Ibrahim1993), which has an estimated average Pleistocene slip rate of 4.5 ± 1.5 mm/yr (Makovsky et al., Reference Makovsky, Wunch, Ariely, Shaked, Rivlin, Shemesh, Ben Avraham and Agnon2008). Here, the segment known as the Aqaba-Gharandal Fault (Ibrahim and Rashdan, Reference Ibrahim and Rashdan1988) is buried by alluvial fan sediments, yet surface expressions of associated faults occur along the rangefront both north and south of Gharandal (Galli, Reference Galli1999; Niemi, Reference Niemi, Amit, Agnon and Matmon2009; Le Béon et al., Reference Le Béon, Klinger, Al-Qaryouti, Mériaux, Finkel, Elias, Mayyas, Ryerson and Tapponnier2010; Makhlouf et al., Reference Makhlouf, Amireh and Abed2010). A steep fault plane is exposed on the right flank of the valley at the exit from Gharandal that is associated with a prominent slope failure scarp (Fig. 3); other failures are likely to have occurred here prior. A further possible fault demarcates the rangefront to the north. The local bedrock is fractured, highly weathered, and extensively intruded by dykes and minor faults, such that on the left flank of the valley there is a complex of foundered bedrock blocks associated with a northward-dipping bedding plane (Fig. 4). Incision of the wadi due to the relative uplift of the eastern flank of the rift has evidently over-steepened the valley margins, rendering the bedrock unstable. We speculate that the collapse leading to the blocking and damming of the wadi may have been enhanced or initiated by seismic shaking. In this context, Galli (Reference Galli1999) notes several other wadis flanking the ‘Arabah Valley had been temporarily dammed or diverted by fault movements.
Aerial view of Wadi Gharandal (Google Earth image), showing our three stratigraphic sites (white squares); faults (white dashes); approximate landslide extent (orange dashes) and detached blocks (A, B) associated with the dam (Fig. 4 A and B); Roman fort (R) and military checkpoint (M); and the approximate maximum extent (~0.17 km2) of the Gharandal wetland (blue dashes). The grove of palm trees marks the present-day area of spring-fed ponds, and stream flow is towards Wadi Al ‘Arabah from right to left. (For interpretation of the references to color in this figure legend, the reader is referred to the web version of this article.)

(color online) Remnants of the landslide dam at Wadi Gharandal (see Fig. 3 for locations). (A) View downstream of detached blocks that are the remnants of a former dam at the rangefront (noted by Braun, Reference Braun2015); the modern channel floor stretches downstream to the far right. (B) Detached blocks of conglomerate at the left valley margin with contact (dashed line) to onlapping sediments. The landslide headwall is shown in the background above.

Stratigraphy and interpretation of sedimentary sections
Site 1
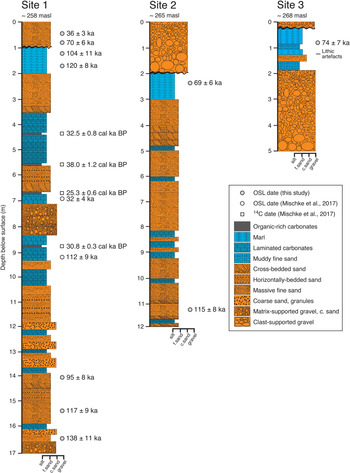
Description. A 17-m-thick sequence (Figs. 3 and 5, 30.08528°N, 35.20665°E) comprises interbedded fine sands (of reddish, brownish, and greenish colour) with some cross bedding and occasional ripple marks, intercalated with laminated carbonates and gravel beds. Just upstream of site 1, well-rounded fluvial gravels in a sandy matrix crop out at a similar depth as the gravels recorded at ~8 m depth at site 1. From this section, Braun (Reference Braun2015) and Mischke et al. (Reference Mischke, Ginat, Al-Saqarat, Faershtein, Porat, Braun, Rech, Enzel and Bar-Yosef2017) report microfossil (ostracods) assemblages together with four 14C dates from the organic fragments within carbonate layers, and two OSL dates (Fig. 5).
(color online) Three stratigraphic sections, showing our new optically stimulated luminescence (OSL) ages (black circles), plus previously published OSL dates (open circle) and 14C dates (square) at site 1 (Braun, Reference Braun2015; Ginat et al., Reference Ginat, Opitz, Ababneh, Faershtein, Lazar, Porat and Mischke2017; Mischke et al., Reference Mischke, Ginat, Al-Saqarat, Faershtein, Porat, Braun, Rech, Enzel and Bar-Yosef2017). There are two OSL dates (±1σ): 112 ± 9 ka (JED-21), 32 ± 4 ka (JED-20) and four 14C ages from charcoal in the middle part of the section (2σ intervals): 33,270–31,710 cal yr BP (Poz-55348); 39,220–36,820 cal yr BP (Poz-53311); 25,870–24,630 cal yr BP (Poz-55347); 31,130–30,530 cal yr BP (Poz-55349). Note that some parts of these sections are composite (site 1 is joined at 5.9 m), hence depths shown do not all correspond to sample depths listed in Table 1. At site 1, Braun (Reference Braun2015) reports that ostracods are concentrated in the depth range 13.0 to 9.7 m, and then again at ~3 m (Candona neglecta only).
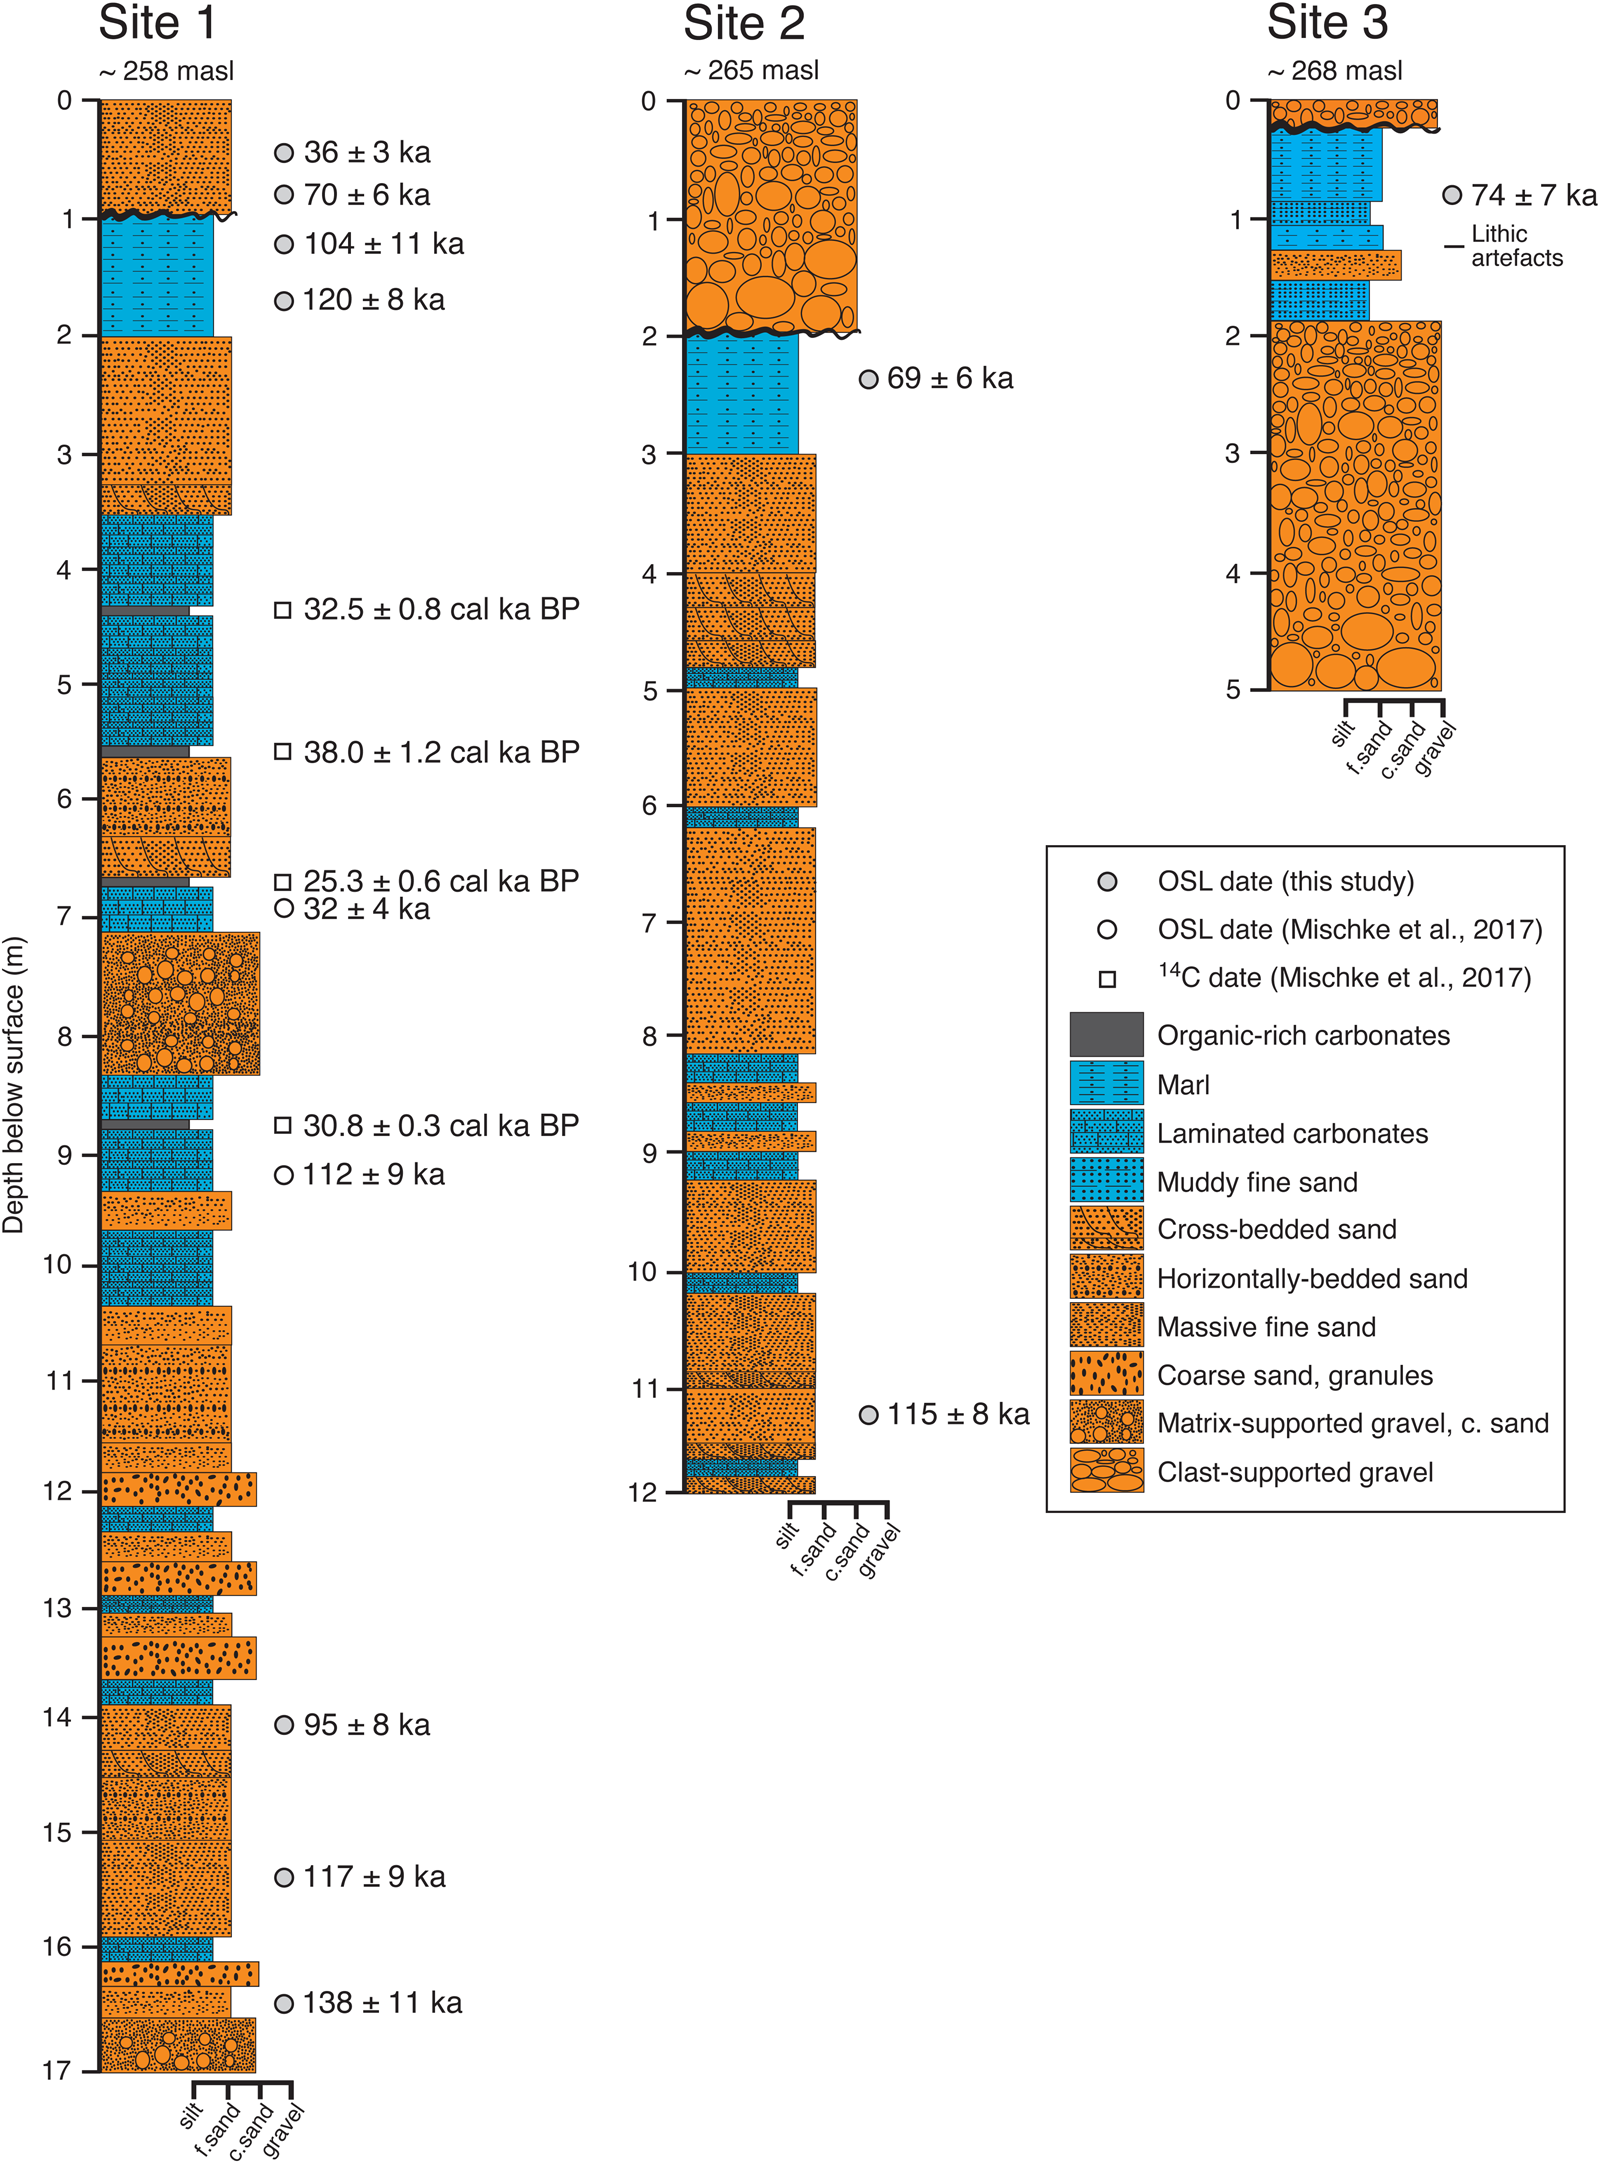
Interpretation. The basal (~1 m) fine sand and gravels represent fluvial channel deposits that predate the damming of the wadi. The first laminated carbonate layer occurs at 16 m depth and is indicative of standing water. Thin layers of laminated carbonate-rich or marly deposits occur from this level until ~3.0 m depth and frequently are intercalated with sandy in-wash. The thinness of the beds and the frequent occurrence of organic-rich carbonate beds (suitable for 14C dating) suggest that, here close to the landslide dam, shallow and potentially ‘black mat’ conditions (Quade et al., Reference Quade, Forester, Pratt and Carter1998) existed on occasions between episodes of sandy in-wash via small floods. The upper 3.4 m of the section consists of thick sand deposits enveloping a 1.1-m-thick marl bed; although the latter indicates localized ponding, the thicker sand beds suggest progressive sandy infilling by accreting flood deposits rather than occasional in-wash to shallow ponds.
Site 2
Description. A 12-m-thick section (Figs. 3 and 5, 30.08363°N, 35.21135°E), comprising interbedded organic-rich fine sands and laminated calcium carbonate–rich beds, some dipping ~5° downstream. The sand beds are occasionally cross-bedded with some ripple marks at bedding surfaces. Black manganese oxide nodules are commonly observed along vertical lines of preferential water flow and probably developed after valley fill incision. Root casts occur in some beds. Calcareous units are capped by reddish fine sand, while the upper part of the section, a horizontal, 1.5-m-thick unit of whitish silt-clay marl, shows local convolutions. The section is topped by a 1-m-thick upward-fining unit of fluvial quartz and chert gravels unconformably lying above the fine-grained sediments. The gravel bed includes subangular clasts derived from local chert outcrops, and many retain a desert varnish, indicating minimal fluvial transport.
Interpretation. The basal (~1.8 m) fine sand and gravels represent fluvial channel deposits that predate the damming of the wadi. Thin layers of laminated carbonate-rich or marl deposits occur occasionally from 10.1 m depth until 4.8 m, but sandy layers predominate. The thickness of the sandy beds indicates that ponding was not persistent and that sands were frequently washed into the wetland from the wadi and surrounding hillslopes. Substantive organic-rich layers are absent, in contrast to site 1, which may indicate frequent oxidising conditions. The upper 4 m of the section is similar to the upper 3 m of the section 1 and may correlate.
Site 3
Description. A 5-m-thick section (Figs. 3 and 5, 30.08539°N, 35.21130°E) is exposed above a thick alluvial body of sediments that are not fully exposed. The 3.2-m-thick basal part of the exposed section consists of gravel that can be traced down the local modern hillside, forming one or more units of coarse-grained, subangular to well-rounded fluvial gravels up to 50 cm in diameter. The coarse gravel at the base lies directly on bedrock, as exposed in a nearby gully. The gravels are topped by a 0.6-m-thick unit of massive, muddy fine sand with intercalated chert pebbles and convoluted bedding at the boundary forming a stringer of granules; these gravel-rich beds are overlain by a massive, whitish marl unit with small calcium carbonate nodules, root casts (reeds?; see also Henry et al., Reference Henry, Bauer, Kerry, Beaver and White2001), and biogenic voids. Three in situ lithic artefacts were found within the marl bed at 1.25 m depth (see Discussion). The sequence is capped by a thin layer of fluvial gravel, as at site 2.
Interpretation. The dominance of coarse gravel at this location (in contrast to sites 1 and 2) is indicative of powerful flows competent to move large rocks. The thin deposits of muddy fine sands and marl indicate shallow water, and the convolutions and granule stringers reflect frequent disturbance by wadi floods or slopewash events. The bioturbation and root casts indicate the deposits were frequently marshy and probably inundated episodically, with the diagenetic properties developing as the section was incised.
Synthesis of the stratigraphy
Here, we draw together our interpretations of the paludal wetland and fluvial stratigraphy. According to our laser rangefinder measurements, the valley floor declines downstream by ~7.1 m from site 2 to site 1 over a linear distance of ~488 m, yielding a mean slope of ~0.015. Sites 1 and 3 are characterised by basal coarse sand and gravel deposits. Most pebbles are variably rounded, indicating fluvial transport, so these deposits predate development of the wetland. The base of site 2 corresponds in elevation (approximately) with marls and sands in site 1, such that the base of site 2 (basal fluvial gravels) is not exposed. The marl and laminated carbonates are indicative of wetland environments; hence, their occurrence above the basal fluvial deposits signals a change in the depositional setting that promoted standing water, at least sporadically, before the valley floor dried out again. In Figure 5, coarse-sand and gravel units higher in the sequences, interbedded with carbonates, also are regarded as fluvial. The thinly laminated or massive sand beds and organic-rich fine sands are presumed to have been deposited in water, as the survival of organic material indicates rapid burial by the sandy units and prevalence of anoxic conditions after burial. Sand beds might be fluvial inwash, slopewash from the neighbouring slopes; both types of deposits occasionally might be reworked by wind if the waterbody dried out.
Overall, the greater proportion of the depositional sequence represents a paludal environment characterised by shallow-water ponding within the backwater of the dam. Water probably was present in this shallow impoundment all year round due to the presence of springs in the valley, as today, but the reservoir shrank and expanded depending on the frequency of rainfall and flash floods. Occasional more energetic floods deposited coarse gravel at the upstream end of the water body, but deposits downvalley typically consisted of fine sands. Sand was deposited primarily as thin laminae, but bar fronts migrated into the wetland, as shown by the presence of low-amplitude cross beds. Sporadic in-wash of sand from upstream blanketed the wetland deposits that redeveloped above each thin sandy layer as and when water levels permitted. The number of paludal units is greater close to the landslide dam; this may reflect persistence of intermittent wetland conditions in the lower reach close to the dam. The absence of any major erosional unconformities or intercalated high-energy gravel beds in the sequence suggests a single damming event was followed by paludal alluviation and then by incision. Lowering of the landslide dam caused thicker units of flood sands to replace, or progress over, the paludal deposits. The top 3.5 m of site 1 may correlate in terms of the stratal packages with the top 4 m at site 2 and the top 1.8 m at site 3; however, correlation lower down in the sections is not evident.
OSL results
The OSL results are summarised in Table 1 and shown in stratigraphic context in Figure 5 (see also Fig. 6). All ages are presented with ± 1 σ. At site 1, three OSL ages from near the base of the 17 m section young upwards from 138 ± 11 ka (GH11), through 117 ± 9 ka (GH12) to 95 ± 8 ka (GH13). The four OSL ages from close to the top of the section also young upwards: 120 ± 8 ka (GH14), 104 ± 11 ka (GH15), 70 ± 6 ka (GH16), and 36 ± 3 ka (GH17)—although we note that samples GH13 and GH14 show a 9 kyr age reversal (for reasons that are unknown). At site 2, an OSL age of 115 ± 8 ka (GH21) is obtained for the base of the exposure, whilst an age of 69 ± 6 ka (GH22) was obtained from near the top of the section. At site 3, an OSL age of 74 ± 7 ka (GH31) was obtained from the upper part of the section 40 cm above the stratigraphic position of lithic artefacts.
(color online) Results of optically stimulated luminescence (OSL) analyses, showing representative examples of growth curves (A and B) and decay curves (C and D) for samples GH22 and GH31, respectively. The growth curves show the dose response Lx/Tx (where Lx is the ratio of the luminescence signal, Tx is the fixed dose). The decay curves of the natural dose (N), regeneration dose (R), and test dose (TD = 12.4 Gy) show the OSL signals decreasing rapidly during the first second of stimulation, indicating that the OSL signal is dominated by the fast component in these samples. Note that in D, the curve N is obscured beneath R4.

Lithic artefacts
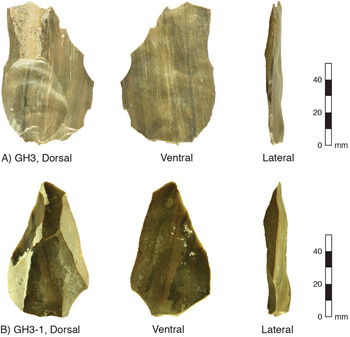
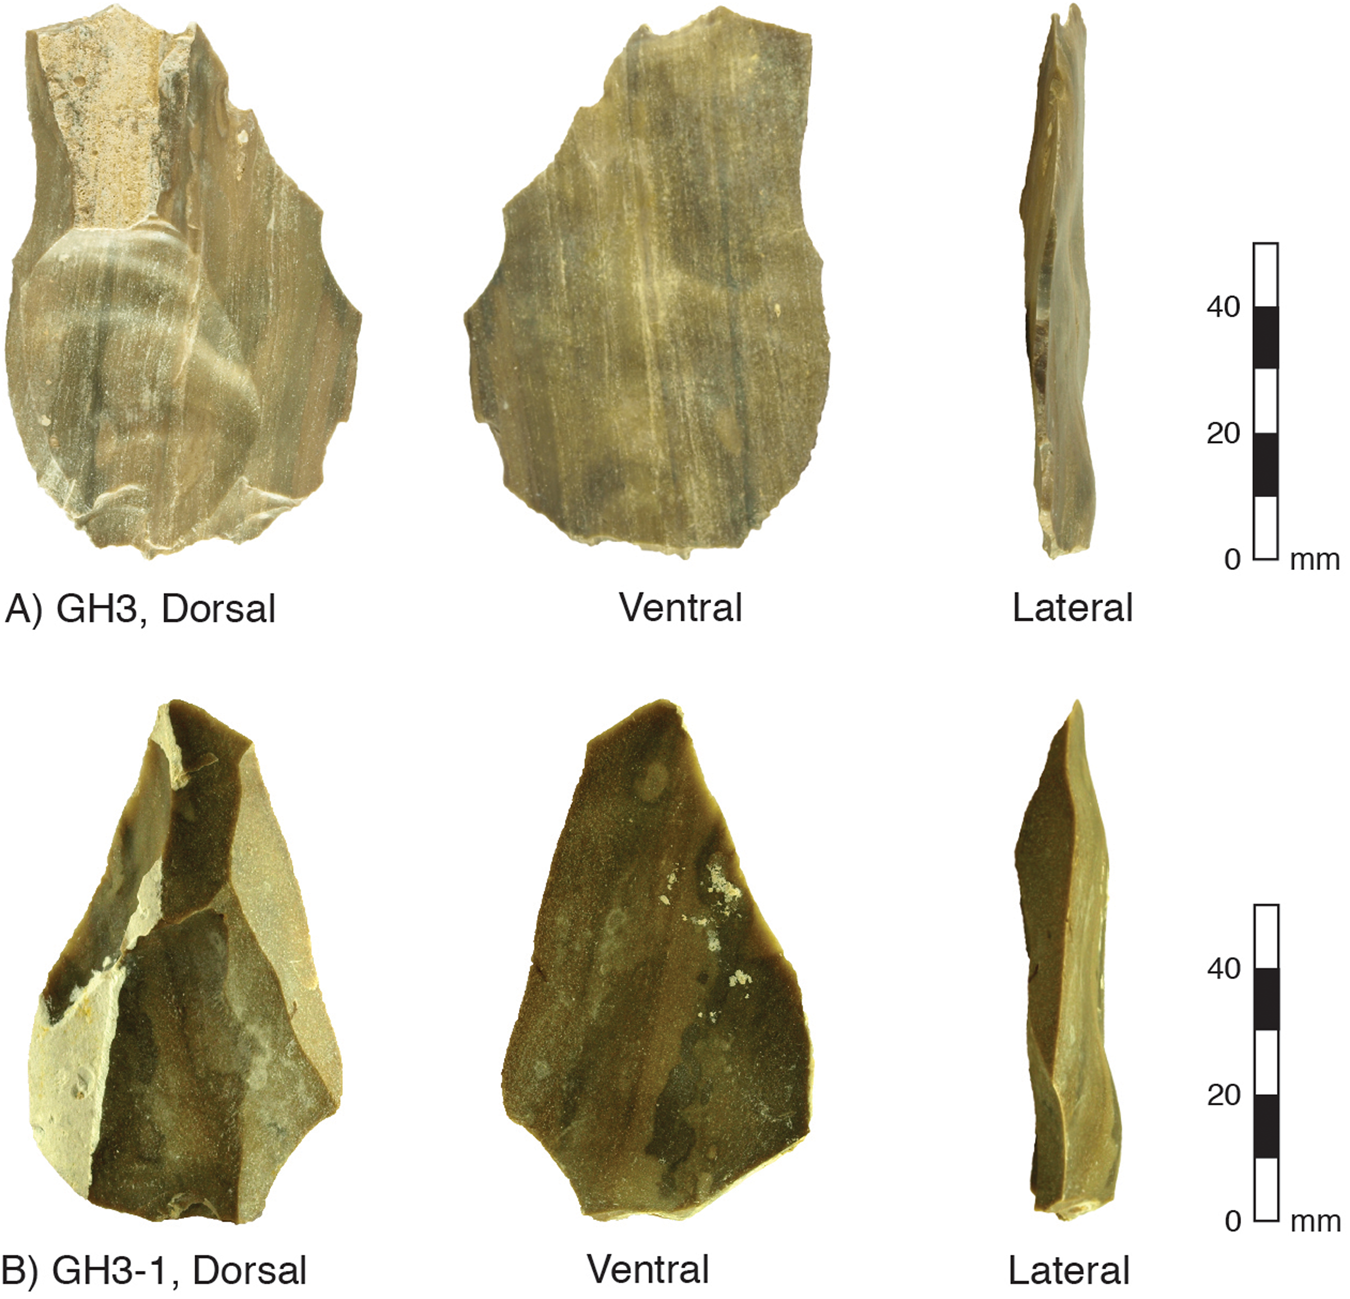
We collected three in situ lithic artefacts from stratified sediments at site 3 (Fig. 5). Two of these artefacts (Fig. 7 A and B) are identified as likely to be flakes associated with the production of Levallois point cores from nearby primary sources (Henry, D.O., University of Tulsa, personal communication, June 1, 2020). The flakes were collected from the marl unit at 1.25 m depth and 45 cm below an OSL sample that yielded a depositional age of 74 ± 7 ka (Fig. 5). This date assigns the Levallois flakes a minimum age within the Middle Palaeolithic, as suggested earlier according to their typology (Henry et al., Reference Henry, Bauer, Kerry, Beaver and White2001; Henry, Reference Henry, Enzel and Bar-Yosef2017).
(color online) Photographs of lithic artefacts collected from site 3 (see also Fig. 2C). (A and B) Levallois flakes associated with the production of Levallois point cores. Both flakes include a faceted striking platform and clear bulb of percussion (see lateral view). The light-coloured zones are calcium carbonate accretions acquired after the flake was buried. An OSL date from 45 cm above these flakes assigns to them a minimum depositional age of 74 ± 7 ka (Fig. 5).
DISCUSSION
We frame our discussion according to the five themes set out in our “Introduction.” (1) Resolve the damming mechanism; (2) reconstruct the environment of deposition associated with the sedimentary archive at Gharandal; (3) determine the timing of the accumulation of the paludal facies based on OSL dating; (4) discuss the palaeoclimatic implications of the Gharandal wetland; and (5) consider the implications of the Gharandal oasis for hominins traversing the Levantine deserts.
Damming origins of the Gharandal wetland
The climatic and geomorphic conditions existing at Wadi Gharandal today fail to explain the ~20-m-thick accumulation of mostly fine-grained paludal sediments extending about 1 km upstream of the rangefront (Braun, Reference Braun2015). Several previous studies point to a blocking mechanism triggering the development of a lake or wetland in the lower reaches of the valley. Henry et al. (Reference Henry, Bauer, Kerry, Beaver and White2001) suggests that localized ponding was the result of the lower gorge becoming intermittently blocked near the rangefront, though no mechanism was specified. Braun (Reference Braun2015) and Ginat et al. (Reference Ginat, Opitz, Ababneh, Faershtein, Lazar, Porat and Mischke2017) linked the damming mechanism to the rocks at the rangefront, and we confirm this hypothesis with the observation that large detached blocks have slipped down a northward-dipping bedding plane on the southern side of the valley (Fig. 4). The landslide blocked the valley exit, and given the proximity to the Dead Sea Transform fault system and high seismicity of the region, it is plausible that the landslide and damming were coseismic and mediated by over-steepened incised valley slopes. The landslide blocks formed a dam that was likely permeable, but also sufficiently stable to trap sediment and allow a wetland to develop in the backwater area until the stream eventually cut through the dam. Incision was probably rapid, although a minor dam of reduced height may have persisted.
Environment of deposition in the Gharandal wetland
The rangefront landslide dam has been removed via fluvial incision (Fig. 4), possibly associated with infrequent large floods. Incision of the dam lowered the local base level and triggered a wave of headward erosion that has subsequently removed much of the stored sediment and continues today in the form of extensive gully networks propagating into the erodible sediment stack (Fig. 2).
The paludal sequence is now incised to the level of the modern valley floor, while remnants preserved along the margins (Fig. 2) provide excellent exposure of valley fill stratigraphy. As noted in the “Results,” the sedimentology and stratigraphy are consistent with episodic or semipermanent presence of groundwater-fed shallow ponds that were recharged from time to time by rainfed channel flows. The absence of shoreline berms excludes the presence of a perennial open body of standing water (Enzel et al., Reference Enzel, Kushnir and Quade2015). Rather, the absence of shorelines is consistent with ephemeral ponding that was not sustained for long periods. The absence of both unconformities and major gravel layers within the paludal sequence can be taken as evidence that incision through the dam was progressive. The lack of a clear stratal correlation between the three sites probably reflects the different positions of the sections within the valley floor amplified by occasional flash floods from upstream, which impose a cut-fill behaviour that is typical of ephemeral desert streams (Jansen and Brierley, Reference Jansen and Brierley2004).
An examination and interpretation of the microfossil assemblage within the valley fill sediments (sampled close to our site 1; see Fig. 5) by Braun (Reference Braun2015) fits well with our sedimentological interpretation of the nature of the water body at Gharandal. In total, Braun identified seven ostracod species: Ilyocypris bradyi, Heterocypris salina, Candona neglecta, Herpetocypris brevicaudata, Scottia pseudobrowniana, Herpetocypris sp., and Psychrodromus sp. This assemblage signifies a low-energy, groundwater-influenced, and spring-fed riverine wetland (Braun, Reference Braun2015; Ginat et al., Reference Ginat, Opitz, Ababneh, Faershtein, Lazar, Porat and Mischke2017; Mischke et al., Reference Mischke, Ginat, Al-Saqarat, Faershtein, Porat, Braun, Rech, Enzel and Bar-Yosef2017), or paludal environment as we prefer to call it. The concentration of ostracods within the 13.0–9.7 m depth interval (Fig. 5) and not throughout the section (Braun, Reference Braun2015) indicates that conditions fluctuated between a mainly paludal versus mainly fluvial environment, presumably in response to a shifting water balance. The switch to predominantly fluvial conditions is reflected in the massive sand beds that dominate the upper 3.4 m of the sequence (Fig. 5) together with the occurrence (at ~3 m depth) of a single ostracod species, C. neglecta, with the capacity to survive long periods of desiccation (Braun, Reference Braun2015); this implies an ephemeral sand-bed stream more so than a wet paludal environment.
Timing of the accumulation of the paludal facies based on OSL dating
Our OSL results bracket the upper and lower parts of the paludal facies, constraining its age between 138 ± 11 ka and 69 ± 6 ka (Fig. 5). The onset of damming and deposition of the paludal facies was between 138 ± 11 ka and 117 ± 9 ka (or expressed as the variance-weighted mean and standard error, 125 ± 7 ka). Overlapping (within ± 1σ) ages of 117 ± 9 ka and 115 ± 8 ka just above the oldest exposed paludal facies at sites 1 and 2, respectively, also support an Marine Isotope Stage (MIS) 5e timing (~125 ka) for the onset of damming. Given these ages, we can derive estimates of accumulation rates. The average accumulation rate for the valley fill at each site varied through time and between sites. At site 1, most of the sequence (14.2 m) was deposited between two overlapping ages: 117 ± 9 ka and 104 ± 11 ka; hence, the accumulation was geologically instantaneous relative to the resolution of the dates. The rapid accumulation at site 1 is the likely result of its proximity to the landslide dam. The rapidity of sedimentation is borne out by comparison with the modern rate of sediment deposition (measured over 20 yr) behind a dam within a small Negev catchment (Schick and Lekach, Reference Schick and Lekach1993). These data indicate that the Gharandal basin could have filled in as little 2500 yr (3 mm/yr on average). Similarly, the basal age at site 2 (115 ± 8 ka) overlaps with the basal age at site 1 (117 ± 9 ka), indicating that the sediment wedge backfilled rapidly. At site 2, from 115 ± 8 ka to 69 ± 6 ka, the average accumulation rate was much slower (~0.15–0.28 mm/yr), presumably because once the sediment wedge reached site 2, the channel profile was regraded to the new higher base level (imposed by the dam) and the accommodation space had diminished.
Unconformities and partial truncation of the sedimentary record are commonly observed in desert fluvial sequences (Jansen and Brierley, Reference Jansen and Brierley2004). We cannot judge the completeness of our three sections, because the strata in the sections do not readily correlate, but the dating of the uppermost units suggests some limited truncation. Nonetheless, we assume that the wetland disappeared shortly after the two youngest (and overlapping) ages we have from the paludal facies: 69 ± 6 ka and 74 ± 7 ka at sites 2 and 3, respectively. Sedimentation continued under conditions that were too dry to sustain a wetland of any great extent. Regarding the timing of valley incision, we refer to the youngest age, 36 ± 3 ka, from the fluvial sediments capping the wetland. It is likely that incision of the landslide dam began shortly after and this led to the dissection of the valley fill as seen today.
Figure 5 presents the previously published OSL and 14C dates (Braun, Reference Braun2015; Ginat et al., Reference Ginat, Opitz, Ababneh, Faershtein, Lazar, Porat and Mischke2017; Mischke et al., Reference Mischke, Ginat, Al-Saqarat, Faershtein, Porat, Braun, Rech, Enzel and Bar-Yosef2017) alongside our series of seven OSL dates from site 1. There is little agreement; just one previous OSL date (112 ± 9 ka, JED-21) is compatible with the interval of rapid accumulation we identify at site 1 (Fig. 5); the other OSL date (32 ± 4 ka, JED-20) appears far too young. The 14C ages all appear to deviate widely and are not stratigraphically consistent with each other—as acknowledged previously (Braun, Reference Braun2015; Mischke et al., Reference Mischke, Ginat, Al-Saqarat, Faershtein, Porat, Braun, Rech, Enzel and Bar-Yosef2017). We speculate that the erroneous OSL age (JED-20) on the laminated carbonates suffers from incorrect dosimetry and that the 14C dates are the result of contamination with younger carbon while saturated within the wetland sediments (see Rosenberg et al., Reference Rosenberg, Preusser, Fleitmann, Schwalb, Penkman, Schmid, Al-Shanti, Kadi and Matter2011, Reference Rosenberg, Preusser, Risberg, Plikk, Kadi, Matter and Fleitmann2013); the oldest 14C date (Poz-53311) is also very close to the limit of the method (e.g., Pigati et al., Reference Pigati, Quade, Wilson, Jull and Lifton2007). Discrepancies between OSL and 14C chronologies are common. For instance, at Mundafan in hyperarid southern Arabia, OSL ages of ~120–88 ka from marly lacustrine sediments yield much younger 14C ages (~45–19 cal ka BP), whereas the Holocene-age materials show good agreement for both methods (Rosenberg et al., Reference Rosenberg, Preusser, Fleitmann, Schwalb, Penkman, Schmid, Al-Shanti, Kadi and Matter2011). Similarly, in the Qaidam basin, Qinghai-Tibetan Plateau, the “shell-bar” sequence yielded an MIS 3 age with 14C, but the OSL age was found to be ~113–99 ka (Lai et al., Reference Lai, Mischke and Madsen2013). The latter authors go on to suggest that 14C dates older than ~24 ka from arid regions may require re-examination.
Palaeoclimatic implications of the Gharandal wetland
The oasis at Wadi Gharandal is groundwater fed via the shallow aquifer in the surrounding alluvial sediments (Ibrahim, Reference Ibrahim1993), hence the discharge of the spring is connected directly to hydroclimate. Yet it is important to recognize that the construction of the significant wetland (~0.17 km2) stemmed from the combination of a positive water balance and the landslide dam. Without the dam being emplaced in early MIS 5, Wadi Gharandal may have resembled what is seen today: a small grove of palms surrounding a chain of shallow spring-fed ponds. Given the absence of major stratigraphic unconformities, we interpret the paludal sequence as being the product of persistent wet conditions from about 125 to 70 ka—nearly the whole of MIS 5 (i.e., 130–71 ka, according to Lisiecki and Raymo [2005]). This conclusion amends the previous interpretation of two wet phases based on a problematic chronology (Braun, Reference Braun2015; Ginat et al., Reference Ginat, Opitz, Ababneh, Faershtein, Lazar, Porat and Mischke2017; Mischke et al., Reference Mischke, Ginat, Al-Saqarat, Faershtein, Porat, Braun, Rech, Enzel and Bar-Yosef2017).
It is important to consider whether the Gharandal oasis reflected wetter conditions due to damming alone or the additional influence of a wetter climate. Although several authors argue for relatively humid conditions throughout MIS 5 in the Levant (Bar-Matthews et al., Reference Bar-Matthews, Ayalon and Kaufman1997, Reference Bar-Matthews, Ayalon, Gilmour, Matthews and Hawkesworth2003, Reference Bar-Matthews, Keinan and Ayalon2019; Vaks et al., Reference Vaks, Bar-Matthews, Ayalon, Matthews, Halicz and Frumkin2007, Reference Vaks, Bar-Matthews, Matthews, Ayalon and Frumkin2010; Waldmann et al., Reference Waldmann, Stein, Ariztegui and Starinsky2009, Reference Waldmann, Torfstein and Stein2010; Frumkin et al., Reference Frumkin, Bar-Yosef and Schwarcz2011; Lazar and Stein, Reference Lazar and Stein2011), the specific timing of the drier and wetter intervals and the degree of wetness remain debated. For example, a variety of independent palaeoclimate proxies are invoked by Torfstein et al. (Reference Torfstein, Goldstein, Kushnir, Enzel, Haug and Stein2015) to argue for sharp climate fluctuations around the last interglacial, with aridity at ~133–128 ka preceding more humid conditions ~128–122 ka, followed again by aridity. The enhanced moisture has been attributed to a range of mechanisms, including a southward shift in the east Mediterranean cyclones and/or intensification of the Red Sea troughs, and incursions from the African monsoon (Vaks et al., Reference Vaks, Bar-Matthews, Ayalon, Matthews, Halicz and Frumkin2007, Reference Vaks, Bar-Matthews, Matthews, Ayalon and Frumkin2010; Waldmann et al., Reference Waldmann, Torfstein and Stein2010; Bar-Matthews et al., Reference Bar-Matthews, Keinan and Ayalon2019; Torfstein et al., Reference Torfstein, Goldstein, Kushnir, Enzel, Haug and Stein2015; Torfstein, Reference Torfstein2019), but whether the hydroclimate was substantially different from the present day is largely unresolved (Torfstein and Enzel, Reference Torfstein, Enzel, Enzel and Bar-Yosef2017; Armon et al., Reference Armon, Dente and Smith2018). Nevertheless, the slope failure that led to the onset of the Gharandal wetland (between 138 ± 11 ka and 117 ± 9 ka) coincided with the beginning of a wetter period, and the persistence of the wetland for the full duration of MIS 5 matches the regional positive water balance according to several climate proxies (Fig. 8). Together with the microfossil data (Braun, Reference Braun2015), the absence of beach deposits or thick lacustrine units at the base of the Gharandal sequence indicate that it was insufficiently wet to support a lake. Shortly after 69 ± 6 ka (Fig. 5), once the dam was breached, the valley floor resumed its predominantly fluvial character. Incision and the final removal of the dam coincided with a drying climate that could no longer sustain spring-fed wetlands, as shown by the increasing dominance of fluvial sediments in the upper parts of the stratigraphic succession. Hence, the termination of the Gharandal wetland ultimately is consistent with evidence for regional climate change from wetter to drier conditions.
(color online) Summary of regional palaeoclimate records in the southern Levant and northern Arabia since 140 ka, showing marine isotope stages (MIS) (Lisiecki and Raymo, Reference Lisiecki and Raymo2005). (A) Human fossils dated at Skhul and Qafzeh, Israel (Grün et al., Reference Grün, Stringer, McDermott, Nathan, Porat, Robertson, Taylor, Mortimer, Eggins and McCulloch2005), and Al Wusta, northern Arabia (Groucutt et al., Reference Groucutt, Grün, Zalmout, Drake, Armitage, Candy and Clark-Wilson2018), indicate the presence of humans in the region during MIS 5. (B) Age bands (neglecting uncertainties) indicating relatively wet conditions in palaeolakes and palaeo-wetlands from the Jordan Plateau and ‘Arabah-Jordan valley: Wadi Gharandal (this study; asterisk indicates the minimum age of lithic artefacts); Qa'a Mudawwara (Petit-Maire et al., Reference Petit-Maire, Carbonel, Reyss, Sanlaville, Abed, Bourrouilh, Fontugne and Yasin2010; Catlett et al., Reference Catlett, Rech, Pigati, Al Kuisi, Li and Honke2017); Qa'a Jafr (Macumber, Reference Macumber, MacDonald, Adams and Bienkowski2002; Davies, Reference Davies2005); Qa'a Azraq (Cordova et al., Reference Cordova, Nowell, Bisson, Ames, Pokines, Chang and Al- Nahar2013); Wadi Hasa (Winer, Reference Winer2010); Jurf Ed Darawish (Moumani et al., Reference Moumani, Alexander and Bateman2003); and Hamra Fadan (Ginat et al., Reference Ginat, Opitz, Ababneh, Faershtein, Lazar, Porat and Mischke2017). (C) Relatively wet conditions associated with freshwater-flood pulses recorded in Gulf of Aqaba corals (Lazar and Stein, Reference Lazar and Stein2011). (D) Sapropels in the eastern Mediterranean (Rossignol-Strick, Reference Rossignol-Strick1985; Grant et al., Reference Grant, Grimm, Mikolajewicz, Marino, Zeigler and Rohling2016). (E) Speleothem δ18O record from Soreq Cave (Bar-Matthews et al., Reference Bar-Matthews, Ayalon, Gilmour, Matthews and Hawkesworth2003). (F) Speleothem activity from central and southern Negev caves depicted as relative frequency of ages versus time (Vaks et al., Reference Vaks, Bar-Matthews, Matthews, Ayalon and Frumkin2010). (G) Dead Sea basin lake levels (Bartov et al., Reference Bartov, Goldstein, Stein and Enzel2003).

The lake-level record of the Dead Sea and its precursors have been a major focus for studies documenting shifts in the regional water balance through time; the record also shows a close connection to global climatic trends (e.g., Bartov et al., Reference Bartov, Stein, Enzel, Agnon and Reches2002, Reference Bartov, Goldstein, Stein and Enzel2003; Bookman et al., Reference Bookman, Bartov, Enzel and Stein2006; Waldmann et al., Reference Waldmann, Torfstein and Stein2010). The late Pleistocene terminal lake is specified by different names through time: Lake Samra (135–75 ka), Lake Lisan (75–12 ka), and the Dead Sea (Holocene) (Fig. 1). The wetland at Gharandal (~125–70 ka) corresponded closely to the period of Samra high lake levels (up to ~320 m below sea level [m bsl]) during the interval ~120–85 ka followed by a fall to ~380 m bsl at 75 ka (Fig. 8)—after which the lake (Lisan) displayed high though fluctuating levels, reaching its maximum highstand of ~160–165 m bsl at ~28 ka (Matmon et al., Reference Matmon, Crouvi, Enzel, Bierman, Larsen, Porat, Amit and Caffee2003; Bookman et al., Reference Bookman, Bartov, Enzel and Stein2006). West of the ‘Arabah-Jordan valley, speleothems likewise record notably wetter conditions during MIS 5 and MIS 3 at Soreq Cave (Bar-Matthews et al., Reference Bar-Matthews, Ayalon, Gilmour, Matthews and Hawkesworth2003, Reference Bar-Matthews, Keinan and Ayalon2019; Vaks et al., Reference Vaks, Bar-Matthews, Matthews, Ayalon and Frumkin2010), a series of caves in the Negev Desert (Figs. 1 and 8) (Vaks et al., Reference Vaks, Bar-Matthews, Ayalon, Schilman, Gilmour, Hawkesworth, Frumkin, Kaufman and Matthews2003, Reference Vaks, Bar-Matthews, Ayalon, Matthews, Frumkin, Dayan, Halicz, Almogi-Labin and Schilman2006, Reference Vaks, Bar-Matthews, Ayalon, Matthews, Halicz and Frumkin2007, Reference Vaks, Bar-Matthews, Matthews, Ayalon and Frumkin2010) and Peqi'in to the north (Bar-Matthews et al., Reference Bar-Matthews, Ayalon and Kaufman1997, Reference Bar-Matthews, Ayalon, Gilmour, Matthews and Hawkesworth2003). Also, during MIS 5 (Fig. 8), humid conditions triggered sapropel development in the Mediterranean (Rossignol-Strick, Reference Rossignol-Strick1985) and freshwater pulses caused coral recrystallization in the Gulf of Aqaba (Lazar and Stein, Reference Lazar and Stein2011).
Evidence for a relatively humid MIS 5 (130–71 ka) is especially striking on the Jordan Plateau (east of the ‘Arabah-Jordan valley; Figs. 1 and 8), which is among the driest part of the southern Levant today. Here, endoreic depressions (known as Qa'a) are sensitive climate amplifiers that host lakes or wetlands during intervals of positive moisture balance (Ginat et al., Reference Ginat, Opitz, Ababneh, Faershtein, Lazar, Porat and Mischke2017). Conditions conducive to paludal wetland or lake development during MIS 5 are reported from Qa'a Mudawwara (Petite-Maire et al., Reference Petit-Maire, Carbonel, Reyss, Sanlaville, Abed, Bourrouilh, Fontugne and Yasin2010), Qa'a Jafr (Macumber, Reference Macumber, MacDonald, Adams and Bienkowski2002), Qa'a Azraq (Cordova et al., Reference Cordova, Nowell, Bisson, Ames, Pokines, Chang and Al- Nahar2013), Wadi Hasa (Winer, Reference Winer2010), and Jurf Ed Darawish (Moumani et al., Reference Moumani, Alexander and Bateman2003) (Fig. 1), although the existence of lakes is disputed (Ginat et al., Reference Ginat, Opitz, Ababneh, Faershtein, Lazar, Porat and Mischke2017; Rech et al., Reference Rech, Ginat, Gentry, Catlett, Mischke, Winer Tully, Pigati, Enzel and Bar-Yosef2017). Of these five sites on the Jordan Plateau, evidence of humid conditions persisting into MIS 4 and early MIS 3 is reported only for Wadi Hasa (Winer, Reference Winer2010) and Jurf Ed Darawish (Moumani et al., Reference Moumani, Alexander and Bateman2003) (Fig. 8). Farther afield in Arabia, sedimentary records from lakes and wetlands also reflect relatively humid conditions during MIS 5—near Jubbah in northern Arabia (Petraglia et al., Reference Petraglia, Alsharekh, Crassard, Drake, Groucutt, Parker and Roberts2011) and at Mundafan and Khujaymah in the south (Rosenberg et al., Reference Rosenberg, Preusser, Fleitmann, Schwalb, Penkman, Schmid, Al-Shanti, Kadi and Matter2011)—followed by the onset of drying after ~75 ka. Thus, the evidence for environmental change at Gharandal is wholly consistent with the regional picture of an overall wetter MIS 5 and drier conditions in MIS 4.
Implications of the Gharandal oasis for hominin migration
Differentiating between palaeolakes and palaeo-wetlands (e.g., Enzel et al., Reference Enzel, Kushnir and Quade2015; Engel et al., Reference Engel, Matter, Parker, Parton, Petraglia, Preston and Preusser2016) is important for reconstructing the magnitude of hydroclimatic change through time; however, the distinction is less critical with regard to freshwater availability for hominins crossing the southern Levantine deserts. Little is known about the reliability or seasonality of the spring at Wadi Gharandal, but the existence of the ‘Ayn Gharandal’ Roman fort (Darby and Darby, Reference Darby and Darby2015) indicates that a semipermanent water supply existed some 1700 yr ago under climatic conditions somewhat wetter than today, but still hyperarid. Given the spring's persistence under hyperaridity, we speculate that the water supply was also sustained during long-term wetter phases in the past.
Of the two potential routes from Africa into the Arabian Peninsula and Eurasia (Armitage et al., Reference Armitage, Jasmin, Marks, Parker, Usik and Uerpmann2011), the southern Levant lies on the northern Nile–Sinai route (Vaks et al., Reference Vaks, Bar-Matthews, Ayalon, Matthews, Halicz and Frumkin2007; Waldmann et al., Reference Waldmann, Torfstein and Stein2010 Frumkin et al., Reference Frumkin, Bar-Yosef and Schwarcz2011; Lazar and Stein, Reference Lazar and Stein2011; Breeze et al., Reference Breeze, Groucutt, Drake, White, Jennings and Petraglia2016). To the north of Gharandal, fossils have been dated at Skhul and Qafzeh to ~130–100 ka and ~100–90 ka, respectively (Grün et al., Reference Grün, Stringer, McDermott, Nathan, Porat, Robertson, Taylor, Mortimer, Eggins and McCulloch2005), while a recent find at Al Wusta in northern Arabia is dated to ~95–86 ka (Groucutt et al., Reference Groucutt, Grün, Zalmout, Drake, Armitage, Candy and Clark-Wilson2018). These are the oldest sites of indubitable human occupation so far discovered, and they mesh well with knowledge of the regional palaeohydrology during the interval 130–85 ka in support of an active northern human migration route (Grün et al., Reference Grün, Stringer, McDermott, Nathan, Porat, Robertson, Taylor, Mortimer, Eggins and McCulloch2005; Vaks et al., Reference Vaks, Bar-Matthews, Ayalon, Matthews, Halicz and Frumkin2007; Rosenberg et al., Reference Rosenberg, Preusser, Fleitmann, Schwalb, Penkman, Schmid, Al-Shanti, Kadi and Matter2011, Reference Rosenberg, Preusser, Blechschmidt, Fleitmann, Jagher and Matter2012, Reference Rosenberg, Preusser, Blechschmidt, Fleitmann, Jagher and Matter2013; Groucutt and Petraglia, Reference Groucutt and Petraglia2012; Engel et al., Reference Engel, Matter, Parker, Parton, Petraglia, Preston and Preusser2016, Roberts et al., Reference Roberts, Stewart, Alagaili, Breeze, Candy, Drake and Groucutt2018; Petraglia et al., Reference Petraglia, Breeze, Groucutt, Rasul and Stewart2019).
There are few sites in the southern Levant in which in situ lithic artefacts have been precisely dated within stratified sediments. The Levallois flakes at Gharandal (Figs. 5 and 7) indicate that humans visited before 74 ± 7 ka—consistent with the Middle Palaeolithic and Early Upper Palaeolithic artefact typologies previously reported from Gharandal (Henry et al., Reference Henry, Bauer, Kerry, Beaver and White2001), and from Gebel Al Maghara and Qadesh Barnea in the northern and eastern Sinai (Fig. 1) (Goldberg, Reference Goldberg1986). Thanks to the relatively humid conditions that characterised much of MIS 5, the arid barrier to human migration was removed, and the southern Jordan/Tabuk corridor into Arabia and Eurasia may have opened via a scatter of lakes and wetlands (Breeze et al., Reference Breeze, Groucutt, Drake, White, Jennings and Petraglia2016). Located at the northern end of this corridor, Gharandal oasis was a potential step along the way during the interval ~125–70 ka. Indeed, Gharandal may have been especially critical for human migration during the arid intervals of early MIS 5 documented from Dead Sea cores (Torfstein et al., Reference Torfstein, Goldstein, Kushnir, Enzel, Haug and Stein2015).
CONCLUSIONS
We have reconstructed the origin, sedimentary environment, and depositional age of a ~20-m-thick valley fill at Wadi Gharandal and considered its place among other sites of human activity in the Levant–Arabia region. Our key findings are outlined below.
Wadi Gharandal supported a Pleistocene riverine wetland oasis, resulting from a combination of positive water balance and damming due to a landslide at the rangefront.
Based on ten OSL analyses on samples collected from three sedimentary sections, we estimate that the riverine wetland existed from ~125 to 70 ka, followed by a period of mainly infrequent fluvial aggradation and then dam removal and valley-fill dissection somewhat after 36 ± 3 ka.
The depositional ages at Gharandal match regional climate proxies in the Levant and Arabia, indicating relatively humid conditions during MIS 5.
Lithic artefacts collected from stratified sediments at Gharandal are dated to a minimum age of 74 ± 7 ka (Middle Palaeolithic) consistent with previous relative dating by artefact typology (Henry et al., Reference Henry, Bauer, Kerry, Beaver and White2001).
Located at the northern end of the southern Jordan/Tabuk corridor (Breeze et al., Reference Breeze, Groucutt, Drake, White, Jennings and Petraglia2016), the Gharandal oasis was a potential gateway for humans into Arabia and Eurasia during the interval ~125–70 ka.
ACKNOWLEDGMENTS
This project was funded by the deanship of scientific research, University of Jordan, and supported by grant-in-aid from the Council for British Research in the Levant. For valuable discussion, we thank K. Moumani, Jordan Ministry of Energy and Mineral Resources, E. Makhlouf, Hashemite University, Jordan, and G. Jarar, University of Jordan. We thank D.O. Henry, University of Tulsa, for kindly providing his expertise with identifying the Levallois flakes, and L.M. Gibbs, University of Wollongong, for devising photographs of the lithics and for fieldwork assistance. We thank M.D. Petraglia for a generous review together with Quaternary Research editors D.B. Booth and J.R. Dodson.