INTRODUCTION
Organisms can vary dynamics of energy allocation to maximize fitness in different habitats. Here we address questions about the balance of resource allocation, energy storage, and resource partitioning among physiological functions in fluctuating environments.
In starfish, a well individualized storage organ involved in the energy trade-offs is easily identifiable, the pyloric caecum. If in the asteroids the reproduction is cyclic, the temporal pattern of the pyloric caeca can vary according to the environment. The energy allocation between the pyloric caeca and gonads or body wall may show considerable variations between populations of the same species or between years in the same population (for a review, see Lawrence & Lane, Reference Lawrence, Lane, Jangoux and Lawrence1982). The main factors assumed to cause these fluctuations are food availability and salinity (Lawrence & Lane, Reference Lawrence, Lane, Jangoux and Lawrence1982; Menge, Reference Menge1986).
Asterias rubens (Linnæus, 1758) is the most abundant starfish in the north-east Atlantic and can also be found in the north-west Atlantic (synonymous with Asterias vulgaris, see Clark & Downey, Reference Clark and Downey1992; Wares, Reference Wares2001). Like many other starfish, A. rubens is a top predator which frames its ecosystem by carrying out a top-down control on its preys, mainly bivalves and barnacles (Menge, Reference Menge1976; Saier, Reference Saier2001; Buschbaum, Reference Buschbaum2002). Gametogenesis of Asterias rubens has been studied extensively (Jangoux & Vloebergh, Reference Jangoux and Vloebergh1973; Schoenmakers et al., Reference Schoenmakers, Colenbrander, Peute and van Oordt1981, Reference Schoenmakers, Goedhart and Voogt1984). Its reproductive cycle is annual and includes a long agametogenic phase, called the resting phase. Gametogenesis begins in the autumn and the gonads fill the coelomic cavity just before spawning in the spring. During the resting phase, pyloric caeca store nutrient reserves like lipids and carbohydrates, mainly glycogen. These compounds are translocated to the gonad allowing gametogenesis and vitellogenesis (Jangoux & Van Impe, Reference Jangoux and Van Impe1977; Oudejans & van der Sluis; Reference Oudejans and van der Sluis1979a, Reference Oudejans and van der Sluisb; Oudejans et al., Reference Oudejans, van der Sluis and van der Plas1979). The spawning period is short and defined in time (Vevers, Reference Vevers1949; Jangoux & Vloebergh, Reference Jangoux and Vloebergh1973; Barker & Nichols, Reference Barker and Nichols1983; Nichols & Barker, Reference Nichols and Barker1984; Menge, Reference Menge1986). A reciprocal relationship between the size of the gonads and the pyloric caeca occurs in intertidal populations (Jangoux & Vloebergh, Reference Jangoux and Vloebergh1973; Jangoux & Van Impe, Reference Jangoux and Van Impe1977; Barker & Nichols, Reference Barker and Nichols1983; Nichols & Barker, Reference Nichols and Barker1984) but no clear pyloric cycle was found in some subtidal populations (Barker & Nichols, Reference Barker and Nichols1983; Nichols & Barker, Reference Nichols and Barker1984; Menge, Reference Menge1986). This absence of nutrient storage in the pyloric caeca was attributed to low food availability. With starvation, pyloric caeca are reduced in size due to both consumption of reserves (fast process) and autolysis of the organ (slow process) (Jangoux & Van Impe, Reference Jangoux and Van Impe1977). A cessation of somatic growth during gonadal growth has been reported in a natural population (Guillou, Reference Guillou and Jangoux1980). Most of these conclusions were drawn from studies on one or two populations from the same geographical area. Comparisons were made with other studies in the literature, which used different units of measurement (volume, wet and dry weight) and starfish of different sizes. As a consequence no statistical comparisons were carried out and differences in energy allocation between populations were only tentatively explained. Moreover, nothing is known on the effect of abiotic factors on energy allocation in this species. Consequently, the patterns of energy allocation and their sensitivity to the environment are rather poorly understood in this ecologically very important species (see review in Menge, Reference Menge, Jangoux and Lawrence1982).
The aim of the present study is to compare, with the same methods, several populations of A. rubens from a wide geographical range and from contrasting habitats in order to determine the main factors controlling reproduction and energy allocation in this species. Effects of emersion and salinity variations were tested under experimental conditions to interpret in situ observations.
MATERIALS AND METHODS
Study site
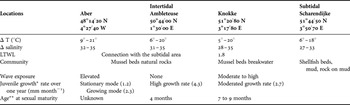
The study was conducted at 3 intertidal locations and 1 subtidal location chosen to represent a wide range of environmental situations over a relatively broad geographical range (Figure 1). The subtidal population is located in Scharendijke (Grevelingenmeer, The Netherlands). Among the 3 intertidal populations, Knokke (Belgium) is also located in the Southern Bight of the North Sea, Ambleteuse (France) in the Eastern English Channel and Aber (France) in the Iroise Sea (Brittany). All of these locations are known to have supported a stable starfish population from several decades (Jangoux & Vloebergh, Reference Jangoux and Vloebergh1973; Guillou, Reference Guillou and Jangoux1980). Intertidal populations were chosen on a latitudinal gradient; they differ in their environment and population dynamics. These differences were described by Guillou et al. (Reference Guillou, Joly-Turquin, Leyzour, Pernet and Dubois2011). Briefly, in Ambleteuse and in Knokke, the food resource is abundant. The Knokke environment is more stressful as salinity varies and the starfish population is more often emerged (Table 1). Compared to Ambleteuse, juvenile growth rate is lower in Knokke and maturity age is delayed. In Aber, due to wave action, starfish are confined to a pebble bed where food is scare and starfish density is high. This results in competition for food and a mode of juveniles that showed no growth. The subtidal location in Scharendijke is situated in a closed branch of the Scheldt River. The water content is frequently renewed by a system of sluices which ensures good water quality and offsets freshwater input. Starfish are found from 1 to 15 m of depth. Between 1 and 3 m they are scattered on oyster beds (mainly Crassostrea gigas) and slipper limpet beds (Crepidula fornicata). At greater depths the slope increases and starfish aggregate on boulders or in rock areas. Despite water renewal, Ulva spp. blooms every year, during which time starfish can be found on the algal mat. Starfish were observed eating various prey including bivalves, gastropods, decapods, tunicates and fish carcasses. During the field study no clear recruitment was observed, preventing the assessment of growth parameters in this population.
Location of the study sites on the north-west coast of Europe.

Characteristics of the environment and population dynamics in the studied locations.

LTWL, low tide water level (m) at which the intertidal populations are totally emerged; Δ T (°C), temperature range (from January to August); Δ salinity, annual salinity range. Salinity and temperature were established from measurements at low tide in the intertidal locations and at 2 m depth in the subtidal location. *, from Guillou et al., Reference Guillou, Joly-Turquin, Leyzour, Pernet and Dubois2011; **, from Joly et al., Reference Joly, Guillou, Dubois, Féral and David2003.
Sampling
Each location was visited monthly. Starfish from the intertidal locations were collected by hand at low tide. Starfish from Scharendijke were collected from between 1 and 15 m deep by SCUBA-divers. Knokke and Aber were first visited in March 2000, Scharendijke in October 2000 and Ambleteuse in January 2001. Scharendijke and Ambleteuse populations were followed until the end of May 2002, Aber population until July of the same year and Knokke population until April 2004. At each location, 20 starfish of the same size- class, 35–45 mm ray length (mature size, Joly et al., Reference Joly, Guillou, Dubois, Féral and David2003) were collected on each visit. In Scharendijke, the same number of starfish from a second size-class, 50–60 mm ray length, was also collected. Ray length, the length of the longest ray from the mouth to the tip, was measured to the nearest millimetre using Vernier callipers.
Laboratory analysis of samples collected
With the exception of specimens from Aber, starfish were collected and immediately dissected in the laboratory. Gonads and pyloric caeca were removed and the body wall was carefully cleaned. During the two first years of the study (March 2000 to June 2002), one hemigonad of the 5 first females was fixed in Bouin's liquid (without acetic acid) for histological preparation. The starfish from Aber were frozen and stored at –20°C before dissection. No fixation for histology was carried out on this population because freezing greatly altered the tissue. For all starfish, body compartments were dried separately at 60°C for 48 hours and weighed. Pyloric and gonad indices were calculated as follows: organ index = organ dry weight/body wall dry weight. The organic matter content of the body wall was assessed monthly in 2001 samples. Dried body walls were ashed at 450°C for 4 hours and weighed again to calculate their ash-free dry weight. Histological samples were embedded in paraffin, sectioned (7 µm thickness) and stained with Masson trichrome coloration. Digital pictures of the histological preparations were taken with a CCD camera (QImaging Micropublisher and QCapture software). For each female, the diameters of 50 oocytes, whose nucleus and nucleolus were in the plane of section, were manually measured with ImageJ1.23 software. As the gametogenic cycle of Asterias rubens is well known (Jangoux & Vloebergh, Reference Jangoux and Vloebergh1973; Schoenmakers et al., Reference Schoenmakers, Colenbrander, Peute and van Oordt1981, Reference Schoenmakers, Goedhart and Voogt1984), histological observations were focused on the few months that included the maximal gonad index in order to determine the maximal mean diameter of oocytes, the timing of spawning through both the presence of individuals that had spawned (sensu Jangoux & Vloebergh, Reference Jangoux and Vloebergh1973), and the decrease of the mean oocyte diameter.
Experimental studies
Starfish were fed mussels of suitable size determined using the relation established by Sommer et al. (Reference Sommer, Meusel and Stielau1999). At the end of each experiment, the starfish were dissected and organ indices were calculated as described previously.
EFFECT OF EMERSION
The effect of emersion was tested over three months (November 2002 to February 2003, see Guillou et al., Reference Guillou, Joly-Turquin, Leyzour, Pernet and Dubois2011) on juveniles (collected in October 2002 at Knokke, 23.2 ± 4.3 mm ray length). They were placed in 2 closed systems of 200 l using the same water stock with a permanent flow of recycled water in a cold chamber. Each system was composed of 3 aerated aquaria (20 starfish per aquarium), a filtering unit (gravel and activated charcoal). Salinity, pH and NO3− concentrations were measured every day. When NO3− concentration levels rose above 0.3 mg/l, the seawater content of both systems was renewed. One of the systems was designed to allow emersion of the starfish. Emersion periods were adjusted to the periods when the natural Knokke population was emersed. In the second system, the starfish were kept immersed continuously. Seawater temperature was 10–12°C during the first three weeks and then 6°C. Salinity was adjusted to 34–35 psu. In both systems, starfish were fed ad libitum with mussels and the number of mussels eaten was estimated. One starfish died in the emersion system and three starfish that had body wall necrosis were removed from the immersion system.
EFFECT OF SALINITY VARIATION
The effect of salinity variation was tested on juveniles (collected in September 2003 at Aber, 24.5 ± 2.3 mm ray length) maintained in five experimental systems for 15 days. The open system (OS: control) was continuously supplied with water from the Bay of Brest (France). The 4 closed systems (100l) had a continuous flow of recycled natural seawater and a filtering unit of activated charcoal. At each salinity change (VS30 and VS26), the water of the four closed systems (VS, variable salinity and CS, constant salinity) was renewed using the same water from the Bay of Brest (for abbreviations, see Figure 8). The water temperature of the systems was maintained at 18°C. In each system, 20 starfish of the same size and weight were placed in a 30-l aquarium, each starfish in individual compartments. At the beginning of the experiment, an additional 20 starfish of the same size and weight were dissected and their organ indices were calculated. At J0, each starfish was provided with 10 mussels. At each seawater change, the number of mussels consumed was counted and replaced by mussels of the same size. No mortality took place.
Modelization of the changes in the organ indices
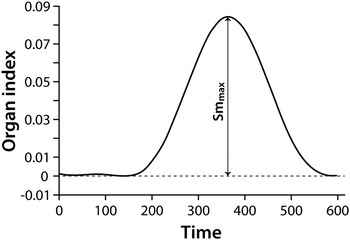
Fourier spectra were used to detect if the temporal variations of organ indices were cyclic and to assess the frequency and amplitude phases of these cycles. Measurements, i.e. both organ indices, consisted of discrete samples of a continuous signal. In order to construct a Fourier transform, the sampling period, Ts, has to be constant (i.e. an exact number of days). Therefore, a linear interpolation algorithm was used. If any periodic event was highlighted in the gonad index data by the Fourier transform, the original datasets were sub-sampled to isolate the different peaks in the signal, i.e. peak of both organ indices during one reproductive cycle. A reproductive cycle was defined as the period from post-spawning of year x to post-spawning of year x + 1. In order to obtain a standardized measure of the amplitude of each peak (Figure 2), they were each modelled by a Fourier series of h harmonics
 $$Sm = A_0 + \sum\limits_{i=1}^h \left[A_i \cos \lpar i\omega \times t\rpar + B_i \sin \lpar i \omega \times t\rpar \right]\eqno\lpar 1\rpar$$
where Sm is the model of the data, A 0 the mean of the data, A i and B i the coefficients of the i harmonic, ω the phase, and t the sampling time. The estimated parameters are grouped in a vector θ of n θ parameters composed of A 0, h couples of (A i, B i ) and ω.
Calculation of the amplitude (Smmax) of the organ index by the fitted model. The X axis represents the time in number of days.

A matching model was carried out on the original non-interpolated sampled data to increase the accuracy of the method. The standard deviation of the samples differed from date to date (Figure 5). Therefore, a weighted least square criterion, which takes individual uncertainties into account, was optimized. This way, a miss-match on one observation with low uncertainty is more penalized than one with high uncertainty. The optimization was performed using a Newton–Gauss algorithm (for details see Pintelon & Schoukens, Reference Pintelon and Schoukens1996).
The choice of the optimum number of harmonics that had to be matched to the data was done via the calculation of a modified minimum description length (MDL) model selection criterion for short data sets (De Ridder et al., Reference De Ridder, Pintelon, Schoukens and Gillikin2005). For a chosen value of h, the number of fitted parameters n θ and the number of degrees of freedom, γ, are: nθ = 2h + 2 and γ = N − n θ.
The amplitude of Sm, Sm max, was estimated using a numerical algorithm which evaluated Equation 1 at the optimized parameters values. The uncertainty on Smmax is given by:
 $$\Delta Sm_{\max } = \Delta Sm\lpar t_\max \rpar = \sum\limits_{i=1}^h {\Delta \theta \times \left({\displaystyle{{\partial Sm\lpar t_\max \rpar } \over {\partial \theta }}} \right)} ^2$$
where Δθ are the variances of the estimated parameters θ. They are given by the matching procedure. Peak modelling and amplitude calculation were performed with Matlab software.
Statistical analysis
To compare the n independent calculations of the amplitude of gonad indices (x 1, x 2,…, x n) as determined by the Fourier transform, the following test was used. It is based on the calculation of the radius, r, of the theoretical hyper-sphere that would include all x i, if H 0 were true (H 0: equality of all x i). From the n amplitude values, n–1 independent differences between one fixed measurement, x j, and the others can be calculated. After normalization of the differences by their standard deviation, n–1 independent normally distributed random variables, z i, with mean 0 and standard deviation of 1 are obtained.
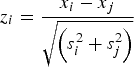 $$z_i = \displaystyle{{x_i - x{}_j} \over {\sqrt {\left({s_i ^2 + s_j ^2 } \right)} }}$$
To test whether or not the original n values (x 1,…, x n) have the same mean value we verified if:
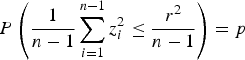 $$\eqalign{P & \left({\displaystyle{1 \over {n - 1}}\sum\limits_{i=1}^{n - 1} {z_i ^2 \leq \displaystyle{{r^2 } \over {n - 1}}} } \right)= p}$$
with P at a given confidence level. 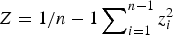 $Z = \displaystyle{1 / {n - 1}}\sum\nolimits_{i=1}^{n - 1} {z_i ^2 }$ followed a χ2 distribution from which
 ${{r^2 } / {n - 1}}$ can be calculated at P = 0.95 confidence level. If H 0 was rejected, paired comparisons of x i were conducted, following the same procedure.
To compare the maximum levels of gonad index and the average values of pyloric index at the onset of gametogenesis, several one-way analyses of variance (ANOVAs) were performed: comparison between size-classes in Scharendijke, comparisons between reproductive cycles in each population and comparisons between populations during two reproductive cycles. Prior to statistical analysis, organ indices were arcsin-transformed in order to meet the assumptions of normality and equal variance (Zar, Reference Zar1996).
To compare the maximal mean diameters of oocytes between size-classes in Scharendijke, 2 two tailed Mann–Whitney rank comparison were performed following the procedure described by Conover (Reference Conover1980), one test for each reproductive cycle. Comparisons between populations (35–45 size-class) were also performed for each reproductive cycle by the mean of a Kruskal–Wallis rank comparison; quantiles for 3 small size samples were obtained from Conover (Reference Conover1980).
To compare the mean levels of organic matter in the body wall in 2001, several ANOVAs were performed: comparison between size-classes and months in Scharendijke (two-way ANOVA), comparisons between months in the other populations (one-way ANOVA) and comparison between populations (35–45 size-class, one-way ANOVA). Prior to statistical analysis, organic matter content was arcsin-transformed (Zar, Reference Zar1996).
For the tidal influence experiment, differences in organ indices were tested by a nested ANOVA with ‘experimental conditions’ and ‘aquaria nested in experimental conditions’ as factors. For the salinity experiment, differences in organ indices were tested by one-way ANOVA. Prior to statistical analysis, organ indices were arcsin-transformed (Zar, Reference Zar1996).
When several statistical comparisons were performed with the same dataset, or a part of it, Bonferroni criterion was used and α was divided by the number of comparisons.
RESULTS
Field study
REPRODUCTIVE INVESTMENT AND SPAWNING PERIOD
In Ambleteuse and Scharendijke, starfish from the required size-classes were not always found, which resulted in a reduced sample size or missing gonad and pyloric data (Figure 3). Too many data were missing for the Ambleteuse population to allow Fourier transforms to be calculated.
Monthly values of gonad and pyloric indices in Aber, Ambleteuse, Knokke (starfish of 35–45 mm ray length) and Scharendijke (starfish of 35–45 and 50–60 mm ray length). All values are mean ± standard deviation (6 ≤ N ≤ 30). Notice the time scale is different for Knokke data (from February 2000 to 2004 versus 2000 to 2002).

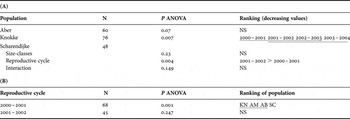
In the other populations, Fourier transform confirmed the annual periodicity of the gonad cycle (Figures 3 & 4). The gonad index increased in autumn or early winter (from October in Knokke and from December in Aber, Ambleteuse and Scharendijke: onset of gametogenesis) and reached a maximum in late winter or spring (February to May: maturity period). The drop in the gonad index indicated the spawning period which took place over one or two months. After spawning the gonad index remained low during the summer (agametogenic period). Reproductive investment was estimated by the maximal values of gonad index (GImax) and by the amplitude of the fitted model on each peak of gonad index (Smmax). The GImax varied without a reproducible or clear trend according to the reproductive cycle and station considered (Table 2).
Fitted model on the gonad index peaks in Aber, Knokke and Scharendijke each year. The X axis represents the time in number of days since the beginning of the analysis (Aber: 8 March 2000; Knokke: 6 June 2000; Scharendijke: 19 October 2000). Each peak was modelled by a Fourier transform of h harmonics, h being determinate by minimum description level selection criterion for short data sets.

Statistical comparison of the maximum gonad index (GImax): (A) between reproductive cycles in each population (indicated by the years); (B) between populations (35–45 mm starfish) during the 2000–2001 and 2001–2002 reproductive cycles (analysis of variance (ANOVA) and subsequent Tukey multiple mean comparison test).

GImax from reproductive cycle (years) or populations (Aber (AB), Ambleteuse (AM), Knokke (KN) and Scharendijke (SC)) that are underlined do not significantly differ (α = 0.01; due to application of Bonferoni criterion). NS, not significant.
As for a model of 1 harmonic (h = 1), the number of fitted parameters is 4, the peaks composed of 4 samples or less cannot be modelled (Knokke in 2000 and Ambleteuse in 2002). In several cases the calculated amplitudes (Smmax) were greatly different from the GImax (in Knokke and Scharendijke samples, Table 3). Furthermore, the uncertainty on the amplitude is in most cases lower than the standard deviation of the observed maximum gonad index. As a consequence, statistical analysis of the amplitude was more discriminant than that of the GImax (Table 4).
Fitted amplitude (Smmax) compared to the maximum value of the gonad index (GImax) during different reproductive cycles.

Smmax±is its uncertainty; GImax ± is its standard deviation; N, number of sampling points; H, number of harmonics in the model; df, degrees of freedom; C, cost function of the fitted model.
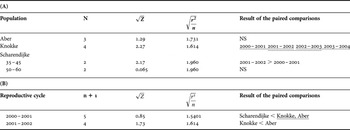
Statistical comparison of the fitted amplitude of gonad index: (A) between reproductive cycles in each population (indicated by the years); (B) between populations (35–45 mm ray starfish) during the 2000–2001 (Aber, Ambleteuse, Knokke and Scharendijke) and 2001–2002 annual reproductive cycles (Aber, Knokke and Scharendijke).

That are underlined do not significantly differ (α = 0.01; due to application of Bonferoni criterion). NS, not significant; n, number of samples;  $\sqrt Z$, test statistic;
 $\sqrt {\displaystyle {r^2 / n}}$, quantile.
In Knokke, a decreasing trend was evident from 2001 to 2004. In 2001, the amplitude was significantly lower in Scharendijke than in Knokke and Aber, while in 2002, it was significantly lower in Knokke than in Aber. No statistical difference was found between size- class in Scharendijke (N = 2 and 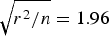 $\sqrt {r^2 / n} = 1.96$ for both reproductive cycles,
 $\sqrt Z = 1.16$ and 0.81 in 2000–2001 and 2000–2002 respectively).
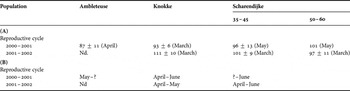
The decrease in the mean oocyte diameter and the presence of spawned individuals in the populations were concomitant with the decrease of the gonad index (Table 5). Maximal mean oocyte diameter did not differ between populations (35–45 mm ray length starfish) (Kruskal–Wallis rank comparison, α = 0.01, α smaller than 0.05 are due to the applications of the Bonferoni criterion, see Materials and Methods). In Scharendijke, maximal mean oocyte diameter did not differ between size-classes for both reproductive cycles (two tailed Mann–Whitney rank comparison, α = 0.01).
(A) Maximal mean diameter of oocytes observed in the northern populations (mean ± standard deviation, 2 ≤ number of female ≤ 5) during 2 reproductive cycles; (B) timing of spawning period in these populations.

In parentheses, month of the observation; ?, unknown date; Nd, not determined due to very small sample.
FLUCTUATIONS IN THE PYLORIC INDEX
In Aber and Scharendijke populations, the Fourier transform showed no periodic fluctuation in the pyloric indices. In Knokke, the Fourier transform highlighted four to five periodic phenomena (Figure 5). During the first three years of study (from April 2000 to April 2003) fluctuations in the pyloric index were inversely correlated with those of the gonad index (Spearman rank correlation coefficient = –0.66, N = 31, 0.001 < P < 0.005). After the 2003 spawning period, the pyloric index presented two maxima surrounding the 2004 spawning, but did not correlate with the gonad index (Spearman rank correlation coefficient = –0.058, N = 13, P > 0.25).
Fluctuation of the pyloric index in Knokke: Fourier transform and subsequent model fitting over each reproductive cycle. The X axis represents the time in number of days since 30 June 2000.

PIgam (pyloric index at the onset of gametogenesis, mean value of pyloric indices from October to December) was lower during the 2003–2004 reproductive cycle (one-way ANOVA, P > 10−6). Over the first two reproductive cycles, PIgam was higher in Knokke than in the other populations and 2001–2002 PIgam was higher than 2000–2001 PIgam in all the populations (Table 6). In Scharendijke, PIgam was higher in the 50–60 mm ray length starfishes (one-way ANOVA, P = 0.001) than PIgam of starfish of smaller ray length. Pyloric indices when the gonad index was maximum, such as when starfish were mature (PImat, mean value of pyloric indices from February to May, depending on the population) were the highest in Ambleteuse and the lowest in Knokke. No differences appeared between the two reproductive cycles (2000–2001 and 2001–2002) but there was a significant interaction between the two factors (population and reproductive cycles) mostly due to the higher PImat during the 2000–2001 reproductive cycle in Scharendijke.
Statistical comparison of the pyloric index values at the onset of gametogenesis (PIgam, October to December) and at the moment of maximal gonad index (PImat, February to May) from 2000 to 2002 (periods when the 4 stations were concomitantly sampled) (35–45 mm ray starfish) (analysis of variance and subsequent Tukey multiple mean comparison test).

1, no 35–45 mm starfish in Ambleteuse at that period of the reproductive cycle. Juvenile recruited in July reach this size-class around November. Populations Aber (AB), Ambleteuse (AM), Knokke (KN) and Scharendijke (SC)) or reproductive cycle (years) that are underlined are not significantly different (α = 0.01 for PIgam and α = 0.05 for PImat).
ORGANIC MATTER IN THE BODY WALL
The mean percentage of organic matter in the body wall of the 35–45 mm ray length starfish was significantly different among populations (one-way ANOVA, P < 10−8, N = 543 starfish, Figure 6). Starfish of each population were ranked in the following order: Ambleteuse > Knokke > Aber > Scharendijke (Tukey multiple mean comparison test, α = 0.01).
Monthly percentages of organic matter in the body wall (mean ± standard deviation) of starfish from the four populations studied in 2001. (A) Starfish of 35–45 and 50–60 mm ray in Scharendijke (6 ≤ N ≤ 20); (B) starfish of 35–45 mm ray in Aber (AB), Ambleteuse (AM) and Knokke (KN) (6 ≤ N ≤ 20). ↔ , indicates the onset of gametogenesis.

In Scharendijke, the percentages of organic matter in the body wall were higher in the 50–60 than in the 35–45 mm starfish; in both size-classes it was lower during the gametogenesis (autumn) (two-factor ANOVA, P < 10−4 for factor size-class, P = 10−6 for factor month, P = 0.592 for the interaction between both factors, N = 192 starfish). In Aber, it was higher in July than in December and January (one-way ANOVA, P < 10−2, N = 174 starfish). In Knokke and Ambleteuse, the percentages of organic matter in the body wall did not fluctuate (one-way ANOVA, respectively P 0.136, N = 155 starfish and P = 0.076, N = 89 starfish).
Experimental study
EFFECT OF EMERSION
The pyloric index was significantly higher under immersed condition (P ANOVA < 10−4) but there was a statistical difference between the three aquaria under each condition (‘aquaria nested in system’ factor, P ANOVA = 0.01) (Figure 7). The gonad indices presented low values under both conditions and they were not statistically different (P ANOVA = 0.91). The percentage of starfish that developed gonads was higher under the immersed condition (47 ± 3%, N = 57) than under the emersion/immersion condition (19 ± 8%, N = 59).
Gonad and pyloric indices (mean ± standard deviation) of starfish reared under partial emersion (according to the tidal rhythm in Knokke, N = 59) and constant immersion (starfish were never emerged, N = 57). Histogram bars sharing the same superscript are not significantly different (Tukey test, α = 0.05).

EFFECT OF SALINITY VARIATIONS
As the experiment was conducted in September, gonads were not developed in the starfish and only pyloric indices were calculated. During the 15 days of the experiment, the pyloric index increased significantly in all systems except in VS26 (starfish exposed to a salinity of 26 during 10 hours and 34 during 14 hours) (multiple mean comparison test of Dunnett, P = 0.060) (Figure 8). No statistical difference was found between experimental conditions (P ANOVA = 0.049, P Tukey multiple mean comparisons > 0.05).
Pyloric index (mean ± standard deviation, N = 20) of starfish at the beginning (J0) and at the end of the experiment of salinity variations and table of the used abbreviations (from Guillou et al., Reference Guillou, Joly-Turquin, Leyzour, Pernet and Dubois2011). Histogram bars sharing the same colour as the histogram bar of J0 are not statistically different from J0 (Dunnett test, α = 0.05).

DISCUSSION
In this study, Fourier transform was used to determine objectively if the organ indices presented cyclical fluctuations, to identify the periods of maximum organ development and to provide a measurement of reproductive investment. Fourier transform demonstrated cyclic fluctuations in the gonad index from 3 on the 4 studied populations. The population from Ambleteuse would require more data to be described by this method. It should be noted also that Fourier transform cannot model asymmetric peaks which could be a biological reality when some environmental or biological clue induces synchronous spawning in a population. In the present study, this seems to have been a minor drawback, except maybe, in Knokke data from 2002–2003 and 2003–2004. The pyloric index temporal trend was different; indeed Fourier transform indicated cyclic changes in only one population. This different energy allocation pattern will be discussed below in the light of the environmental characteristics and experimental results.
With regards to the gonad cycle, major discrepancies between amplitudes of the fitted model (Smmax) and the observed maximum gonad index (GImax) occurred when the latter showed a large standard deviation. This was due to the modelling procedure used which decreases means associated with elevated standard deviations and was one of the strong points of the use of Fourier transform. Amplitudes of the fitted model have a lower error than the observed GImax which is only based on the sample of this precise date. As a consequence, GImax is more prone to a sampling artefact than a modelling taking the whole series of data into account. Furthermore, Fourier transform provides a compound Smmax even if the samplings resulted in 2 peaks (with a not significantly lower value in between), in which case, the visual inspection will arbitrarily choose one of these. Consequently, modelling reduces the uncertainty of the measure of energy investment in the gonads and allows a better discrimination between different cycles or populations (Tables 4 & 5). Thus, the following discussion was based on statistical comparisons of fitted amplitudes.
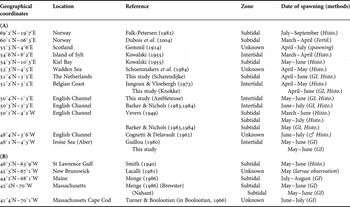
The spawning period of Asterias rubens has been reported to occur later in northern populations (Nichols & Barker, Reference Nichols and Barker1984). According to our observations, spawning took place from April to June in Knokke and Scharendijke and began one month later in southern populations of Ambleteuse and Aber. Spawning dates recorded in the present study are presented together with those from previous studies in Table 7. No trend between spawning date and latitude appears. In areas that have been extensively studied such as the English Channel (Vevers, Reference Vevers1949; Cognetti & Delavault, Reference Cognetti and Delavault1962; Barker & Nichols, Reference Barker and Nichols1983; Nichols & Barker, Reference Nichols and Barker1984) and Massachussets (Turner & Boolotian in Boolootian, Reference Boolootian and Boolootian1966; Menge, Reference Menge1986) spawning periods were not synchronized within the different populations even when they were studied at the same time. This suggests that spawning is dependent on local conditions (salinity, temperature, depth or hydrodynamism), rather than on a latitudinal gradient.
Spawning period in (A) populations along the East Atlantic coast; (B) populations along the West Atlantic coast. Methods used include histological observation (Histo.) generally of the ovaries but also from testis (♂ Histo.), gonad index measurement (GI), natural spawning observation (spawning) and fertilization assays (Fertil.).

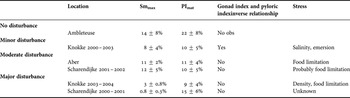
Reproductive investment (amplitude of the fitted model on the gonad index) and energy storage patterns in the pyloric caeca varied according to the reproductive year and between populations. We interpret these variations as being due to different levels of stress (including food limitation) according to location and year (Guillou et al., Reference Guillou, Joly-Turquin, Leyzour, Pernet and Dubois2011) (Table 8).
Resource allocation in the starfish of the 4 areas studied from 2000 to 2004. The stresses were deduced from Guillou et al. (Reference Guillou, Joly-Turquin, Leyzour, Pernet and Dubois2011).

Smmax, fitted amplitudes of gonad index; PImat, pyloric index before spawning; No obs.; no observation.
Starfish from Ambleteuse presented a high pyloric index all year round. Reproductive investment was the highest of the four populations studied and gonads grew without apparent use of nutrients stored in the pyloric caeca. Organic matter storage even occurred in the body wall. Moreover juvenile growth was high in this population and during their first autumn they reached sexual maturity size (Guillou et al., Reference Guillou, Joly-Turquin, Leyzour, Pernet and Dubois2011). Concomitantly with the onset of gametogenesis, growth rate of these new adult starfish decreased but did not stop (Guillou et al., Reference Guillou, Joly-Turquin, Leyzour, Pernet and Dubois2011). All this was linked with high food availability and low or no disturbance in energy acquisition (no salinity variations, limited emersion periods due to the location of the population in the lowest part of the intertidal zone).
In Knokke, during the first three reproductive cycles studied, gonad development was concomitant with a decrease in the pyloric index indicating a requirement for nutrients stored in the latter for gametogenesis. We suggest that salinity variations due to the estuarine location of the Knokke population and to large periods of emersion resulted in some stress in this population, limiting food uptake, as indicated by laboratory experiments (see below) and reported in other species (Harrold & Pearse, Reference Harrold and Pearse1980; Shirley & Stickle, Reference Shirley and Stickle1982; Forcucci & Lawrence, Reference Forcucci and Lawrence1986). Our laboratory experiment indicated the influence of frequent emersion on energy allocation. In this experiment where emersion timing was adjusted to the periodicity observed for the Knokke population, the pyloric index was lower in starfish under intermittent immersion condition compared to that of starfish reared under permanent immersion condition. The feeding rate was also lower because starfish did not eat during emersion periods (Guillou et al., Reference Guillou, Joly-Turquin, Leyzour, Pernet and Dubois2011). However, the growth rate was the same in both conditions (Guillou et al., Reference Guillou, Joly-Turquin, Leyzour, Pernet and Dubois2011). This suggested that juveniles exposed to emersion disturbance allocated most of their nutrient intake towards growth and maintenance and little or none to the pyloric caeca. An influence of salinity variation on energy storage in the pyloric caeca was only evident during intermittent exposure to low salinity (i.e. 26). In this experimental condition, the pyloric index remained at the same level during the whole experiment, while it increased for starfish reared at constant exposure to a salinity of 26 and for all other salinity conditions. In the same experiment, constant or intermittent exposure to a salinity of 26 resulted in a decreased growth rate linked to a reduced food intake compared to starfish reared at a constant salinity of 34 (Guillou et al., Reference Guillou, Joly-Turquin, Leyzour, Pernet and Dubois2011). Echinoderms are unable to osmoregulate extracellularly, causing their fluid volume to increase or decrease depending on the external salinity (Stickle & Diehl, Reference Stickle, Diehl, Jangoux and Lawrence1987). This forces them to regulate intracellular ionic concentrations, a process expensive in energy (Lawrence, Reference Lawrence, Keegan and O'Connor1985). This could explain the lack of energy storage under intermittent exposure to low salinity. In other starfish species, exposure to low salinity for a longer period resulted in a reduced food intake combined with a reduced growth and energy storage and a lower absorption efficiency (Shirley & Stickle, Reference Shirley and Stickle1982; Forcucci & Lawrence, Reference Forcucci and Lawrence1986). Our experiment was probably too short to affect energy storage in starfish exposed to constant low salinity.
Starfish from Aber and Scharendijke (2001–2002) showed low and constant pyloric indices. Organic matter of the body wall was low and decreased during gametogenesis. However, reproductive investment was similar to that of the other populations. This indicates that, in these cases, energy was allocated to gonad development and growth with no storage in the pyloric caeca. The food available to the studied size-class (35–45 mm ray length) was probably limited. In Aber, starfish were exposed to strong competition for food. As a consequence, the ray length of about 70% of the individuals did not exceed 30 mm (Guillou et al., Reference Guillou, Joly-Turquin, Leyzour, Pernet and Dubois2011). In Scharendijke, we hypothesize that small prey items suitable for the 35–45 mm ray length size-class were not abundant. No recruitment was observed during the entire study period (Joly-Turquin, personal observations).
Finally, starfish in both Knokke in 2003–2004 and Scharendijke in 2000–2001 showed low pyloric indices and low reproductive investments. Onset of sexual maturity was even delayed in the latter case. The origin of the disturbance in Scharendijke is unknown. In Knokke, poor gonad development occurred in a cohort which showed abundant recruitment in summer 2003 and, consequently, a severe competition for food, as previously reported by Nichols & Barker (Reference Nichols and Barker1984) in a subtidal population. It is noteworthy that despite the severe food shortage, maturing starfish produced eggs of comparable size to the concomitantly studied populations.
Previous studies pointed out considerable flexibility in starfish energy allocation. Observations of gonad index (GI) and pyloric index (PI) changes have frequently reported an inverse correlation between gonad and pyloric caecum size in starfish but this relationship was not always clear. Barker & Nichols (Reference Barker and Nichols1983) for Marthasterias glacialis (Linnæus, 1758) then Nichols & Barker (Reference Nichols and Barker1984) for Asterias rubens showed that ‘food limited’ subtidal populations from the English Channel had pyloric and gonad indices significantly lower than those of intertidal populations. In intertidal populations gonad and pyloric caecum cycles were inversely correlated contrary to the subtidal populations where pyloric caeca showed little variation. The use of the Fourier model would have been able to statistically demonstrate the assumed absence of reciprocity in the physiological indices of these subtidal food limited populations. The values and patterns of these indices were just like those observed here in the Aber populations. On the contrary, Lawrence (Reference Lawrence1973) for Luidia clathrata (Say, 1825), then Menge (Reference Menge1986) and Raymond et al. (Reference Raymond, Himmelman and Guderley2007) for Asterias vulgaris (Verrill, 1866) thought that continuously abundant food might lead to the absence of cycle in the pyloric caeca which remain continuously large. Such a pattern was illustrated in this study by the starfish from Ambleteuse. However, high food availability can also lead to an inverse correlated cycle when food availability is seasonal as for Plutonaster bifrons (Wyville Thomson, 1873), a deep-sea starfish (Tyler et al., Reference Tyler, Gage, Paterson and Rice1993). This scenario did not appear in this study. Contrary to the observations of Barker & Nichols (see above), the offshore populations of Sclerasterias mollis (Huton, 1872) from New-Zealand showed higher GI and PI than the inshore ones (Barker & Xu, Reference Barker and Xu1991). In both populations, GI and PI had, however, an inverse relationship. This would imply that, if food availability was higher for the deeper populations, these offshore food resources remained, however, relatively limited. This scenario was close to that of Knokke. However as in Knokke, one year did not follow the general plan: no inverse relationship was observed in the offshore males. This seemed also due to changes in some environmental parameters. The decrease in seawater temperature and unusually high salinities had affected primary productivity and thus food availability.
In conclusion, food availability appears as the essential factor that controls energy allocation in Asterias rubens illustrated here by the reciprocity between GI and PI cycles corresponding to the transfer of nutrients from a storage organ to gonads. Food would act directly or following variations in the physical environment. Interestingly, in this study only severe food shortage would affect reproductive investment, indicating that energy was preferentially allocated to gonads, a characteristic of r-strategy. Abiotic factors such as emersion and salinity might affect nutrient storage in the pyloric caeca but with no significant impact on reproductive investment. The magnitude of resource allocation to gonads may greatly change from year to year in the same population. This observation emphasizes the need for long studies and prevents generalizations (for instance between intertidal and subtidal, southern and northern populations) as attempted by some authors. Asterias rubens populations were clearly able to respond to this fluctuating environment maintaining a reproductive output of apparently similar quality but not quantity.
ACKNOWLEDGEMENTS
Ph. Dubois is a Senior Research Associate of the National Fund for Scientific Research (NFSR, Belgium). Research supported by Belgian federal research programmes (SSTC, contracts MN/11/30 and EV/11/23A); a CGRI–FNRS–CNRS cooperation agreement; and by French Research Ministry grant for PhD in co-supervision. Experiments conducted during this study comply with the current laws of France and Belgium. The authors gratefully acknowledge John Lawrence for critical reading of the manuscript and thank Monique Briand (UBO) for her help in the preparation of figures. The authors also thank the anonymous referees for their helpful criticisms.