The World Bank provides more than $8 billion in loans annually to support electrification in developing countries. The projects have increased access in mainly rural areas, although 1.3 billion people remain without electricity. An impetus for these loans is the view that electricity greatly improves rural life (World Bank Reference Bank2008). Nevertheless, our understanding of the benefits of rural electrification is limited by the short period over which the effects have been observed. Assessments are also hampered by selection bias, since investments are often targeted to specific districts (World Bank Reference Bank1994). The period 1930 to 1960 in the United States provides an exceptional opportunity to study the effects of rural electrification. Fewer than 10 percent of rural households in the United States had electricity in 1930, but by 1960 nearly all homes had electric lighting and a variety of electric appliances (Carter, Gartner, Haines, et al. Reference Carter, Susan, Gartner and Haines2006, 4–351). In addition, the timing of the rollout was influenced by power plant openings that were largely independent of rural demand, allowing for clearer identification of the causal relations.
There is little consensus on the effect of electricity and household appliances on infant health, women's fertility, and the participation of married women in the workforce. Some authors focus on effects that were driven by changes in families' allocation of time. Joel Mokyr (Reference Mokyr2000), for example, argues that the time saving associated with modern household technologies was reallocated towards investments in household hygiene and child health. Consistent with this view, Price Fishback and Carl Kitchens (Reference Fishback and Kitchens2015) find that Rural Electrification Administration (REA) loans led to decreases in infant mortality rates from 1935 to 1940. Jeremy Greenwood, Ananth Seshadri, and Guillaume Vandenbroucke (Reference Greenwood, Seshadri and Vandenbroucke2005) apply an overlapping-generations macroeconomic model to time series and cross country data, concluding that the new household technologies contributed to the baby boom. Martha Bailey and William Collins (Reference Bailey and Collins2011), on the other hand, find that within county changes in appliance ownership were negatively related to fertility. Greenwood, Seshadri, and Mehmet Yorukoglu (Reference Greenwood, Seshadri and Vandenbroucke2005), using an approach similar to Greenwood, Seshadri, and Vandenbroucke (Reference Greenwood, Seshadri and Vandenbroucke2005), find that labor-saving household technologies increased women's participation in the labor market. Although not specifically addressing labor force participation, Valerie Ramey (Reference Ramey2009) finds almost no change in the time women spent in home production from 1930 and 1960, while Joshua Lewis (Reference Lewis2016) concludes that the participation effects were limited to second-generation women who were raised in homes with electricity. There is little debate that electricity dramatically reduced the time required for housework; still, the question remains: What impact did the time saving have on other features of family life?
In this article, I study the impact of rural electrification on fertility and infant mortality. Specifically, I examine the relationship between increases in the proportion of households with electricity and changes in fertility and infant mortality rates in a large sample of rural counties from 1930 to 1960. To address issues of endogeneity, I construct an alternative measure of rural electricity access—county-centroid distance to the nearest large power plant—based on a digitized dataset of more than 1,000 large power plant openings over the same period. Historians, supported by a variety of documentary evidence, have concluded that where these large plants were located was not based on rural demand. Much larger urban demand, the incentive to develop a more interconnected and reliable power grid, and geological/hydrological constraints were the main factors that influenced the siting of these large power plants. These conclusions are supported by a number of robustness tests. In particular, the analysis shows that current changes in economic conditions in rural areas do not predict future power plant openings. Still, although large power plants were not built specifically to service rural areas, proximity to a plant played a critical role in determining whether a rural community gained access to electricity. The empirical analysis is based on a county fixed effects framework that uses both within county changes in the fraction of homes with electricity and within county changes in distance to power plants to study the effects of rural electrification on infant mortality and women's fertility.
Rural electrification led to large reductions in infant mortality. Between 1930 and 1960, increases in electricity access accounted for 15 to 19 percent of the decline in the infant mortality rate in the sample of rural counties. On the other hand, electrification had little impact on fertility. The coefficient estimates are negative and generally not quantitatively important, suggesting that, in rural areas at least, the modernizing effects of electricity were not the main drivers of the baby boom. These results are robust to a range of specifications and controls, including New Deal spending and WWII mobilization. They also do not appear to be driven by better access to hospitals, migration, or improvements in agricultural productivity.
The reduced-form results for rural electrification reflect a combination of the health benefits that arose both inside and outside the household. Access to modern household technologies freed women's time from basic housework, which may have led to increased investments in children's health (Mokyr Reference Mokyr2000). The improvements in infant health are consistent with the nature of the technologies associated with electricity, especially washing machines and pumped water, which improved hygiene. The health benefits are estimated to have been particularly large in counties that had lower baseline sanitation, and where, as a result, the potential gains from improved hygiene were greatest. Electrification led to smaller reductions in mortality in states that had previously invested heavily in promoting better household hygiene practices, suggesting that modern technologies and maternal education were substitute inputs to infant health. Rural electrification may also have lowered infant mortality through channels outside the household. These indirect health benefits could have included improved labor market opportunities for rural workers, better access to medical care, and improved water quality in rural areas.
This article contributes to the literature on the historical impacts of household modernization in the United States. Bailey and Collins (Reference Bailey and Collins2011) find a negative relationship between household modernization and women's fertility. Because their analysis relies on differences in the timing of appliance adoption across counties, however, endogeneity in the decision to modernize could lead their estimates to be downward biased. In particular, improvements in local economic opportunities might simultaneously have led to reductions in women's fertility and increased purchases of modern labor-saving appliances. This article addresses this concern, using power plant distance as an alternative measure of access to electricity and these new household technologies.Footnote 1 The findings support the main conclusions of Bailey and Collins (Reference Bailey and Collins2011) that advances in household technology were unlikely to have been a driver of the baby boom, and suggest instead that one of their main impacts was to improve infant health.
Fishback and Kitchens (Reference Fishback and Kitchens2015) study the effects of rural electrification on a range of outcomes including infant mortality and women's fertility, finding that REA loans for rural electrification from 1935 and 1940 led to decreases in rural infant mortality but had little impact on fertility over that period. These estimates, based on a five-year time-horizon, may not capture the full benefits of electrification, which occur gradually as consumers purchase modern appliances.Footnote 2 This article expands on this research, studying these relationships over an extended 30-year time period, when rural customers were more able to fully respond to this new technology. Moreover, the empirical analysis is based on direct measures of electricity access rather than REA lending for electricity infrastructure. Thus, from a policy perspective the quantitative estimates can be readily compared to the effects of modern rural electrification programs in developing countries.
This research adds as well to a literature on the impact of the electricity infrastructure on rural areas both in the U.S. historically and in the developing world. There is a growing body of work that examines the effects of rural electrification on agricultural output (Rud Reference Rud2012; Fishback and Kitchens Reference Fishback and Kitchens2015), economic activity (Lipscomb, Mobarak, and Barham 2013), and female employment (Dinkelman Reference Dinkelman2011; Lewis Reference Lewis2016). This article, by contrast, focuses on the non-market effects, specifically the effects on fertility and health. It shows that electrification provided large benefits to rural households that might not be captured by standard economic measures.Footnote 3
HISTORICAL CONTEXT
The Electricity Rollout in Rural Areas
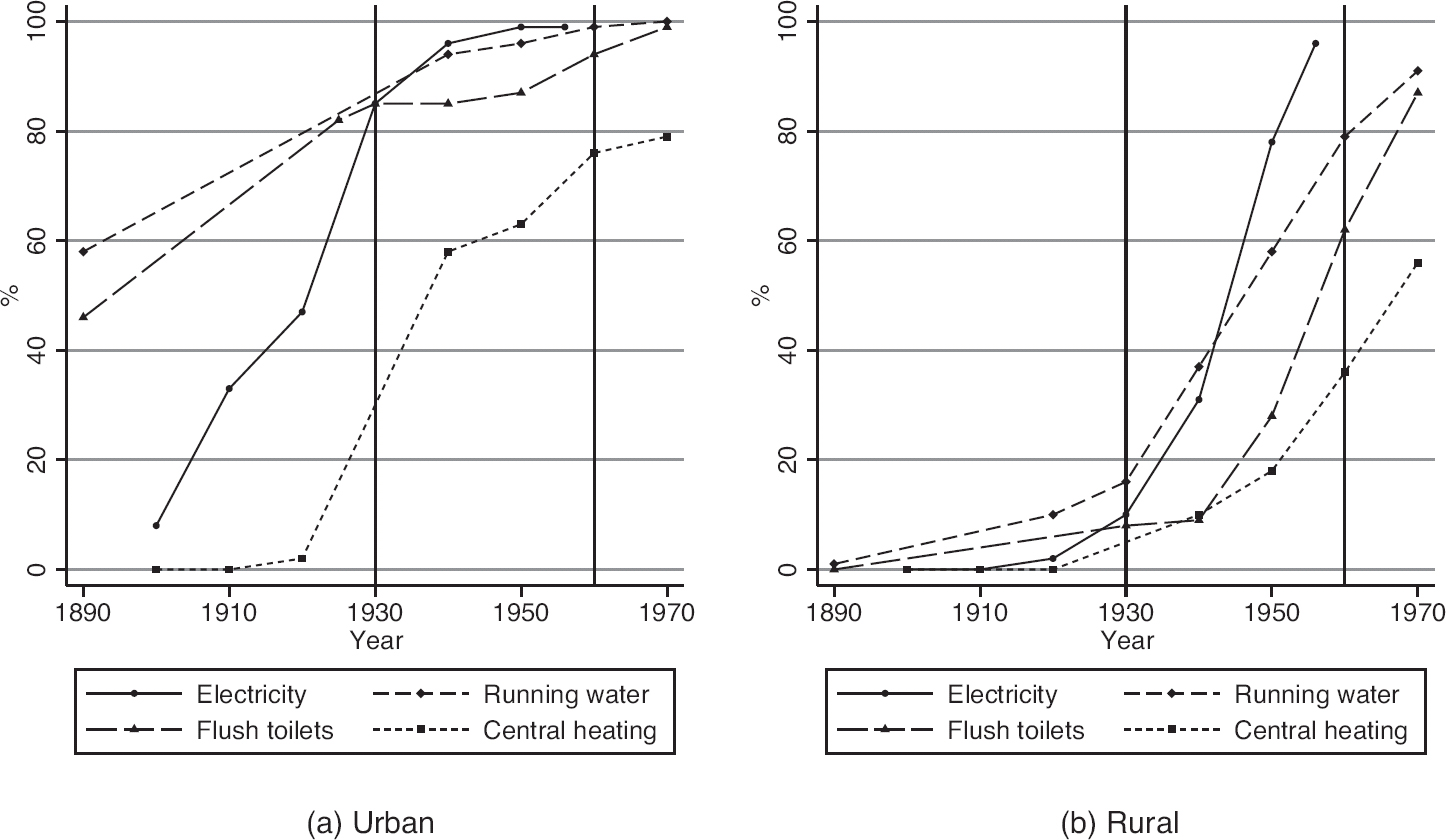
By 1930 more than 80 percent of urban homes had electricity, running water, and flush toilets (see Figure 1a). In contrast, just 10 percent of rural households had electricity in 1930, even fewer had flush toilets, and the share with running water was under 20 percent (see Figure 1b). Over the following 30 years, the gap that had emerged, especially in electricity access, was largely eliminated. In 1960 more than 90 percent of rural homes had electricity and 80 percent had running water, provided by electric pumps.
HOUSEHOLD RESIDENCES WITH BASIC FACILITIES, 1890–1970 (PERCENTAGE)

The delay in rural electrification was due fundamentally to two factors: demand and cost. During the early twentieth century residential demand for electricity was limited largely to lighting; electrical appliances were just being developed and were hardly used because of their high price and poor quality. As a result, residential consumption of electricity through the 1920s remained low, reducing the attractiveness to utilities of the residential market. Private utility companies were particularly averse to incurring the cost of infrastructure in rural areas, where the cost per customer was much greater. As one publication described, “A mile of distribution line can serve 50 to 200 customers in a city; in the country the average is three customers to a mile” (General Electric Digest April 1925).Footnote 4
During the 1930s, the barriers to rural electrification began to fall. Major federal projects such as Bonneville Dam in the Pacific Northwest and many of the activities of the Tennessee Valley Authority (TVA) expanded access to large numbers of rural residents. By 1952, the TVA was operating in 175 counties and seven states sold wholesale electricity to municipalities and rural electric cooperatives (Kitchens Reference Kitchens2014, p. 392). The REA was established in 1935 to provide, among other services, low-interest loans to help finance the distribution of power lines to rural areas. Over the next 25 years, the REA funded more than 1.4 million miles of lines that serviced more than 4.8 million rural customers (Carter, Gartner, Haines, et al. Reference Carter, Susan, Gartner and Haines2006, 4–1103–04).
As industrial demand for power declined during the Depression, electric utility companies increasingly sought out new residential customers. As one leading industry manual put it: “Interest has centered in the home this year… Because of the Depression, neither factory, store, nor office has presented a hopeful field for rapid development” (Electrical World 1935, p. 60). The extension of the rural network was made possible in part by technological innovations that reduced the cost of providing distribution lines by almost 60 percent during the 1930s (Rural Electrification Administration 1938, p. 57). Lower appliance prices, improvements in their quality, and access by consumers to low-interest loans through the Federal Housing Administration (FHA), encouraged more households to acquire appliances. The effect over the period 1930–1960 was a seven-fold increase in electricity consumption per household (Carter, Gartner, Haines, et al. Reference Carter, Susan, Gartner and Haines2006, 4–351). Greater electricity usage raised the return to utilities of providing power.
There were large regional differences in the timing of electrification across rural counties.Footnote 5 Even as the median electrification rate rose from 30 percent in 1930 to 48 percent in 1940 to 85 percent in 1950, wide cross-county differences in electricity access persisted. The difference in electrification rates between rural counties at the 95th and 5th percentile was 74 percentage points in 1930, 71 percentage points in 1940, and 42 percentage points in 1950.
The timing of rural electrification was determined in large part by proximity to the existing grid. REA loan approval depended on the projected cost of projects, and so its officials favored those projects that could make use of nearby power grids (Slattery Reference Slattery1940, p. 58). Private electric utilities also had an incentive to provide power to rural areas close to a grid, since they were responsible for constructing and maintaining transmission and distribution lines. As a result, the expansion of the electric grid between 1930 and 1960 led to non-uniform decreases in the cost of providing electricity to rural households.
The Expansion of the U.S. Power Grid, 1930–1960
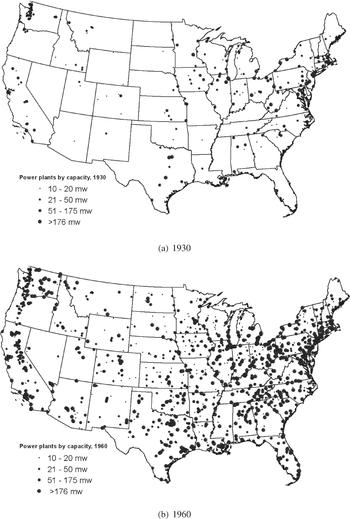
The extension of the system of power plants is illustrated in Figure 3, which shows the location and capacity of plants for the decennial years 1930 to 1960. The figure is based on a series of maps produced in 1962 by the United States Federal Power Commission (1963). The location of power plants with at least 10 megawatts of nameplate capacity was digitized and supplemented with information on the timing of plant openings. There were distinct regional patterns in the extension of electricity infrastructure. The systems in the U.S. Northeast and in California were already quite developed by 1930, but very few plants had been built in the South and Midwest. Over the next 30 years, more than 1,000 power plants were constructed, and by 1960 there was coverage throughout the country.
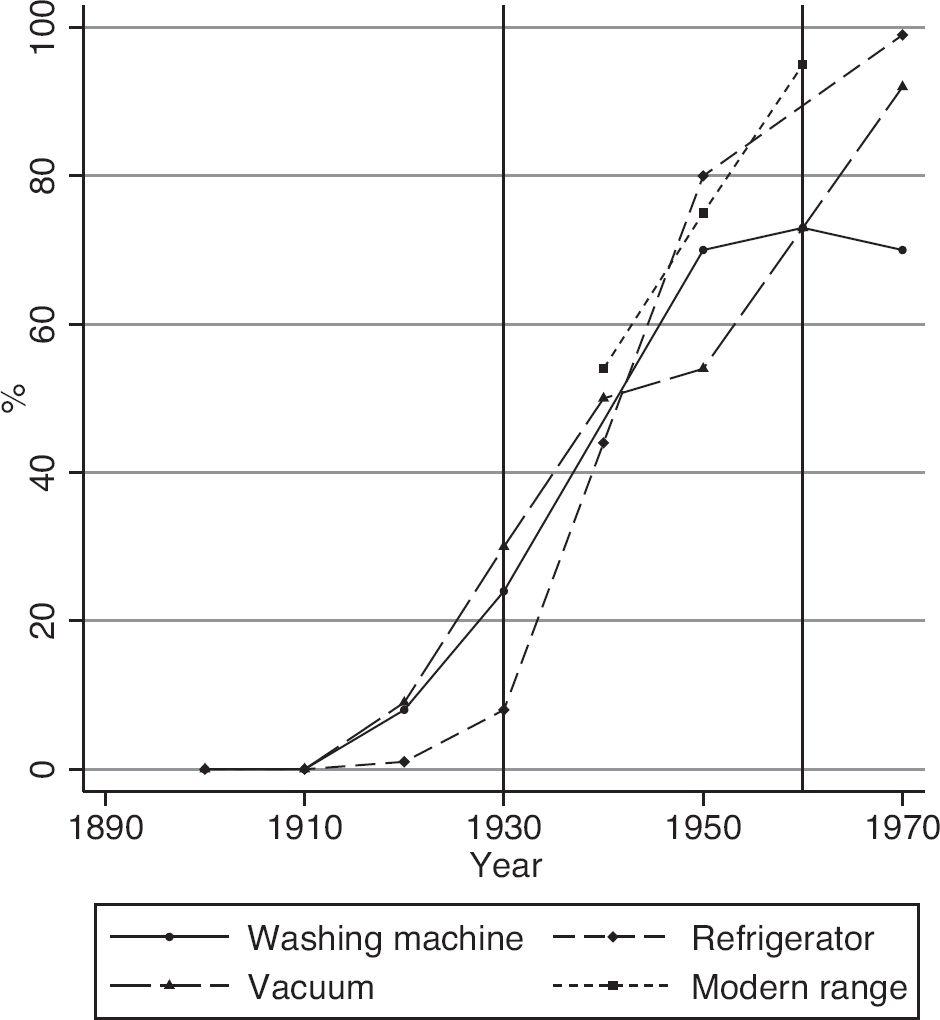
HOUSEHOLD RESIDENCES WITH MODERN APPLIANCES, 1890–1970 (PERCENTAGE)

LOCATION AND CAPACITY OF POWER PLANTS, 1930 AND 1960

The geographic pattern of new power plant openings was driven by several different factors. Beginning in the 1920s, electric utilities began integrating power plants into an interconnected grid that supplied multiple markets, allowing them to smooth across local peaks in demand and improve reliability of services (Hughes Reference Hughes1993, p. 324). As transmission technology improved, power plants were increasingly sited on the basis of cost considerations.Footnote 6 A 10-megawatt coal-fired power plants would have burned roughly 166 tons of coal per day, thus proximity to a source of fuel was an important determinant of plant operating costs.Footnote 7 Coal-fired power plants also needed to locate near a large body of water for coolant.Footnote 8 Topography played a key role in the siting of hydroelectric plants, and improvements in transmission allowed producers to take advantage of new sources of hydroelectric potential. In a summary of numerous technical reports from the 1920s, Hughes (Reference Hughes1993, p. 370) argues that an important objective in the siting of large power plants was “massing generating units near economical sources of energy and near cooling water,” and “transmitting electricity to load centers” using high voltage transmission lines.Footnote 9
Decisions over where and when to open large power plants were unlikely to have been influenced by rural demand. Given historical electricity consumption on the farm, and low rural population densities, rural demand accounted for a small fraction of the total electricity produced. For example, the median power plant in the sample produced seven times more electricity than could have been consumed by rural customers.Footnote 10
Rural Electrification, Housework, Fertility, and Infant Health
Electricity allowed households to make use of a variety of new consumer durables. Between 1930 and 1960 the proportion of homes with an electric refrigerator rose from 8 percent to 90 percent, and there were similar increases in the use of washing machines, vacuum cleaners, and electric ranges (see Figure 2). These appliances greatly reduced the time required for basic housework, especially in rural areas. A federal study of a half-million farm households found that the average family used 1,400 gallons of well-drawn water per week. In the absence of an electric pump, household members walked more than 30 miles and spent more than 10 hours per week simply collecting water (Luff Reference Luff1940, p. 9). According to a 1901 survey, women carried more than 40 pounds of coal per day and spent almost one hour per day caring for a coal-fired stove (Massachusetts Bureau of Statistics and Labor Reference Wadlin1901, p. 11). And rural housewives without electricity spent more than 11 hours per week washing and ironing clothes (United States Department of Agriculture 1944; Wilson Reference Wilson1929).
Modern appliances reduced the time required for basic household tasks; but, perhaps surprisingly, there did not appear to have been an associated reduction in the total time devoted to home production (Ramey Reference Ramey2009). This phenomenon is sometimes referred to as the “Cowan Paradox,” following Ruth Cowan's (Reference Cowan1983) analysis of housework.Footnote 11 One explanation for the “Cowan Paradox” is that labor-saving technologies led to increased family size, resulting in more time spent on child rearing (Greenwood, Seshadri, and Vandenbroucke Reference Greenwood, Seshadri and Vandenbroucke2005).Footnote 12 Mokyr (Reference Mokyr2000) argues, instead, that even though fertility rates were not increased, women spent more time on childcare and health.Footnote 13 Following Mokyr, we would expect that the greater investment per child should have coincided with better health-related outcomes, given the strong link between parental time and child health (Baker and Milligan Reference Baker and Milligan2008; Miller and Urdinola Reference Miller and Piedad Urdinola2010).
In fact, the household technologies led to a range of benefits to child and, especially, infant health. These included hygienic food preparation, hand-washing, and, because of the time-saving, extended breastfeeding (Ewbank and Preston Reference Ewbank, Preston and Caldwell1989). Some of the new household technologies were especially associated with hygiene. The time required to collect and boil water fell substantially, leading to more sterilizing of water bottles and, along with the washing machine, more frequent laundering, including of diapers (Wilson Reference Wilson1929). Refrigeration reduced exposure to food-borne bacteria (Meckel Reference Meckel1990), and less use of coal for heating and cooking improved air quality (Barreca, Clay, and Tarr Reference Barreca, Clay and Tarr2015). In sum, the technologies made possible by access to electricity seem clearly to have had both direct and indirect effects on household behavior and child health.
Rural electrification may also have affected fertility and infant health through channels outside the household. Higher agricultural revenues and changes in rural labor market opportunities could have affected decisions about family size and investment in children. Electricity may also have led to improvements in the quality of infant medical care through, for example, the use of incubators in hospitals (Cutler and Meara Reference Cutler and Meara1999). Finally, rural electrification may have improved water quality through the centralization of farm water systems and the decommissioning of old wells (United States Public Health Service Reference Jaworski and Kitchens1950; Skipton, Shelton, Dvorak, et al. Reference Skipton, Shelton and Dvorak2008).
HOUSEHOLD TECHNOLOGY, FERTILITY AND CHILD HEALTH: A MODEL
Here I outline a model of how parental choices about fertility and child health can be influenced by a change in household technology (see Appendix for the formal model). The analysis demonstrates how decisions over fertility and child health investments are linked through the household's time constraint, and highlights the possible ways in which a change in home production technologies may have jointly affected these outcomes.Footnote 14 The approach is based on the trade-off, introduced by Gary Becker, between the number of offspring and their quality as determined in part by investment per child (Becker and Lewis Reference Becker and Gregg Lewis1973; Becker and Tomes Reference Becker and Tomes1976). In early models the emphasis was on education, but here the focus is on child health. Thus parents are assumed to have preferences over their own consumption, the number of children, and the health of their children as reflected in “health capital” per child. This health capital is affected by parental investment in health.
Modernization reduces the hours devoted to basic housework, freeing up time for other activities. The result is an increase in the net time available for home production, or in this case for child-rearing. The main insight of the model is that the effect on infant health and fertility depends crucially on how the new technologies alter the household's net time constraint and the (time) cost of improving child health.
One possibility is that modern household technologies free time from housework but do not influence the relative time cost of basic childcare or investment in child health. Because it takes time to raise children, even when parents do not invest in child health, modernization raises fertility by making more time available for child-rearing. In principle, the increased time could also be used to promote child health, but health investments must now be allocated across a larger number of children, which raises the cost of those investments. The result is a large increase in fertility with little change in health investment per child.Footnote 15 The implications are similar to Greenwood, Seshadri, and Vandenbroucke (Reference Greenwood, Seshadri and Vandenbroucke2005), who consider a framework in which raising children requires time but investing in child human capital requires only money. Under this setup, they argue that labor-saving household technologies were a major factor in the baby boom.
Another possibility is that new technologies alter the relative time cost of basic child rearing as compared to investing in child health. Electricity brought rural families technologies, such as indoor plumbing and washing machines, that lowered the cost of household sanitation. A reduction in the cost of health investments leads to increased health investment per child through two mechanisms. First, a substitution effect causes parents to reallocate time away from basic child rearing towards health investments. Second, an income (time) effect, due to the expansion in the time constraint, leads parents to devote more time to both fertility and health investments. The result is an unambiguous increase in health investment per child. In contrast, the impact on fertility is ambiguous, and depends on the whether the increased cost per child dominates the effect of the expansion in the household's time constraint.Footnote 16
A final consideration is the indirect effect of electrification through changes in income and labor market opportunities. Industrial electrification may have influenced demand for labor, driving up local wages. As well, increased agricultural productivity arising from technologies associated with electricity would likely have raised farm incomes. In the context of the model, where only time is used in child-rearing and utility is log-linear, increases in female wages have negative effects on fertility, increases in male wages and farm incomes have positive effects on fertility, and health investments per child are independent of labor market opportunities.Footnote 17 All three scenarios, or combinations of them, are plausible, meaning that the actual impact of the technologies on fertility and child health is fundamentally an empirical issue.
ESTIMATING THE IMPACT OF ELECTRICITY ACCESS ON INFANT MORTALITY AND FERTILITY
Data and Summary Statistics
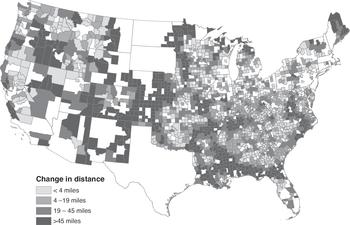
The analysis is based on an unbalanced county-level panel of 2,093 rural counties in the years 1930, 1940, 1950, and 1960.18,19 Two measures of electricity access are used. The first is the proportion of households with electricity in each census year.Footnote 20 The second measure is distance to the nearest power plant, which varies over time as new power plants opened. The distances are constructed by linking power plant openings to the corresponding county-centroid longitude and latitude. Figure 4 illustrates the change in county distance to the nearest power plant over the period.
CHANGES IN COUNTY-CENTROID DISTANCE TO POWER PLANTS, 1930–1960

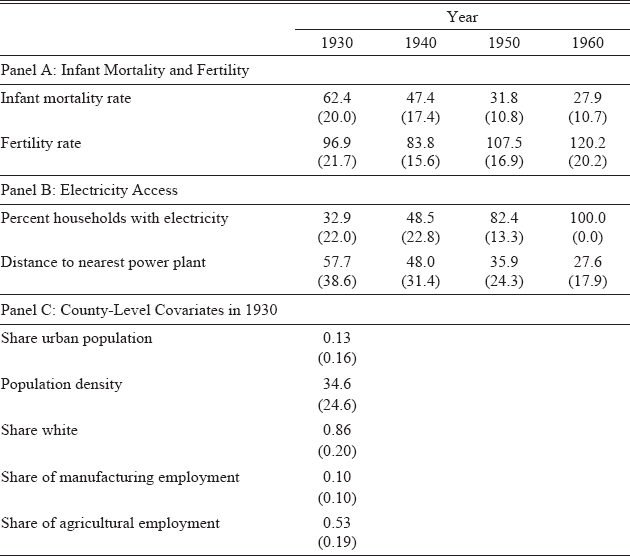
The two measures of electricity access are linked to health and fertility outcomes at the county level. The health measure is infant mortality per 1,000 live births, and the fertility measure is the number of live births per 1,000 women age 15 to 44 (see Table 1).Footnote 21 Information on baseline county demographic and economic conditions, all for 1930, include population density, the share living in urban areas, the share of white residents, the number of farms, agricultural and manufacturing employment (separately), and the fraction of households with electricity (Haines and ICPSR Reference Haines2010).
SUMMARY STATISTICS

Notes: Based on the 2,093 rural counties that are the basis of the estimation. County means are unweighted, and standard deviations are reported in brackets. Infant mortality is per 1,000 live births; fertility is per 1,000 women aged 18 to 44.
Sources: Haines and ICPSR (Reference Haines2010)—women aged 18 to 44 and county-level covariates; Vital Statistics—live births and infant deaths. See the text for the construction of the electricity access variables.
Table 1 reports the summary statistics. The mean infant mortality rate per 1,000 births in the sample fell from 62 in 1930 to 28 in 1960, with the largest declines occurring before 1950. The fertility rate per 1,000 women of fertile age declined from 97 to 84 between 1930 and 1940, but increased between 1940 and 1960, peaking at 120 in 1960. During the sample period, the mean share of households with electricity increased by 67 percentage points, from 33 percent in 1930 to 100 percent in 1960. Over the same period, average county distance to power plants fell by 50 percent, from 58 miles in 1930 to 28 miles in 1960. There were large differences in the timing of electricity access. In 1930 household electrification rates ranged from 7 percent at the 10th percentile of electricity access to 64 percent at the 90th percentile. Meanwhile, counties at the 10th percentile were nearly 100 miles farther from a power plant than counties at the 90th percentile. Even as electricity access expanded, the cross-county differences persisted. In 1950 the gap between counties at the 10th and 90th percentile was 34 percentage points for household electrification rates and 50 miles for power plant distance. The empirical strategy exploits these cross-county differences in the timing of electricity access to estimate the impact of rural electrification on infant mortality and women's fertility.
Empirical Framework
The empirical analysis is based on a first-difference approach that relates within county changes over time in electricity access to changes in infant mortality and fertility. Let y cst denote the fertility rate or infant mortality rate in county c, state s, and year t. E cst is a measure of electricity access, expressed either as the proportion of households in a county with electricity, or distance of the county-centroid to the nearest power plant. The relation is described by:

where μ cs denotes a vector of county fixed effects, and δ s t and λ t t are vectors of state-specific time trends and decade-specific time trends. The term δ s t allows for different trends in the fertility and infant mortality across states, while the term λ t t allows the outcome variables to trend differentially from one decade to the next.Footnote 22 The term X cs,1930 · t is a linear trend interacted with baseline county characteristics.Footnote 23 This interaction term allows for differential trends in fertility and infant mortality across counties with similar demographic and economic characteristics in 1930. Equation (1) can be re-written in first differences as:

Equation (2) forms the basis of the empirical analysis. The first-difference specification has the advantage of eliminating time-invariant county characteristics, and thus controls for, among other things, long-term growth in local demand. The identifying assumptions are that fertility rates and infant mortality rates would have trended similarly across rural counties in the absence of changes in electricity access.Footnote 24 The parameter of interest, γ, captures the reduced-form impact of changes in electricity access on the variables of interest, either mortality or fertility.
The analysis relies on two different measures of electricity access. The first is the proportion of households with electricity. This variable has the advantage of directly capturing household electricity access. Nevertheless, if household electrification projects were allocated in response to some unobservable time-varying local characteristic, the estimates could be biased. For example, if these projects were directed towards prospering rural counties, equation (2) might overestimate how much electrification reduced infant mortality. The omitted variable bias would be negative because prospering counties would have higher incomes which tend to be associated with lower infant mortality.
To address this concern, county distance to power plants is used as an alternate measure of electricity access. There is considerable evidence that distance was an important determinant of rural electricity access.Footnote 25 The qualitative evidence also suggests that the construction of large power plants was not affected by rural demand, which accounted for a small fraction of the total electricity produced. Rather power plant openings were influenced by a combination of much larger urban demand, the incentive to develop a more interconnected power grid, and geological/hydrological constraints that affected construction and operating costs. Because the decision to construct a large power plant was largely independent of rural demand considerations, this variable does not suffer the same omitted variables bias concern that is present with the first measure.Footnote 26 In contrast to household electrification rates, however, distance is more likely to capture the broader impacts of rural electrification that may have arisen outside the household.Footnote 27
Equation (2) is estimated separately using the proportion of households with electricity and county centroid distance to the nearest power plant. Regressions based on fertility are unweighted and regressions for infant mortality are weighted by number of births in a county.Footnote 28 Robust standard errors are clustered at the county-level to adjust for heteroskedasticity and within-county serial correlation. I also report Conley standard errors that allow for outcomes to be correlated among nearby counties (Conley Reference Conley1999).
RESULTS
Evaluating the Empirical Strategy
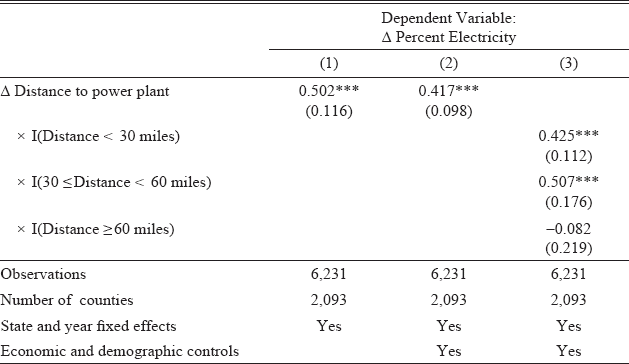
Before turning to the main empirical findings, I first evaluate the validity of the empirical strategy. In Table 2, I explore the relationship between power plant distance and rural electricity access. The table reports the impact of power plant distance on the proportion of households with electricity, estimated for the unbalanced panel of 2,093 counties over the three-decade period, 1930 to 1960. For ease of interpretation, coefficient estimates capture the impact of a 10-mile decrease in distance. There is a strong relationship between power plant distance and the fraction of rural households with electricity. The point estimates imply that a 100-mile decrease in distance is associated with a 4 to 5 percentage point increase in rural electrification rates. The linear relationship between power plant distance and the fraction of households with electricity might be unrealistic if, for example, power plants only serviced households within a certain distance of the plant. To explore this issue, a generalized version of equation (2) is estimated where the effect of a change in distance is allowed to vary according to distance. The variable ΔDistance to power plant is interacted with three indicators of current county distance to the nearest power plant. The effect of power plant openings on the proportion of households with electricity is concentrated among counties within 60 miles of a plant (Table 2, col. 3), indicating a limited willingness to extend services to distant rural customers.Footnote 29
DISTANCE TO POWER PLANTS AND ELECTRICITY ACCESS

*** = significance at the 1 percent level.
** = significance at the 5 percent level.
* = significance at the 10 percent level.
Notes: Based on changes from 1930–1940, 1940–1950, and 1950–1960. Distance to power plant is in negative 10s of miles. Economic and demographic controls, all calculated for 1930, include total employment in agriculture and manufacturing (separately), total population, population shares urban and white, number of farms, proportion of households with electricity. Regressions are weighted by live births. Each column reports the point estimates from a different regression. The I(Dist) terms are dummy variables for distance to the nearest power plant. Standard errors that are clustered at the county-level are reported in parentheses.
Sources: See the text.
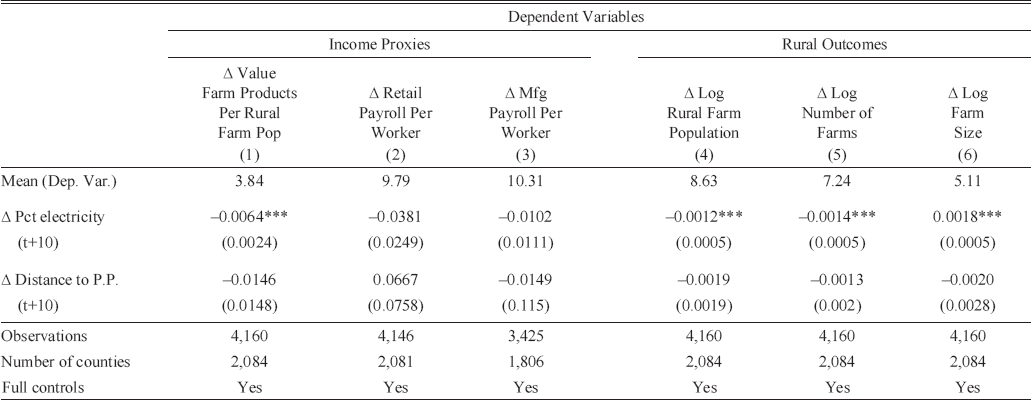
To evaluate the exogeneity of the two measures of electricity access, future changes in access are regressed on current changes in rural economic outcomes. Because future expansions in access should not affect current rural outcomes, these placebo regressions test whether the results are being driven by some omitted factor, such as local income growth. Future changes in electricity access—measured either as the fraction of households with electricity or county distance to power plants—are unrelated to contemporaneous trends in local incomes, measured by the value of farm products per rural farm population, retail payroll per worker, and manufacturing payroll per worker (Table 3, cols. 1–3). The results in columns 4 to 6 indicate that expansions in household electricity occurred in areas in the midst of rural depopulation, indicating a possible negative selection bias in residential services. In contrast, there is no relation between future plant openings and contemporaneous trends in rural population, the number of farms, or average farm size; results that further support the exogeneity of power plant siting decisions.
FUTURE CHANGES IN ELECTRICITY ACCESS AND CURRENT CHANGES IN ECONOMIC OUTCOMES

*** = significance at the 1 percent level.
** = significance at the 5 percent level.
* = significance at the 10 percent level.
Notes: Each cell reports the point estimates from a different regression. Full controls include Economic and demographic controls and State and year fixed effects. Regressions are weighted by live births. Standard errors that are clustered at the county-level are reported in parentheses.
Sources: See Table 2 and the text.
Electricity Access, Infant Mortality, and Fertility
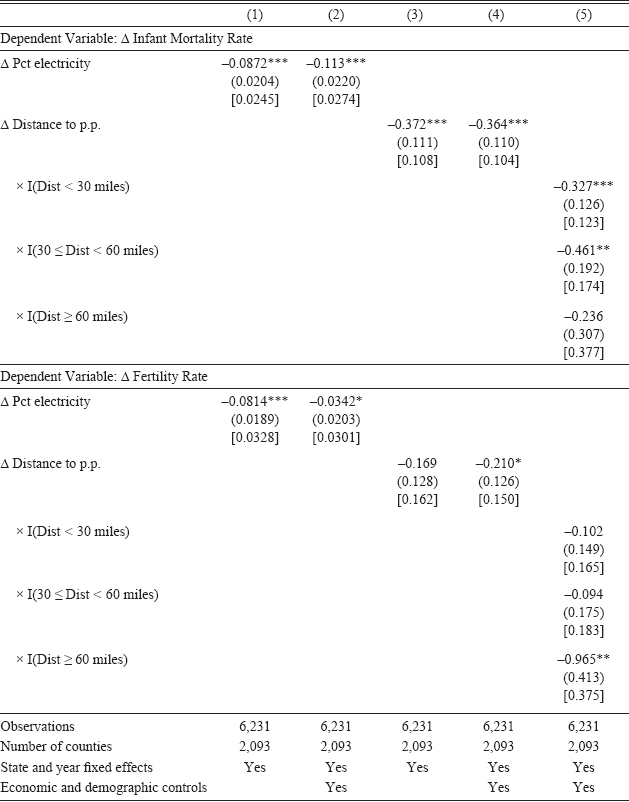
Having established the validity of the empirical strategy, I now explore the relationship between rural electrification, fertility, and infant health. Table 4 reports the estimated impacts of electricity access on infant mortality and fertility for the unbalanced panel of 2,093 counties over the three decadal period between 1930 and 1960. One set of estimates is based on the change over each decade in the proportion of homes with electricity (Table 4, cols. 1 and 2); the other set is based on the change over each decade in county-centroid distance to a power plant (Table 4, cols. 3 and 4).
THE EFFECT OF ELECTRICITY ACCESS ON INFANT MORTALITY AND FERTILITY

*** = significance at the 1 percent level.
** = significance at the 5 percent level.
* = significance at the 10 percent level.
Notes: Each column reports the point estimates from a different regression. Regressions for fertility are unweighted, and regressions for infant mortality are weighted by live births. Standard errors that are clustered at the county-level are reported in parentheses. Conley standard errors that allow for spatial correlation within a radius of 100 miles are reported in square brackets (Conley Reference Conley1999).
Sources: See Table 2 and the text.
Across all four specifications, increases in electricity access are associated with large and statistically significant decreases in infant mortality (Table 4, top panel).Footnote 30 The point estimates imply that a one-standard-deviation increase of 31 percentage points in the fraction of households with electrical services is associated with 2.7 (0.0872*31) to 3.6 (0.113*31) fewer infant deaths per 1,000 births. Meanwhile, a 100-mile decrease in county-centroid distance to a power plant is associated with 3.6 to 3.7 fewer infant deaths per 1,000 births. For both specifications, including baseline demographic and economic covariates hardly alters the estimated effects. Column 5 reports the estimates from a generalized version of equation (2) that allows for nonlinearities in the distance relationship. The reductions in infant mortality were concentrated among counties located within 60 miles of a power plant; those most likely to receive electrical services as a result of a plant opening.
The infant mortality estimates are quantitatively important. They imply that household electrification accounted for 15 to 19 percent of the decrease in infant mortality in these counties from 1930 to 1960.Footnote 31 For rural counties that were initially more than 60 miles from a power plant in 1930, decreases in power plant distance over the next 30 years accounted for 6 percent of the decline in infant mortality.Footnote 32 The results for household electrification are comparable to estimates of the impact of indoor plumbing on infant mortality (Watson Reference Watson2006), although the health benefits are smaller than those typically associated with the introduction of clean water technologies in the early twentieth century (Cutler and Miller Reference Cutler and Miller2005). The results are also consistent with Fishback and Kitchens (Reference Fishback and Kitchens2015), who find that lending for electricity infrastructure accounted for 13 percent of the decrease in infant mortality in REA counties from 1935 to 1940. The results in Table 4 are based on an extended 30-year time period, in which rural customers were able to more fully learn about and take advantage of the new technologies. Thus it is not surprising the estimates health benefits are larger than those found by Fishback and Kitchens (Reference Fishback and Kitchens2015).
The lower panel of Table 4 reports the impact of electricity on women's fertility. The estimates are all negative and small in magnitude. The preferred estimate (Table 4, col. 2) implies that a one-standard-deviation increase in the fraction of households with electricity is associated with 1.1 (0.0342*31) fewer births per 1,000 women aged 18 to 44, a 1 percent decrease in the fertility rate. The results imply that increased household access to electricity slowed the upward trend in rural fertility between 1940 and 1960 by 5 percent. Meanwhile, a 100-mile decrease in county-centroid distance to a power plant reduced the fertility rate by 2 percent, an effect that is statistically significant at the 10 percent level. Among counties within 60 miles of a power plant, the coefficient estimates are small—implying that a 100-mile decrease in distance is associated with 0.9 to 1.0 fewer births per 1,000 women aged 18 to 44—and not statistically significant. These results are similar to findings by Bailey and Collins (Reference Bailey and Collins2011), who conclude that the diffusion of electricity and labor-saving technologies was not a significant factor in the baby boom. The results based on power plant distance provide additional confidence that the findings are not driven by endogeneity in the household decision to modernize.
Robustness Tests: The New Deal, WWII, and Medical Care
In this section, I examine the robustness of the main results to three factors that might have influenced infant mortality and fertility decisions: New Deal spending, the rise in women's labor force participation during WWII, and the general improvements in medical care.
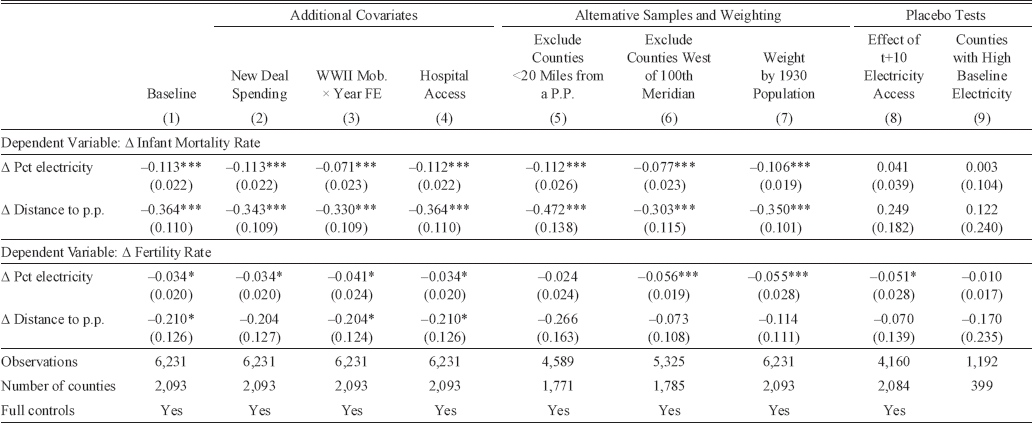
A variety of measures were introduced under the New Deal that might have had an effect, however indirect, on infant mortality and fertility. The Agricultural Adjustment Administration, the Farm Security Administration, and Farm Credit Administration all provided support to farmers either through grants or loans (Fishback, Haines, and Kantor Reference Fishback, Haines and Kantor2007). To allow for the possible impact, covariates for New Deal spending have been interacted with a linear time trend (Table 5, col. 2).Footnote 33 There is little change in the main estimates.
ROBUSTNESS TESTS: ADDITIONAL COVARIATES, ALTERNATE SAMPLES AND WEIGHTING, PLACEBO TESTS

*** = significance at the 1 percent level.
** = significance at the 5 percent level.
* = significance at the 10 percent level.
Notes: Each cell reports the point estimates from a different regression. Full controls include Economic and demographic controls and State and year fixed effects. Standard errors that are clustered at the county-level are reported in parentheses.
Sources: See Table 2 and the text.
The rise in female labor force participation during WWII is another factor that could have affected fertility and investment in child health. To the extent that there was correlation with the expansion in rural electrification, the results in Table 4 would be biased. To allow for this possibility, state-level WWII mobilization rates are interacted with year fixed effects (Acemoglu, Autor, and Lyle Reference Acemoglu, Autor and Lyle2004).Footnote 34 Again including these covariates has little effect on the main results (Table 5, col. 3).
A third possibility concerns the relation between formal medical care and access to electricity. Improvements in obstetric care and the introduction of sulfa drugs in the mid-1930s reduced infant mortality significantly (Albanesi and Olivetti Reference Albanesi and Olivetti2014; Jayachandran, Lleras-Muney, and Smith Reference Seema, Lleras-Muney and Smith2010), and incubators—first introduced into nurseries in 1922—increased survival rates of low-birthweight infants (Cutler and Meara Reference Cutler and Meara1999). If the rollout of the power grid was correlated with these changes in formal medical care, the estimates could be overestimating health benefits of electricity at the household level. To assess the effect on the estimates, a county-level covariate for the number of hospital beds in 1930 has been interacted with a linear time trend (Haines and ICPSR Reference Haines2010). This measure controls for trends in infant mortality across counties with different levels of baseline medical care. There is almost no impact on the results (Table 5, col. 4).
Local Demand and Distance to Power Plants
The final robustness checks further address concerns that power plants were built in response to local demand, and explore the relationship between power plant distance and electricity access. I re-estimate equation (2) excluding counties located within 20 miles of a plant. By excluding counties within close proximity to a power plant, these models address concerns that power plants were built in response to growing local demand.Footnote 35 The main estimates are unaffected by this sample restriction (Table 5, col. 5).
I assess the sensitivity of the main results to measurement error in electricity access and alternative regression weights. I re-estimate equation (2) excluding counties west of the 100th meridian. These regressions address concerns that county-centroid distance to the nearest power plant is a less reliable measure of electricity access in larger counties in the west. In practice, this sample restriction does not affect the qualitative results (Table 5, col. 6). Estimates from regressions that are weighted by baseline county population are also qualitatively similar to the main results (Table 5, col. 7).Footnote 36
As a final test of the research strategy, future changes in electricity access are regressed on current changes in infant mortality and fertility (Table 5, col. 8). Because future electricity access should not affect current health or fertility decisions, these placebo regressions test whether the results were driven by some unobserved local characteristic. There is no relationship between future changes in either measure of electricity access and current trends in infant mortality. For fertility, the coefficient estimate based on the proportion of households is significant at the 10 percent level and similar in magnitude to the main findings, consistent with a negative pre-trend in this outcome. Nevertheless, the results based on future changes in power plant distance are small and statistically insignificant, supporting the exogeneity of this alternative measure of electricity access. Changes in electricity access also had no significant impact on either infant mortality or fertility in counties that had high baseline electrification rates (Table 5, col. 9).
Other Effects: Labor Markets, Agricultural Productivity, Housing, and Migration
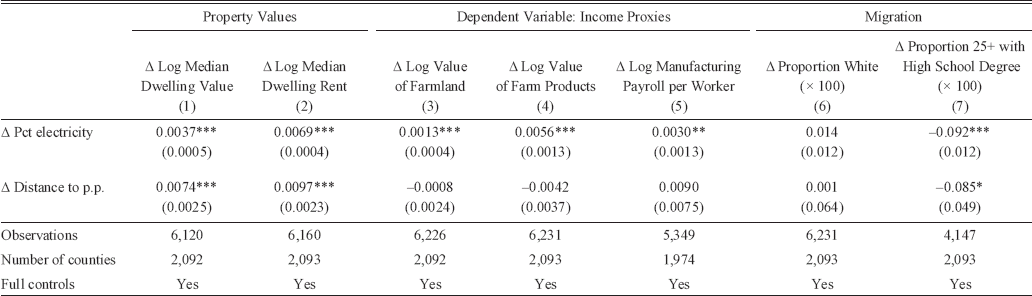
Access to electricity may have affected infant health through channels outside the home. For example, higher incomes due to the possible effect of electricity on agricultural productivity or wages might have indirectly improved infant health. Because the empirical strategy relies on the geographic rollout of the grid, the direct health impact of household electricity cannot be fully disentangled from these indirect effects associated with local electrification. Nevertheless, it is instructive to explore the potential role of one plausible indirect channel: improvements in agricultural productivity. Table 6 reports the effects on electricity access on measures of farm property values, agricultural productivity, and manufacturing annual earnings. Electricity access had little impact on agricultural productivity or manufacturing payroll per worker. The coefficients on the proportion of households with electricity are statistically significant and imply that a one-standard-deviation increase in household electrification is associated with a 4 to 17 percent increase in local incomes; however, none of the coefficients based on power plant distance are statistically significant (Table 6, col. 3 to 5). These results suggest that the large improvements in infant health were unlikely to have been driven by higher incomes in rural areas. Despite these modest impacts on agricultural output, increases in electricity access had positive effects on property values (Table 6, cols 1 and 2). A one-standard-deviation increase in household electrification is associated with a 12 to 21 percent increase in property values, and a 100-mile decrease in distance is associated with a 7 to 10 percent in property values. These results are consistent with the benefits of rural electrification having been capitalized into local housing prices.
EFFECTS OF ELECTRICITY ACCESS ON PROPERTY VALUES, INCOME PROXIES, AND MIGRATION

*** = significance at the 1 percent level.
** = significance at the 5 percent level.
* = significance at the 10 percent level.
Notes: Each cell reports the point estimate from a different regression. Full controls include Economic and demographic controls and State and year fixed effects. Standard errors that are clustered at the county-level are reported in parentheses.
Sources: See Table 2 and the text.
A final source of potential bias is migration. If healthier individuals moved to areas with electricity access, the results could be overstating the health benefits. Table 6 (cols. 6 and 7) reports the effects of electrification on the demographic composition of the population. There is no relationship between electricity access and the proportion white. The coefficient estimates on the proportion with a high school degree are statistically significant but small in magnitude, implying that one-standard-deviation increases in household electrification is associated with a 3 percentage point decrease in the proportion with a degree. The findings in this section, and indeed all other tests, provide broad support for the conclusions that rural electrification had large positive effects on infant health but had little impact on women's fertility.
INTERPRETING THE LINK BETWEEN ELECTRICITY AND INFANT HEALTH
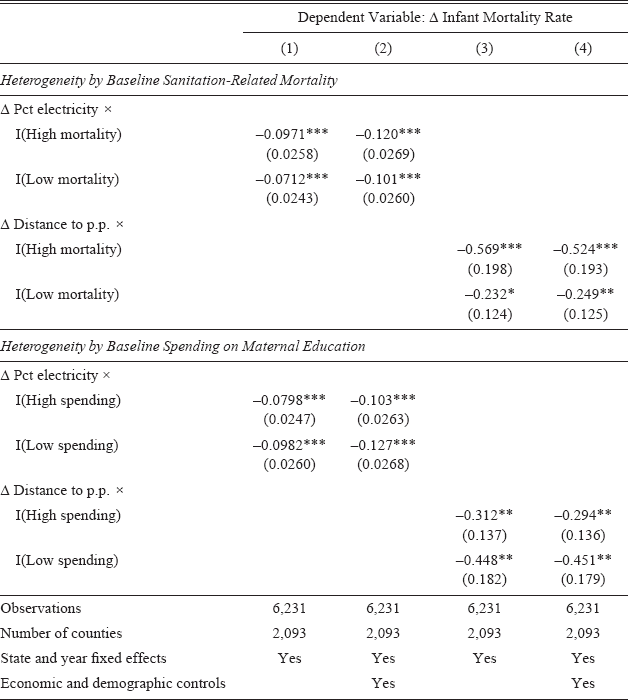
The key findings are that access to electricity is associated with substantially and statistically significantly lower infant mortality, while the effect on women's fertility was small and negative. To explore further the underlying mechanisms, I examine how the effects on infant mortality varied according to baseline sanitation. Using state-level information on infant mortality by cause, I calculate the fraction of infant deaths due to factors especially associated with hygiene: diarrhea and enteritis. In 1930 diarrhea and enteritis together accounted for one-quarter of post-neonatal mortality. These diseases are mainly attributable to environmental factors associated with poor sanitation, poor hygiene, and unsafe drinking water (WHO 2009, p. 9). I construct indicators for counties depending on whether they had above-median or below-median baseline diarrhea-enteritis infant mortality, and interact these variables with changes in electricity access.Footnote 37 The estimates are greater for counties whose infant mortality rates from diarrhea-enteritis were above the median (Table 7, upper panel). In fact, the estimates based on power plant distance are roughly twice as large among the high mortality counties. These results imply that the benefits of electrification were particularly large where sanitation was especially poor initially, suggesting that a key benefit of electrification was improved hygiene.
EFFECTS OF ELECTRICITY ACCESS BY BASELINE SANITATION AND MATERNAL EDUCATION

*** = significance at the 1 percent level.
** = significance at the 5 percent level.
* = significance at the 10 percent level.
Notes: Each column reports the point estimates from a different regression. I(High mortality), I(Low mortality) indicate whether a state had above- or below-median share of infant deaths due to diarrhea-enteritis in 1930. I(High spending), I(Low spending) indicate whether the state had above- or below-median spending on maternal education under the Sheppard-Towner Act between 1922 and 1929. Standard errors that are clustered at the county-level are reported in parentheses.
Sources: See Table 2 and the text.
The previous findings point to a possible connection between rural electrification, access to modern household technologies, and changes in parental decisions regarding their investments in children's health and household hygiene. To further explore this relationship, I examine whether the health impacts of rural electrification varied according to baseline population awareness of better household health practices. On the one hand, there may have been greater scope to improve infant health in rural areas where mothers were less aware of health-promoting activities. On the other hand, better educated mothers may have more effectively taken advantage of the benefits of electricity to promote household hygiene. The analysis relies on cross-state differences in spending between 1922 and 1929 under the Sheppard-Towner Act, a program that provided matching grants to states for maternal education. The Sheppard-Towner Act funded home visits of nurses, who informed mothers of appropriate infant care. The program was highly effective in promoting better health practices and reducing infant mortality in rural areas (Moehling and Thomasson Reference Moehling and Thomasson2014).
To explore the impact of local awareness of better-hygiene practices on the main results, I allow the effects of electricity access to vary according to state-level funding under the Sheppard-Towner Act. I classify states as above- and below-median spending based on the fraction of total Sheppard-Towner appropriations accepted from 1922 to 1929 (Moehling and Thomasson Reference Moehling and Thomasson2012), and interact these indicators with the electricity access variables in equation (2).Footnote 38 These regression models allow the health impact of rural electrification to vary according to baseline awareness of better health practices. The estimates are consistently larger in states that had below-median spending under the Sheppard-Towner program (Table 7, lower panel). For example, the point estimates for distance are 40 to 50 percent larger in low spending states. The results suggest that rural electrification led to greater improvements in infant health in rural areas where there was initially less awareness of better health practices. One interpretation of these findings is that parental time and awareness of better hygiene practices were substitute inputs to child health.
CONCLUSION
The diffusion of electricity from 1930 to 1960 provided rural households access to a range of new technologies that freed time from housework and potentially influenced a range of household behaviors. This article uses detailed information on the timing of rural electrification across counties to study its impact on infant health and women's fertility. The diffusion of electricity into rural areas led to sizeable reductions in infant mortality. Applying the estimates to just over two thousand rural counties, the regression estimates imply that rural electrification accounted for 15 to 19 percent of the overall decline in infant mortality during this period.
The second important finding is in a sense a negative one. Contrary to suggestions that the labor-savings aspects of electricity encouraged larger families, possibly contributing to the baby boom, it is estimated that access to electricity lowered fertility slightly. The mechanism may have been related to how the technologies associated with electricity affected health-related activities. Pumped water, washing machines, refrigerators, and in some cases electric ranges, reduced the relative (time) cost of improving child health, which could have triggered a shift towards smaller families with greater health investment per child.
These findings have relevance for current policy in developing nations. Recent developments in off-grid electrification technologies have substantially reduced the cost of providing electricity to remote communities (United Nations Development Program Reference Ramey2009). Despite these developments, more than 300 million households do not have access to electricity, and at current investment rates, the number of individuals without electricity is projected to rise over the next 30 years (World Bank Reference Bank2008). The United Nations recently established “access to affordable, reliable, sustainable energy for all” as one of its core sustainable development goals.Footnote 39 Nevertheless, recent evidence on the economic impact of electricity infrastructure investments in developing countries has been mixed (see Lipscomb, Mobarak, and Barham Reference Lipscomb, Mushfiq Mobarak and Barham2013; Chakravorty, Emerick, and Ravago Reference Chakravorty, Emerick and Ravago2016; Burlig and Preonas Reference Burlig and Preonas2016). This article shows that standard economic indicators may fail to capture the benefits of electrification that are generated within the household, and demonstrates that expanding energy infrastructure can be a very effective way of improving child health.
Appendix
A Model of Fertility and Child Health
Parents have preferences over their own consumption, c, number of children, n, and health capital per child, h, according to the following utility function:
![\[
\begin{array}
U(c, n, h) = (1 - \alpha) \log \ c + \alpha[\log \ n + \beta \ \log \ h],
\end{array}
\](https://static.cambridge.org/binary/version/id/urn:cambridge.org:id:binary:20180404060348465-0980:S0022050718000050:S0022050718000050_eqnA1.gif?pub-status=live)
where (1 – α) ∊ (0,1) reflects the importance of own consumption relative to the combined quantity and health of children, while β ∊ (0,1) captures the relative preference for child health.Footnote 40 Child health capital is determined by:

where θ 0 > 0 denotes the child's health endowment, and θ 1 > 0 captures the effect of health investment, e.
Parents have a net time endowment, T, which can be allocated to market work, l, or caring for children. This endowment reflects the amount of time available after basic housework has been completed. The time devoted per child consists of a fixed component, τ F, that does not affect health, and a component, τ E e, where τ E is time per unit of investment in child health. Thus, the total time required for a child with a level of health investment, e, is τ F + τ E e. The budget constraints are:

and

where w is the wage, and Y denotes either non-labor income or husband's earnings.Footnote 41
Several features of the specifications warrant discussion. First, the quality production function dates to Gary Becker and Nigel Tomes (Reference Becker and Tomes1976). Variants have been used to study the fertility-income relationship, more recently by David De La Croix and Matthias Doepke (Reference De La Croix and Doepke2003) and Tom Vogl (Reference Vogl2016). An attractive feature is the implied negative relationship between fertility and wages, a pattern that has been well-documented (see, for example, Jones, Schoonbroodt, and Tertilt Reference Jones, Schoonbroodt and Tertilt2008). The preference parameter, b, follows Oded Galor and Omer Moav (Reference Galor and Moav2002).Footnote 42 As in Moav (Reference Moav2005), the model abstracts from the financial cost of raising children. The focus on time costs helps clarify the impact of household technologies on fertility and mortality.
The first-order conditions yield closed-form solutions for optimal fertility and investment in child health:Footnote 43


Equations (A5) and (A6) can be used to evaluate the various channels through which access to electricity influenced fertility and investment in children. An increase in the net time endowment, T, increases the number of children n* but has no effect on health investment e*.Footnote 44 Thus, technologies that increase the net time endowment without affecting the productivity parameter, t E, do not affect health investment per child; they only increase fertility (see text for the intuition). An increase in the productivity of time spent in health investment lowers t E. Since health investments are independent of T, technologies that lower the cost of health investment will increase health investment per child, e* in equation (A6). The effect on number of children n* is ambiguous; the endowment effect—due to an increase in the net time available, T—is positive, and the price effect—due to a decrease in the cost of health investment, t E—is negative in equation (A5). Intuitively, increased investment per child raises the shadow price of fertility, which counteracts the effect of expanding the household's time constraint. The impact of electrification through income and wages is felt only through equation (A5). That is, they only affect fertility. An increase in male wages and non-labor income, Y, raises fertility, while an increase in women's wages, w, lowers it.