Introduction
Chagas disease (CD) is an infectious condition (with acute or chronic phase). It has protozoan Trypanosoma cruzi (T. cruzi) as its etiological agent and triatomine insects ‘barber bugs’ or ‘kissing bugs’, as its vector. It is an endemic zoonosis in 21 countries in the Americas, where approximately 6 million people are affected. This disease has high morbidity and mortality rates in endemic countries, including Brazil, with psychological, social and financial impact (Dias et al., Reference Dias, Ramos Junior, Gontijo, Luquetti, Shikanai-Yasuda, Coura, Torres, Melo, Almeida, Oliveira Junior, Silveira, Rezende, Pinto, Ferreira, Rassi, Fragata Filho, Sousa, Correia Filho, Jansen, Andrade, Britto, Pinto, Rassi Junior, Campos, Abad-Franch, Santos, Chiari, Hasslocher-Moreno, Moreira, Marques, Silva, Marin-Neto, Galvão, Xavier, Valente, Carvalho, Cardoso, Silva, Costa, Vivaldini, Oliveira, Valente, Lima and Alves2015; World Health Organization, 2019). The disease presents a biphasic clinical course and may manifest as indeterminate, cardiac, digestive, or cardiodigestive forms. This fact raises the need for surveillance and control activities to be structured into three priority axes: human cases and early detection, aiming timely treatment and identification of the morbidity and mortality profile in the affected population; vectors, to keep vector transmission eliminated; and the environment, aiming at incorporating and integrating sanitary, environmental and epidemiological surveillance actions (Brazil, 2019a).
CD affects approximately 6 million people in Latin America, with an incidence rate of 30 thousand cases per year and a mortality rate of 12 thousand deaths per year. In Brazil, it is estimated that 1–4.6 million people are infected and 6000 die per year (Simões et al., Reference Simões, Borges, Assis, Conceição, Silva, Santos and Meira2018; Bernardo-Pedro et al., Reference Bernardo-Pedro, Sousa, Freitas, Freitas, Santos-Mallet and Tassinari2019). These occurrences were highlighted by the lack of opportunity for suspicious and delayed diagnosis. These high numbers demonstrate the weakness of the surveillance system and can be considered a predictor of the clinical picture worsening and the disease evolution, leading patients to death due to the lack of the recommended interventions.
Increased knowledge about the epidemiological scenarios of CD and the dynamics of transmission is essential. Space is a relevant factor in the analysis of healthy relations with the environment, providing subsidies for the search for consistent and sustainable management, surveillance, effective and efficient health, and social control and care (Dias et al., Reference Dias, Ramos Junior, Gontijo, Luquetti, Shikanai-Yasuda, Coura, Torres, Melo, Almeida, Oliveira Junior, Silveira, Rezende, Pinto, Ferreira, Rassi, Fragata Filho, Sousa, Correia Filho, Jansen, Andrade, Britto, Pinto, Rassi Junior, Campos, Abad-Franch, Santos, Chiari, Hasslocher-Moreno, Moreira, Marques, Silva, Marin-Neto, Galvão, Xavier, Valente, Carvalho, Cardoso, Silva, Costa, Vivaldini, Oliveira, Valente, Lima and Alves2015). In this perspective, this research aims at identifying the spatiotemporal trends of CD mortality in the Brazilian Northeast from 2007 to 2017.
Methods
Setting
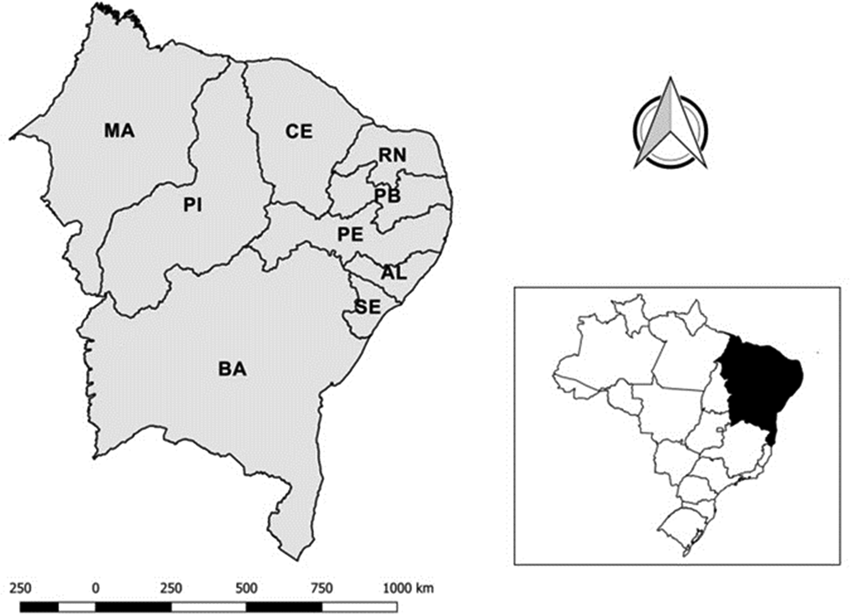
It is an ecological study that had all municipalities in the northeastern region of Brazil as units of analysis. This region has a geographical area delimited by nine states (Maranhão [MA], Piauí [PI], Ceará [CE], Rio Grande do Norte [RN], Paraíba [PB], Pernambuco [PE], Alagoas [AL], Sergipe [SE] and Bahia [BA]), with an estimated population of approximately 47 million inhabitants and an area of 1 554 000 km2. The states comprise a total of 1794 municipalities (Fig. 1).
Brazilian Northeast Region and its states.
Note: MA: Maranhão; PI: Piauí; CE: Ceará; RN: Rio Grande do Norte; PB: Paraíba; PE: Pernambuco; AL: Alagoas; SE: Sergipe; BA: Bahia; N: North.

Data source
The Mortality Information System (SIM) was used as the data source, considering the death of the person with CD (B57 classification in the 10th International Classification of Diseases) during the period 2007–2017. Therefore, the data available online by the Department of Informatics of the Unified Health System (DATASUS) were extracted via the Tabnet tool.
Tables containing all cases of death in each municipality during the years indicated above were downloaded, as well as information on mortality by disease stratified by sex, age, race/colour and education. The estimated populations of the municipalities studied were also online obtained by DATASUS.
Data analysis
Initially, a descriptive analysis of the data was performed using absolute and relative frequencies to describe the epidemiological profile of deaths from CD in the municipalities of northeastern Brazil. The mortality rate (with 95% confidence interval – CI) for CD in each municipality in the period indicated was calculated using the average numbered deaths and the average population of the middle year (2012) as the denominator and multiplied per 100 000 inhabitants. Based on mortality, the relative risks (RR) and 95% CI of each group were calculated and used in the stratifications (Lima et al., Reference Lima, Martins-Melo, Heukelbach, Alencar, Boigny and Ramos Junior2016).
Time trend analysis was conducted to indicate the temporal trend of CD Mortality in the Northeast region as a whole as well as each state of it. To achieve it, joinpoint regressions were performed. The joinpoint regressions indicate if one or more segments should be added in a linear regression to indicate any change in the temporal trend, which refutes the null hypothesis that no points should be added. Its results are possible to estimate the annual percentage change (APC) of the studied trend as well as its 95% confidence interval (95% CI) and significance. The model was adjusted assuming that the number of inflection points could vary from zero to two, which means a straight line or a line with three segments. A significance level of 5% was established in the time trend analysis (Sousa et al., Reference Sousa, Garces, Pereira, Moreira and Silveira2019).
For the spatial analysis, the thematic map of the mortality rate of each municipality was created. As many of them did not have cases of death in the period, these crude rates were smoothed through the local empirical Bayesian method to reduce the instability caused by the crude rates. This method considers not only the number of deaths by a municipality but weighs it with the border municipalities through a spatial proximity matrix. To calculate this matrix, the contiguity criterion was used, giving the value 1 to the neighbouring municipalities and the value 0 to the non-neighbours (Martins-Melo et al., Reference Martins-Melo, Lima, Ramos, Alencar and Heukelbach2014).
After descriptive spatial analysis, the presence of global spatial dependence was evaluated using the Global Moran Index on the crude indicators. The method identifies spatial autocorrelation and ranges from −1 to +1, where values close to zero indicate an absence of spatial dependence, considering significant P < 0.05. In addition, the Local Index of Spatial Association (LISA) was assessed by the Local Moran Index, which checks the value of the municipality and its neighbours for the identification of spatial patterns of the studied phenomenon (Monteiro et al., Reference Monteiro, Martins-Melo, Brito, Alencar and Heukelbach2015).
The Local Moran Index generates the Moran's scattering diagram that consists in four quadrants: high-high (municipalities with high rates and surrounded by those with high rates), low-low (municipalities with low rates surrounded by those with low rates), high-low (municipalities with high rates surrounded by those with low rates) and low-high (municipalities with low rates surrounded by those with high rates), considering significant values which P < 0.05. The high-high and low-low categories represent areas of agreement and the high-low and low-high categories indicate epidemiological transition areas (Monteiro et al., Reference Monteiro, Martins-Melo, Brito, Alencar and Heukelbach2015).
Subsequently, spatial scan analysis was performed. It was used to identify areas of risk and protection for CD mortality. For this, the RR for CD mortality was calculated for each municipality, and the presence of purely spatial clusters was identified (Yamamura et al., Reference Yamamura, Freitas, Santo Neto, Chiaravalloti Neto, Popolin, Arroyo, Rodrigues and Arcêncio2016).
To identify purely spatial clusters, the discrete Poisson model was used, following these requirements: no geographical overlap of clusters, maximum cluster size equal to 10.0% of the exposed population, circular-shaped clusters and 999 replications.
Statistical analysis was performed by using Stata software version 12.0. Joinpoint regressions were performed by the Joinpoint Regression Software version 4.7.0.0. The spatial statistics were performed by TerraView 4.2.2 software. The purely spatial scan analysis was performed with the aid of SaTScan 9.6 software. All maps were created using QGIS 2.4.17 software.
Results
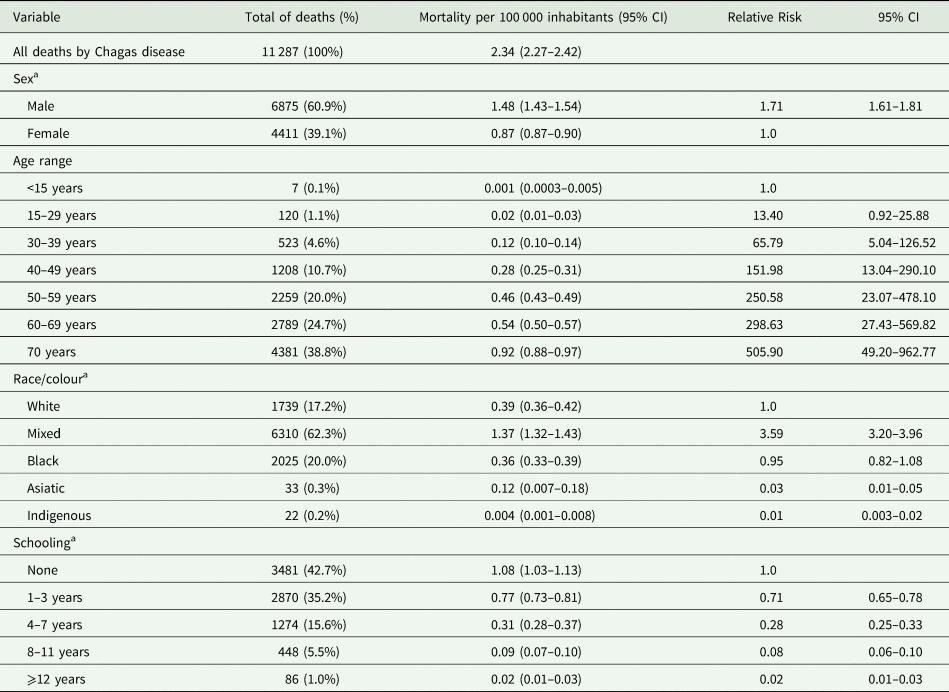
Between 2007 and 2017, 11 287 deaths by CD were identified in the Northeast of Brazil. Most of the cases were from males (n = 6875; 60.9%), 38.8% of them (n = 4381) were in people with 70 years old or more, 62.3% (n = 4381) of the cases in mixed-race and 42.7% of the deaths (n = 3481) among people that have never been to school (Table 1).
Epidemiological features related to Chagas Disease mortality (per 100 000 inhabitants) in the Northeast of Brazil, 2007–2017

CI, confidence interval.
Note: ‘mixed’ refers to mixed ethnicities: cablocos, mulatos, mamelucos and cafusos.
a Data not completed or ignored: sex (1 case), race/colour (1458 cases), schooling (3128 cases).
The annual risk mean was 71.0% higher (95% CI: 1.61–1.81) in males. This risk significantly increased from people aged 70-year-olds or more, with a rate 505.90 times higher when compared to people with 15 years old or less (95% CI: 49.20–962.77). Regarding race/colour, it was identified as a risk of 3.59 times higher (95% CI: 3.20–3.96) in mixed compared to white skin colour ones. It was also observed that the risk of mortality constantly decreases as the studying years increase, where people with 12 or more school years have 99.98% less risk of mortality (95% CI: 0.01–0.03) (Table 1).
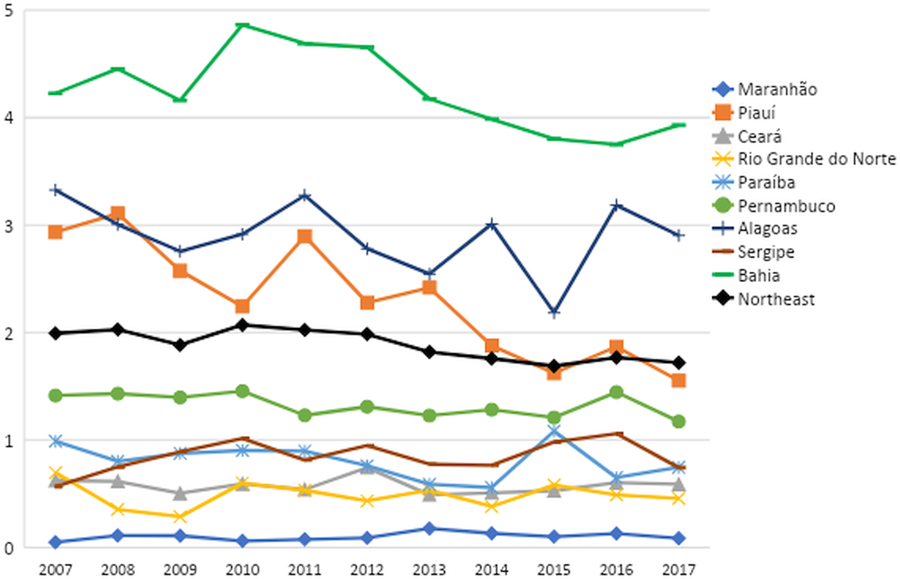
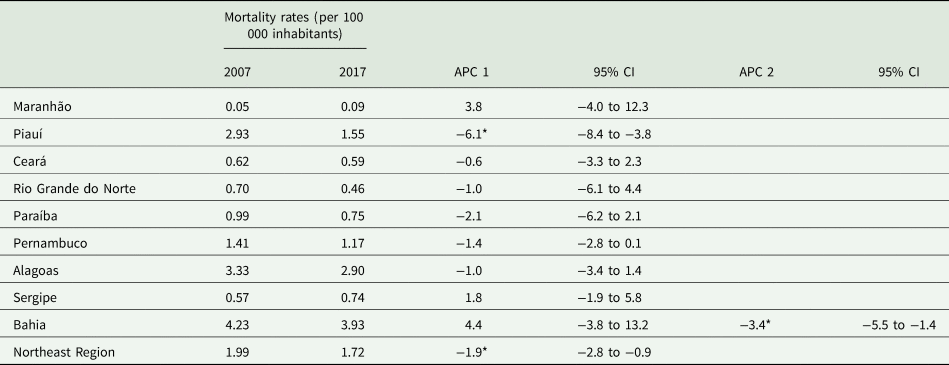
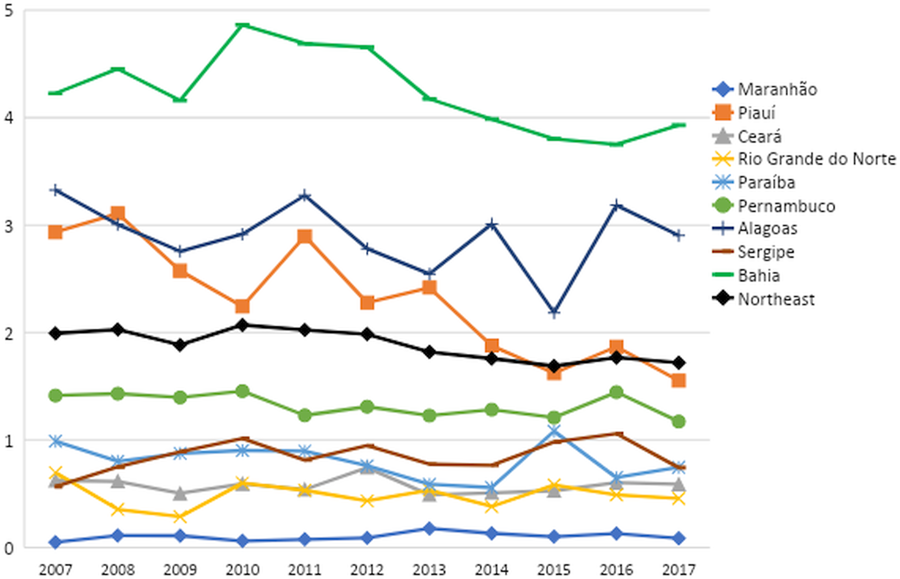
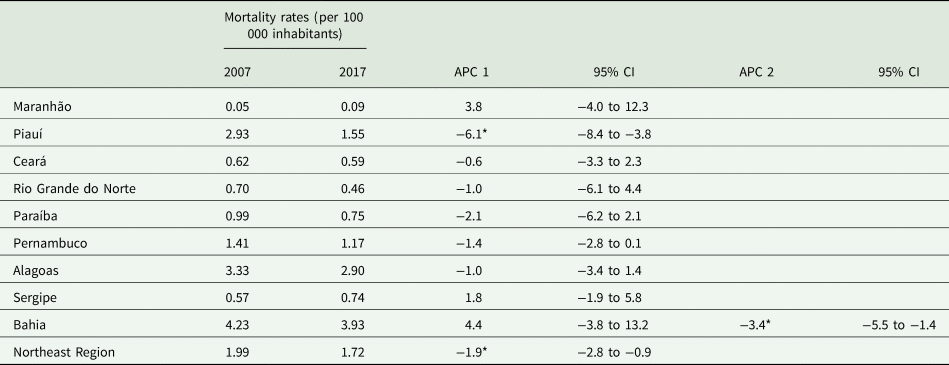
Time trend analysis indicated that the Northeast Region presented a significant decrease in CD-related mortality over the studied years (APC: −1.9; 95% CI: −2.8 to −0.9). However, when analysing each state, it is possible to identify that only the State of Piauí significantly decreased CD mortality over time (APC: −6.1; 95% CI: −8.4 to −3.8). Among all states, only Bahia presented different trends over time, in which it was identified a nonsignificant increase from 2007 to 2010 (APC: 4.4; 95% CI: −3.8 to 13.2) and a significant reduction of the mortality rates from 2010 to 2017 (APC: −3.4; CI −5.5 to −1.4) (Fig. 2; Table 2).
Trends of Chagas Disease-related mortality in the Northeast of Brazil, 2007–2017.
Annual percentage change of Chagas disease-related mortality in the Northeast of Brazil, 2007–2017
CI, confidence interval.
APC1 is referred to the annual percentage change in the period 2007–2017, except for Bahia where APC1 is referred to 2007–2010 and APC2 to 201–2017.
*P < 0.05 from t-test comparing the mortality rates from the beginning until the end of the time series.
Although not statistically significant, most of the temporal trends in the States decreased and no significant positive variations were found. Moreover, there was a significantly decreased trend in Bahia from 2010 to 2017. Therefore, significant decreasing trends in both Piauí and Bahia have influenced in the Northeast decreasing result as a whole.
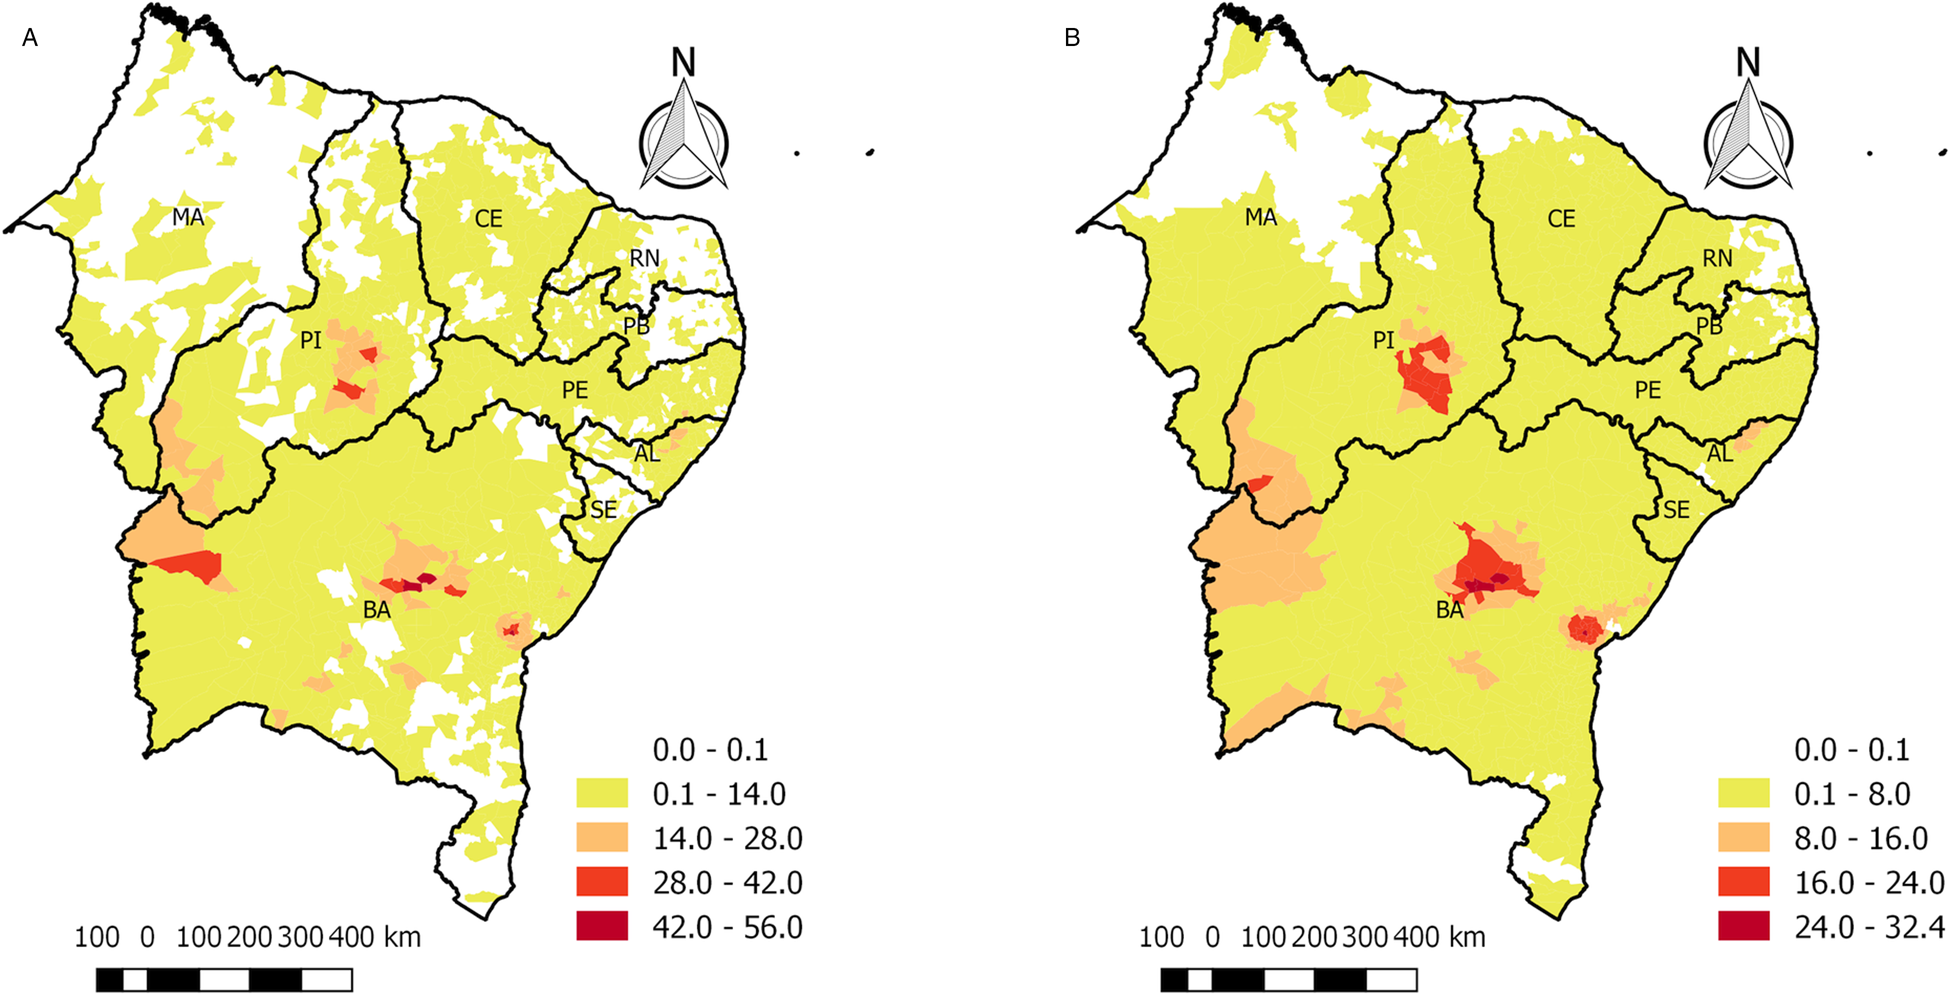
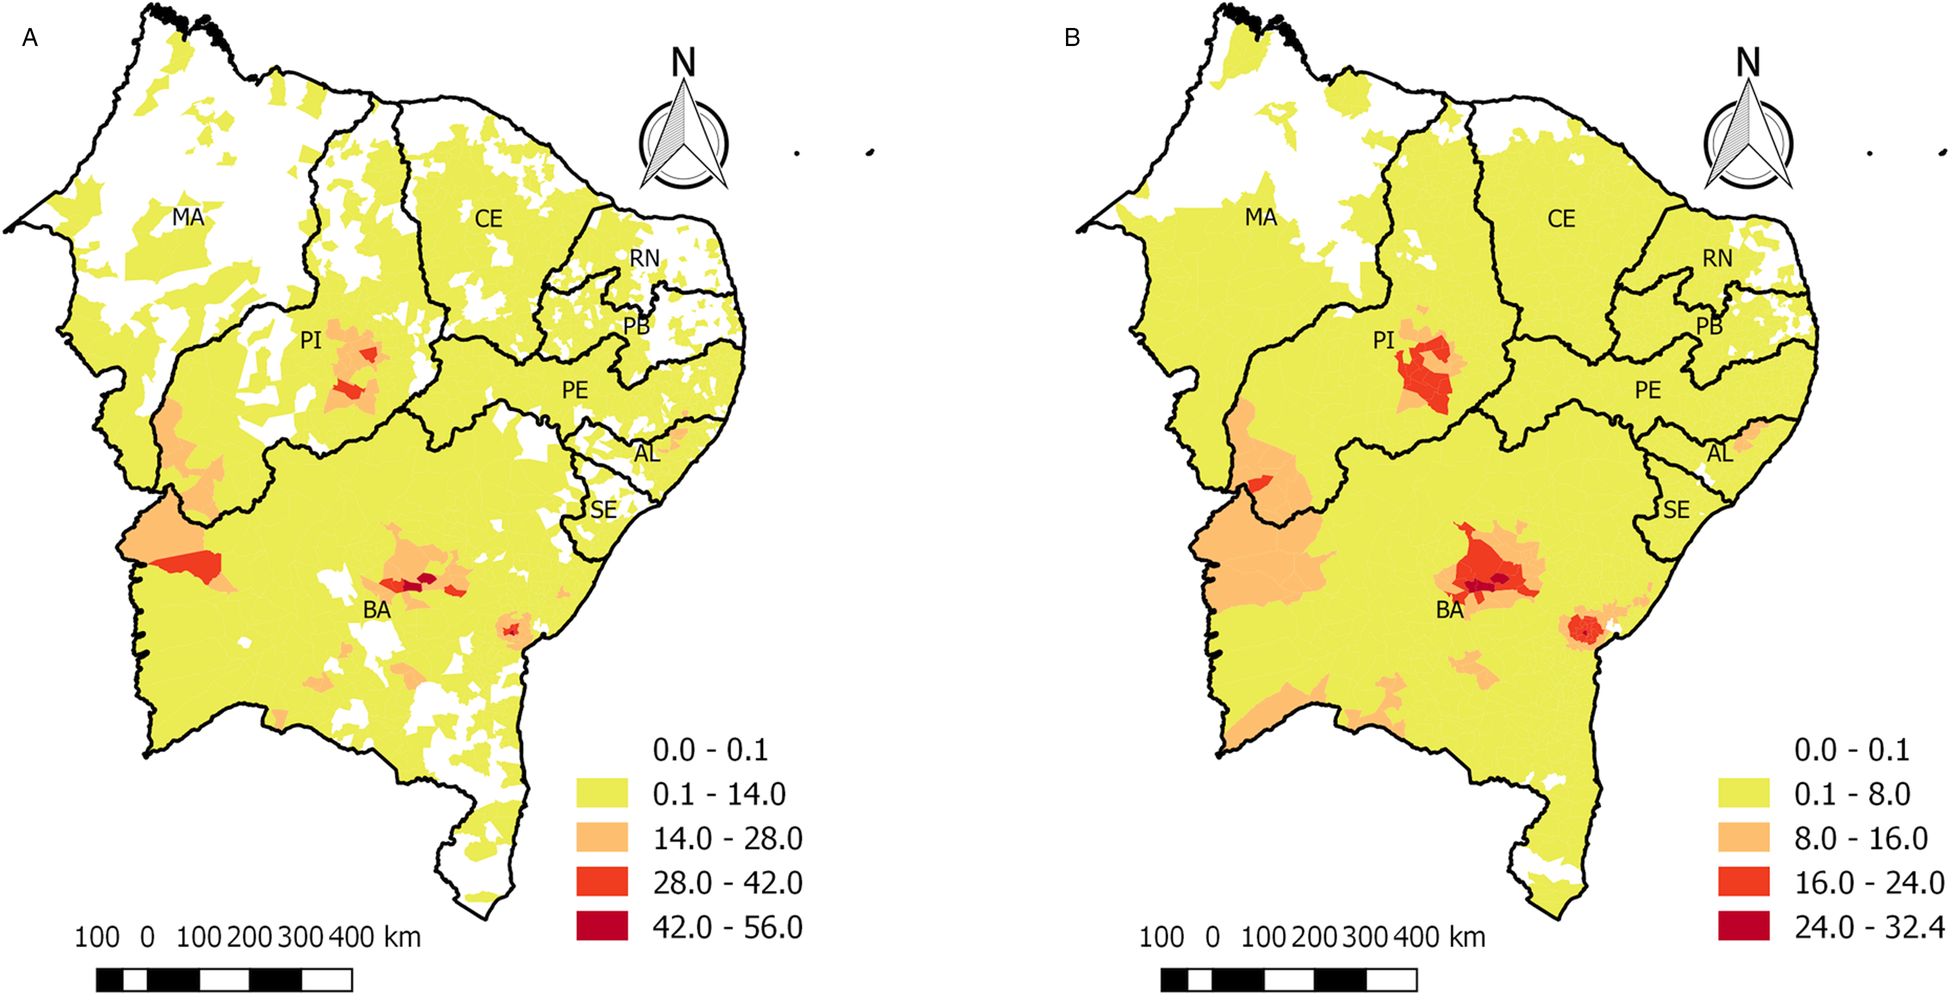
Regarding the spatial analysis, it was possible to identify, in Fig. 3A, that crude mortality rates have varied from none (mostly in the State of Maranhão) to 56 deaths per 100 thousand inhabitants (States of Bahia and Piauí). By applying the local empirical Bayesian method (Fig. 3B), it was possible to generate a more stable map with more accurate rates. In both pictures, red areas represent more expressive mortality rates.
Maps of the crude mortality rates by Chagas Disease (A) and smoothed rates by the local empirical Bayesian method (B), both by the municipality and by 100 000 inhabitants, 2007–2017.
Note: MA: Maranhão; PI: Piauí; CE: Ceará; RN: Rio Grande do Norte; PB: Paraíba; PE: Pernambuco; AL: Alagoas; SE: Sergipe; BA: Bahia; N: North.
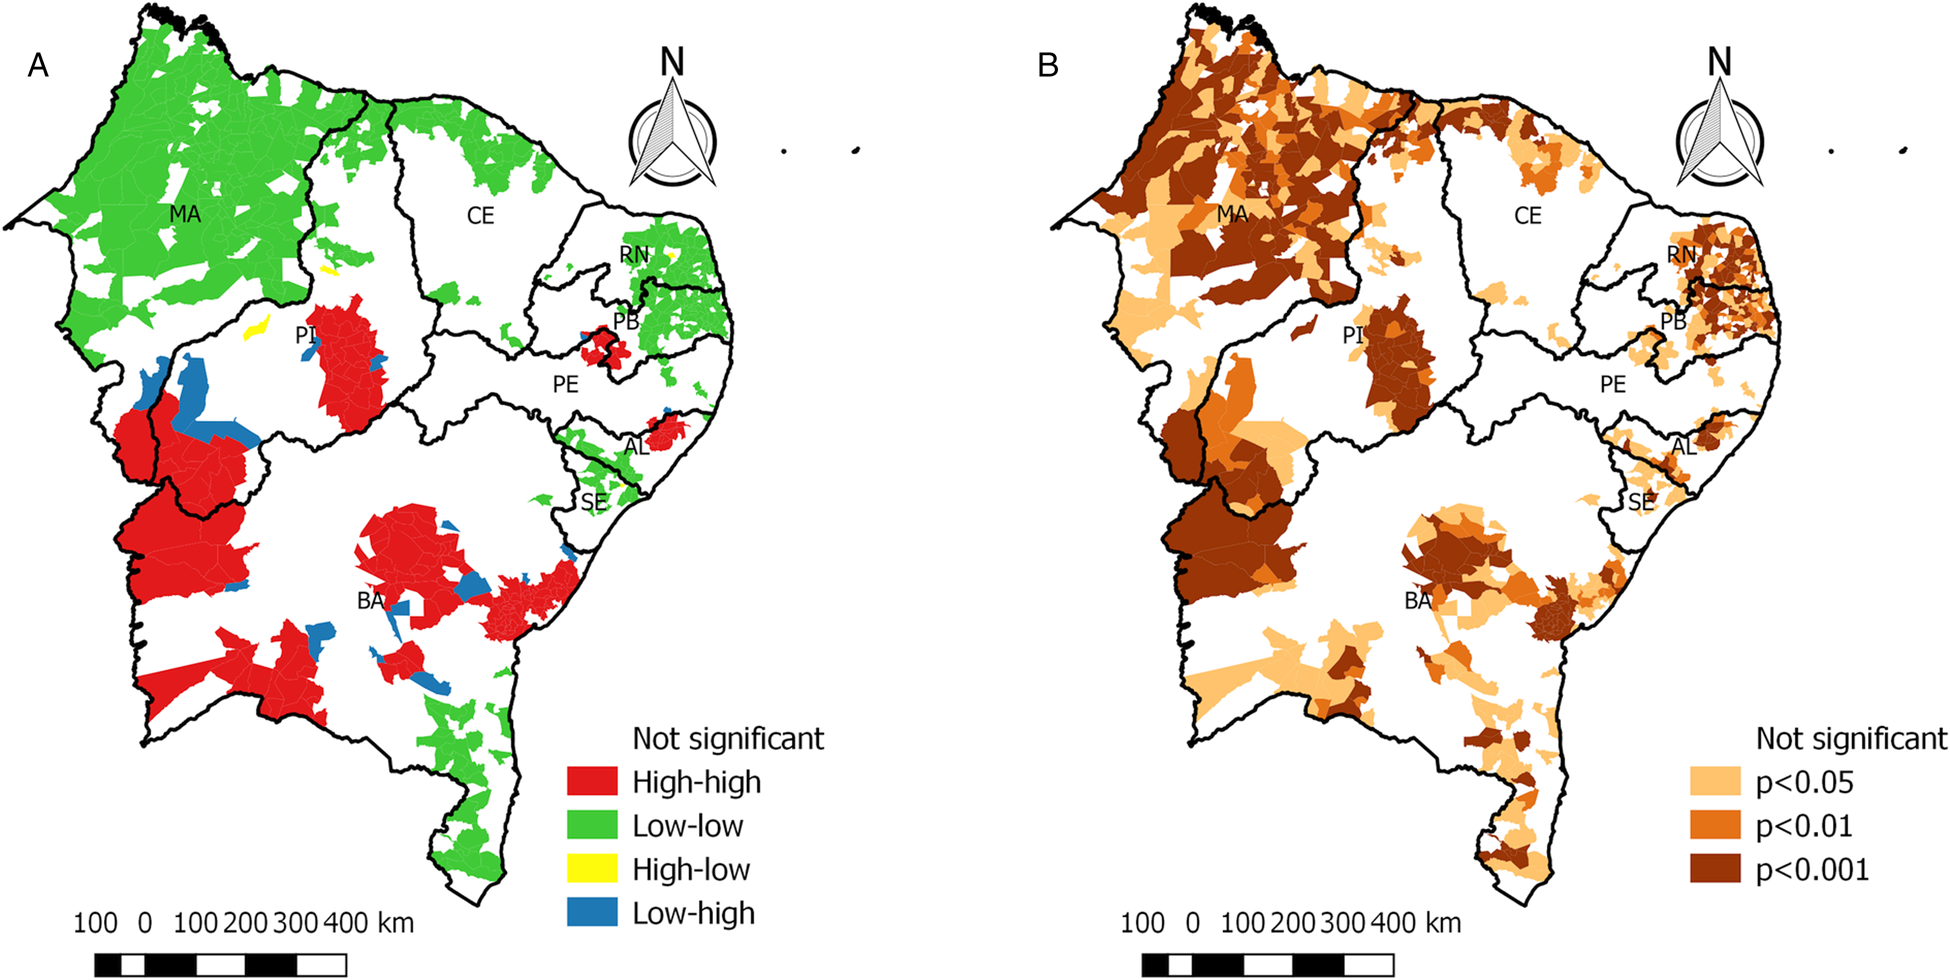
In the analysis of the spatial autocorrelation, the Global Moran Index was equal to 0.68 (P = 0.01); this index indicates high positive spatial autocorrelation. Furthermore, the Local Moran Index enabled the identification of spatial clusters (Fig. 4A), where the high-high patterns were in Bahia, Piauí, Maranhão, Alagoas, and some municipalities between the border of Paraíba and Pernambuco. The main low-low clusters were concentrated in Maranhão, Ceará, and Rio Grande do Norte. It was also possible to identify areas of epidemiologic transition (high-low, low-high). The LISA map (Fig. 4B) presents the significance of each cluster.
Moran's autocorrelation spatial map (Moran map) to the mortality of Chagas Disease in the Northeast of Brazil (A) and the cluster's significance-LISA map (B), 2007–2017.
Note: MA: Maranhão; PI: Piauí; CE: Ceará; RN: Rio Grande do Norte; PB: Paraíba; PE: Pernambuco; AL: Alagoas; SE: Sergipe; BA: Bahia; N: North.

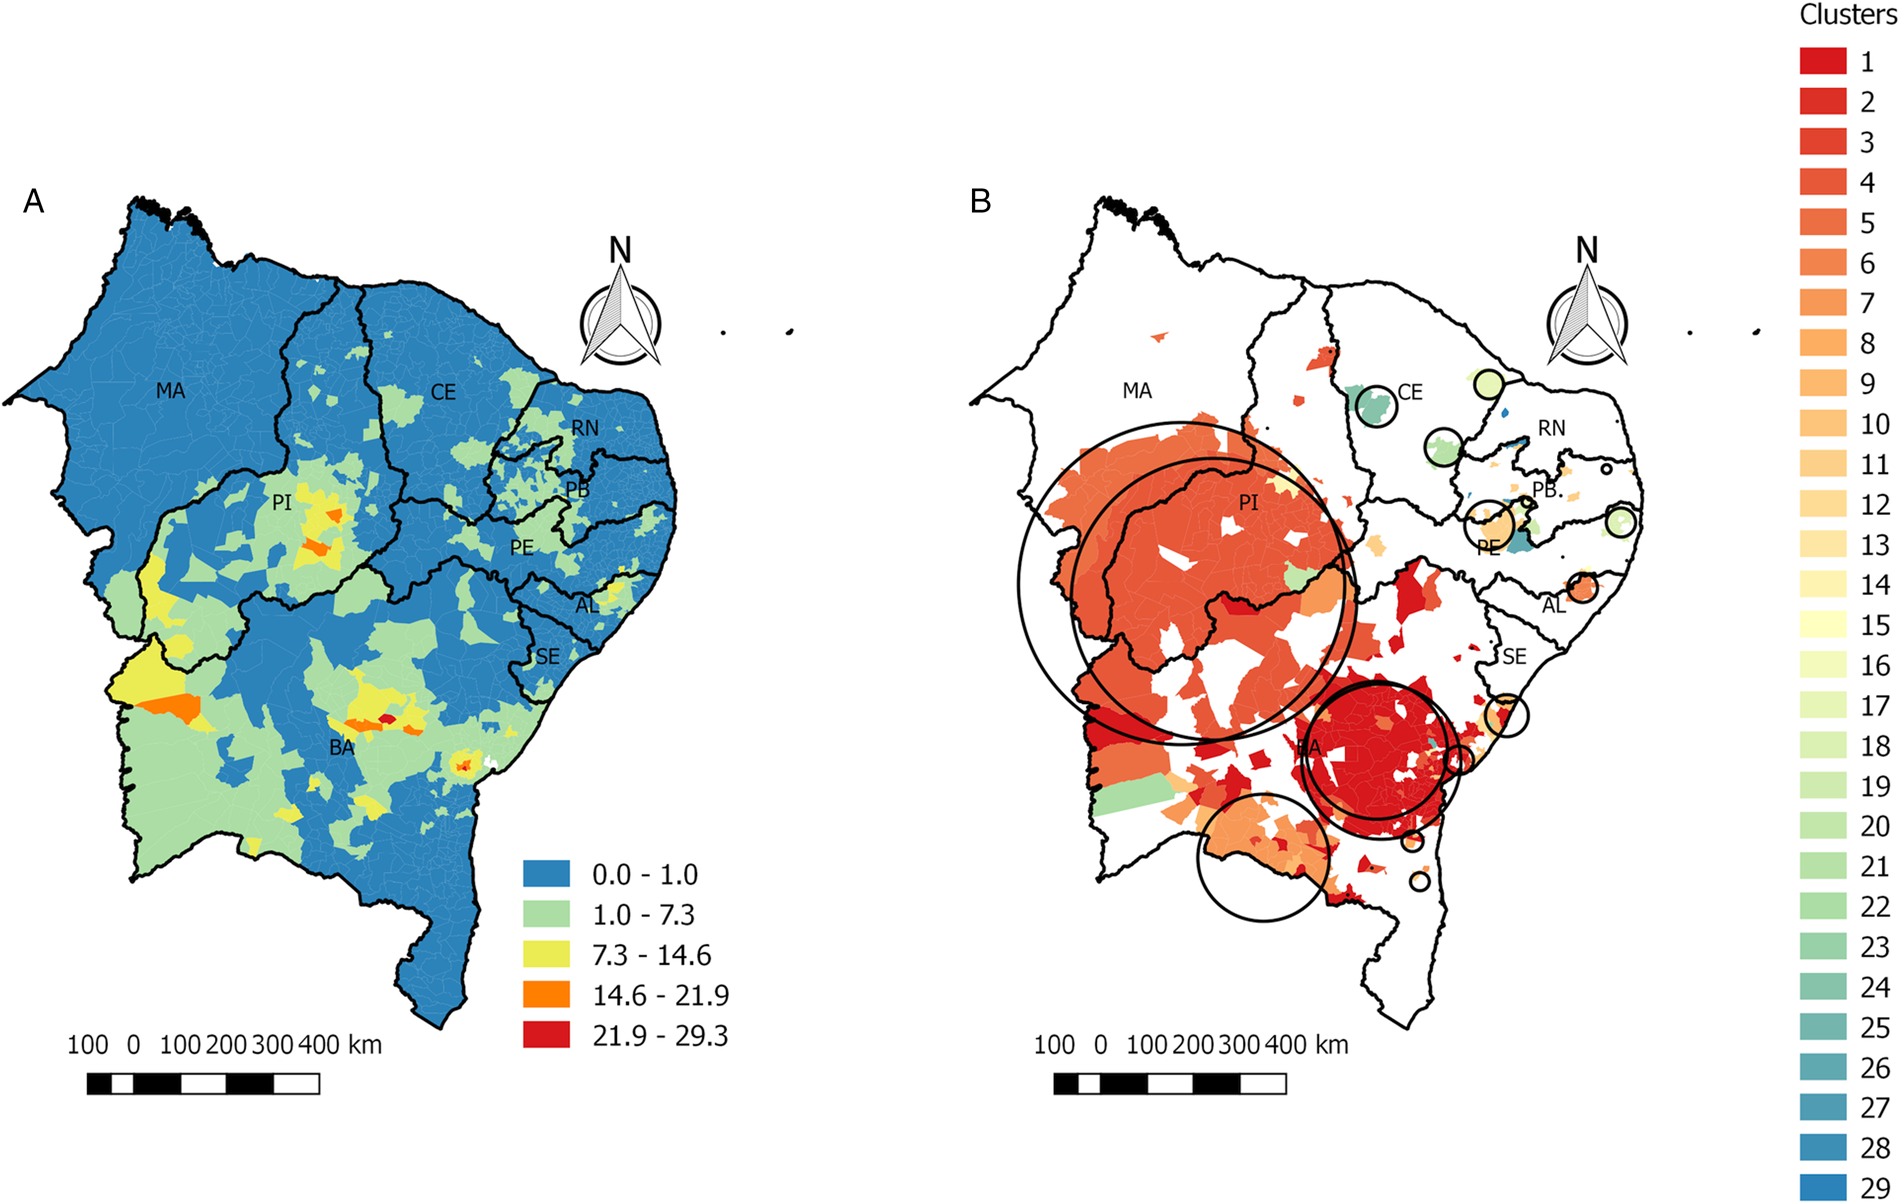
By applying the scan spatial statistics, it was possible to identify the risk of death by CD in the municipalities. Figure 5 shows that most of the region has areas with a very little relative risk of mortality (areas in blue), less than one (RR < 1); moreover, Maranhão can be highlighted as a state with low mortality rates because it is shown almost entirely in blue in the map (Fig. 5A), except in the municipalities of Benedito Leite and Alto do Parnaíba that borders the state of Piauí. On the other hand, the mortality rate was 29.3 times higher in some cities of Bahia (in red). The scan statistics have also identified 29 possible clusters in the whole region with 24 of them statistically significant (Fig. 5B).
Relative risk of mortality by Chagas Disease in all municipalities of the Northeast of Brazil (A) and their possible clusters (B), 2007–2017.
Note 1: MA: Maranhão; PI: Piauí; CE: Ceará; RN: Rio Grande do Norte; PB: Paraíba; PE: Pernambuco; AL: Alagoas; SE: Sergipe; BA: Bahia; N: North.
Note 2: Circles correspond to possible clusters with an error margin.

Discussion
Features as male sex, age range equal or higher than 70-years-old, mixed-race, and low schooling levels presented an association with CD mortality in this study as well in others (Guariento et al., Reference Guariento, Carrijo, Almeida and Magna2011; Mota et al., Reference Mota, Campos, Schramm and Costa2014; Brazil, 2019a; 2019b). However, this can happen not only for a direct causation process but due to sociocultural affairs related to health services.
Especially regarding sex and race, this relation seems to be stronger once no pieces of evidence regarding genetics and mortality can be found. Despite that, it was found an independent and strong association between the prevalent infection by T. cruzi and higher levels of African and Native American descent. If such association is a consequence of the genetic history or the differential exposure to the infection, it was not determined yet. (Lima-Costa et al., Reference Lima-Costa, Macinko, Mambrini, Peixoto, Pereira, Tarazona-Santos and Ribeiro2016).
Also, the population infected is neglected in different perspectives and presents higher vulnerability in health, which is expressed by the overlap and higher probability of illness, less access to health services or late search for those services. Besides, cultural aspects related to self-care and healthy lifestyle. This vulnerability is also presented in worse quality of health services, less probability of receiving essential treatments, less access to secondary and tertiary services, higher likelihood of developing severe forms of the disease, and, consequently, higher mortality (Dias et al., Reference Dias, Ramos Junior, Gontijo, Luquetti, Shikanai-Yasuda, Coura, Torres, Melo, Almeida, Oliveira Junior, Silveira, Rezende, Pinto, Ferreira, Rassi, Fragata Filho, Sousa, Correia Filho, Jansen, Andrade, Britto, Pinto, Rassi Junior, Campos, Abad-Franch, Santos, Chiari, Hasslocher-Moreno, Moreira, Marques, Silva, Marin-Neto, Galvão, Xavier, Valente, Carvalho, Cardoso, Silva, Costa, Vivaldini, Oliveira, Valente, Lima and Alves2015; WHO, 2015).
However, it is known that generally, CD has a chronicle character, which suggests that the disease will develop during the years, worsening its cardiovascular and/or digestive complications in the elderly population (Guariento et al., Reference Guariento, Carrijo, Almeida and Magna2011; Borges-Pereira et al., Reference Borges-Pereira, Coura, Zauza, Pirmez and Xavier2020). Beyond that, when investigating the relation of CD and inflammatory cytokines, it was verified that elderly people present higher serum levels of those cytokines, both regarding cardiac and oesophageal injury, and the most severe form of the disease (de Araújo et al., Reference de Araújo, Lima Torres, Viana Peixoto, Pinho Ribeiro, Vaz Melo Mambrini, Bortolo Rezende, Lima Silva, Loyola Filho, Teixeira-Carvalho, Lima-Costa and Martins-Filho2020). These findings, summed by the possible coexistence of CD with chronic noninfectious diseases in the elderly (Guariento et al., Reference Guariento, Carrijo, Almeida and Magna2011), may contribute to worsening the prognosis in this age range.
The Northeast draws attention because the occurrence of cases is less frequent when compared with the Northern Region; however, the mortality rates have increased or remained stable over the years. The region is the second in the number of cases and the third in mortality (Brazil, 2019b). This can be explained in part by the low impact on the transmission dynamics caused by the elimination of CD main vector, Triatoma infestans (T. infestans), since it was not frequent in the region (Guariento et al., Reference Guariento, Carrijo, Almeida and Magna2011). In contrast, it can still be found different species of autochthonous triatomes, with an elevated potential of colonization, plus the persistence of residual focus of T. infestans in municipalities of Bahia (Brazil, 2019b).
Thus, the Northeast of Brazil deserves attention, mainly for three reasons: it concentrates the largest number of secondary vectors involved in the transmission of the disease, especially Triatoma brasiliensis (T. brasiliensis), whose daily habits make it difficult to locate, capture and the regularity of controlling by insecticides; the region maintains high rates of poor housing conditions, appropriate to colonization by the triatomine; inspection and entomological control measures have not been effective (Brazil, 2019a).
The interruption of Chagas disease transmission by T. infestans had little (Maranhão, Sergipe, Alagoas, Pernambuco, Piauí e Paraíba) or no effect (Ceará e Rio Grande do Norte) in states in the Northeast, probably, because T. brasiliensis and Triatoma pseudomaculata (T. pseudomaculata) are native species of the region (Martins-Melo et al., Reference Martins-Melo, Ramos Junior and Heukelbach2016; Brazil, 2019a). Therefore, it is recommended the regular and continuous chemical controlling of the vector in all domiciliary units with the occurrence of the cited species (Brazil, 2019a). This is necessary because any interruption in control programs may allow new infestations in the domiciliary habitat.
Thus, according to the results of the present research, Bahia, Piauí, Maranhão, Alagoas, Paraíba, and Pernambuco were identified as outstanding states when demonstrating the spatial clusters of CD deaths in the Northeast.
In this scenario, Bahia and Pernambuco were at first considered endemic areas, with the registered vectorial home transmission, and were submitted to an extended period of intense chemical control operations, which resulted in almost complete elimination of the main vector in the country (T. infestans), limiting the risk being to more or less focal transmission, mainly by native species (Dias et al., Reference Dias, Ramos Junior, Gontijo, Luquetti, Shikanai-Yasuda, Coura, Torres, Melo, Almeida, Oliveira Junior, Silveira, Rezende, Pinto, Ferreira, Rassi, Fragata Filho, Sousa, Correia Filho, Jansen, Andrade, Britto, Pinto, Rassi Junior, Campos, Abad-Franch, Santos, Chiari, Hasslocher-Moreno, Moreira, Marques, Silva, Marin-Neto, Galvão, Xavier, Valente, Carvalho, Cardoso, Silva, Costa, Vivaldini, Oliveira, Valente, Lima and Alves2015).
Therefore, since 2005, the implementation of the National Chagas Disease Control Program has proposed a methodology for assessing the risk of vector transmission, analysing the municipalities according to the infestation criteria, environmental, and socioeconomic indicators. As a result, 16 states, including Bahia, had their municipalities classified as low, medium, or high risk for vectorial transmission of CD. Among the 417 municipalities of Bahia, 101 (24.2%) are classified as low risk, 219 (52.5%) medium risk, and 97 (23.3%) high risk (Bahia, 2018).
Moreover, it can be highlighted the prevalence and endemicity of CD in Piauí. Studies have noticed the prevalence of seroreactivity of 11.6% in some cities of the state, value almost twice the state mean. It was also identified that uneducated males living in rural areas as the main CD prevalent group (Santana et al., Reference Santana, Souza and Almeida2018). These results enhance the need for effective public health strategies focused on the groups that most need assistance in the Northeast Region.
Some municipalities of the State of Maranhão were also within the spatial cluster, with 32 acute cases of CD reported from 1994 to 2008, in which only 18 were in the SINAN records. In this state, infection by T. cruzi appears predominantly in the wild environment, suggesting that the control and certification actions must be evaluated in the geographical areas. The cases registered in Maranhão reflect the precarious living conditions of the population of rural areas with a high prevalence of the disease (Cutrim et al., Reference Cutrim, Almeida, Gonçalves and Silva2010).
In this context, the control and treatment of CD are priorities in the demand for NTDs in the Northeast, which suggests the development of new strategies for monitoring the disease to maintain the reduction of mortality trends in the region.
The main limitation of this study is the use of secondary data and SIM-SUS, which depends on the notification of the health professionals, and may have non-notified cases. However, Brazilian health systems can provide greater articulation between the public and the private sector, promoting insights for strategic sectors in the public health area.
Concluding remarks
In this study, it was possible to identify the spatial pattern related to CD in the Northeast of Brazil, where the distribution of mortality cases occurs in spatial clusters, highlighting specific states that need greater control and planning of health services, especially in Bahia and Piauí.
The identification of the spatial pattern of CD in the Northeast may provide subsidies for the development of actions with a focus on stratified areas as the main areas at risk, by pointing out the states that need the greatest contribution of interventions, as well as social and public health policies focused on this issue.
Ethical standards
The study did not need the approval of the Research Ethics Committee (CEP) for its accomplishment once the data is freely available on the Internet by the Brazilian Government. Yet, the authors followed the precepts of Resolution 510/2016 that deals with the use of secondary data.