1. Introduction
Celestine (SrSO4; also spelled celestite) is a common mineral often occurring as large, clear and colourless to delicate blue crystals in visually appealing geodes and nodules of sedimentary association worldwide (Verber & Stansbery, Reference Verber and Stansbery1953; Thomas, Reference Thomas1968; King, Reference King1991; Lobell, Reference Lobell1992; Cook, Reference Cook1996; Pezzotta, Reference Pezzotta2001; Smith, Reference Smith2010) and has recently sparked additional interest (Heaney, Reference Heaney2012). Celestine is a mineral that usually precipitates when Sr-bearing fluids come in contact with sulphate-rich solutions or rocks in a variety of sedimentary settings and potentially over a large temperature range (25–200°C; Hanor, Reference Hanor2000, Reference Hanor2004).
In this study we examine an occurrence of celestine geodes near the contact of a Lower Cretaceous basaltic dyke (picturesquely named the ‘Black Heart dyke’; Mazor & Shoval, Reference Mazor and Shoval1987) with shales and dolostones of the Lower Jurassic Ardon Formation, located in Makhtesh Ramon, Israel. The geodes have been described before by Goldbery (Reference Goldbery1979, Reference Goldbery1982), but the explanation for their formation was non-conclusive. Based solely on field evidence, three models were given: (1) formation in a hyper saline environment (Goldbery, Reference Goldbery1979); (2) formation by pedogenesis (Goldbery, Reference Goldbery1979); and (3) formation in a post-pedogenetic diagenetic setting (Goldbery, Reference Goldbery1982).
Although the Ardon Formation is rich in Ca-sulphates and celestine is commonly observed to overgrow and replace Ca-sulphates elsewhere (West, Reference West1973), the Ardon Formation is mostly devoid of celestine. The sole occurrence of celestine geodes near the dyke–shale contact raises an interesting question concerning possible genetic links between precipitation of celestine and the basaltic magmatism. It could be hypothesized that either the heat needed for thermal convection of brines or leaching of dyke-hosted Sr (or both) might have facilitated the formation of the celestine geodes. In order to shed further light on the formation of the geodes and examine potential links to the magmatic activity, it is necessary to (1) account for the origin of both the sulphate and the Sr in celestine, and (2) constrain the mineralizing fluid conditions and composition.
Here we distinguish ‘geode’ from ‘nodule’ and ‘concretion’. Minerals in a geode grow from the rim inwards, while this is not necessarily the case in a nodule or concretion. Mineral abbreviations used in this manuscript are: Qtz – quartz; Cal – calcite; Cls – celestine; Anh – anhydrite; Fex – Fe-oxide; and Gp – gypsum.
2. Geological setting
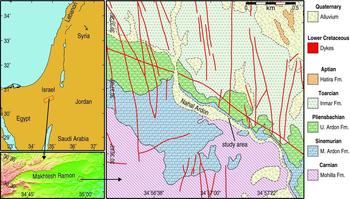
Makhtesh Ramon is an erosional landform at the heart of the Negev highlands of southern Israel (Fig. 1). It serves as a window into Triassic, Jurassic and Lower Cretaceous rocks that are otherwise not exposed in the area. Nahal (wadi) Ardon is situated in the eastern part of Makhtesh Ramon, uncovering Late Triassic and Early Jurassic sequences (Fig. 1). The sequences comprise two perievaporitic successions, separated by a major unconformity (Goldberg & Friedman, Reference Goldberg and Friedman1974; Livnat, Flexer & Shafran, Reference Livnat, Flexer and Shafran1986; Benjamini, Hirsch & Eshet, Reference Benjamini, Hirsch, Eshet, Hall, Krasheninnikov, Hirsch, Benjamini and Flexer2005; Hirsch, Reference Hirsch, Hall, Krasheninnikov, Hirsch, Benjamini and Flexer2005). These successions include the Carnian Mohilla formation (Zak, Reference Zak1963), which is truncated by a weathering profile and refilled by the Mish'hor formation laterites (Goldbery, Reference Goldbery1979). This unconformity is in turn conformably overlain by the Sinemurian–Pliensbachian evaporitic to clastic succession of the Ardon Formation (Buchbinder & le Roux, Reference Buchbinder and le Roux1993), followed by the late Pliensbachian–Toarcian clastic Inmar formation and the Middle Jurassic clastic to carbonate Mahmal Formation (Garfunkel & Katz, Reference Garfunkel and Katz1967). Lower Cretaceous magmatic activity in Israel and nearby areas interrupted the prolonged Jurassic sedimentation and subsidence of the region, and caused significant uplift and erosion. A first magmatic pulse, characterized by shallow intrusions, occurred at 140–125 Ma and was associated with crustal heating, uplift and erosion that produced a regional unconformity, which extended over the entire country and adjacent areas (Garfunkel, Reference Garfunkel1989; Garfunkel, Reference Garfunkel1991). Reconstruction of the missing section by Garfunkel & Derin (Reference Garfunkel and Derin1988) shows that maximal truncation occurred in the central Negev, where nearly 1000 m of sedimentary rocks were removed by erosion, indicating a Lower Cretaceous uplift swell at least 150 km wide. Field relations show that the erosion started after the beginning of magmatism and continued as long as the magmatic activity took place. A second magmatic pulse (120–110 Ma; Segev, Weissbrod & Lang, Reference Segev, Weissbrod and Lang2005) was characterized mainly by extrusions of basalts but with no identifiable uplift (Garfunkel, Reference Garfunkel1989).
Geological map showing the Nahal Ardon area inside Makhtesh Ramon in the Negev highlands of southern Israel. The location of the Black Heart (BH) dyke is marked. Ages of formations are generalized due to limited stratigraphical constraints.

2.a. The Ardon Formation
The Ardon Formation is a shallow-water to supertidal transitional unit from evaporite-carbonate domain to siliciclastic domain (Buchbinder & le Roux, Reference Buchbinder and le Roux1993; Hirsch, Reference Hirsch, Hall, Krasheninnikov, Hirsch, Benjamini and Flexer2005). The lower Ardon Formation is not exposed in the Nahal Ardon outcrop. The lower portion of the exposed part of the formation comprises alternation of shales, carbonate beds (Fig. 2a) and occasional gypsum intervals. The carbonate beds consist of dolostone and rare limestone. The upper portion of the unit is composed of alternations of shales, sand and sandy dolostones. Calcium sulphate and carbonate nodules, geodes and concretions of various forms are reported as common in the shales (Nissenbaum, Reference Nissenbaum1967; Buchbinder & le Roux, Reference Buchbinder and le Roux1993). These features are attributed to sabkha conditions as well as subaerial diagenesis during syn-sequence episodes of exposure.
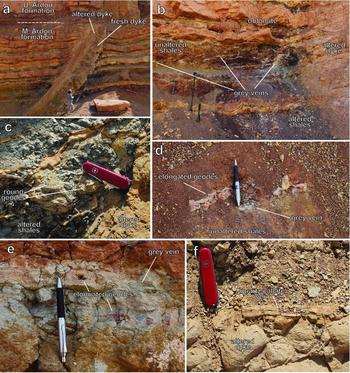
Field photographs. (a) The Black Heart dyke and the Ardon Formation, looking north. O.M.B is 189 cm tall for scale. (b) Appearance of the geode-bearing grey veins adjacent to the dyke. (c) In situ appearance of the round geodes. (d) In situ appearance of the elongated geodes. Grey vein is concealed by talus. (e) Elongated geodes inside grey veins. (f) Quartz calcite vein inside the dyke.

2.b. Dykes in Nahal Ardon
The dykes in Nahal Ardon are part of the widespread Lower Cretaceous igneous pulse consisting of numerous dykes, sills and laccoliths (Baer & Reches, Reference Baer and Reches1987, Reference Baer and Reches1991). The dykes are oriented in a north–south direction and are mostly weathered into various secondary minerals, most notably white kaolinite clay. The Black Heart (BH) dyke is the only dyke in Nahal Ardon that retains a fresh black basalt core (hence the name, Fig. 2a). This dyke was the focus of several studies on the alteration process (Teutsch, Kolodny & Ayalon, Reference Teutsch, Kolodny, Ayalon, Baer and Heimann1995; Teutsch, Ayalon & Kolodny, Reference Teutsch, Ayalon and Kolodny1996) and contact metamorphism of the country rocks (Summer & Ayalon, Reference Summer and Ayalon1995).
3. Analytical methods
3.a. Electron microscopy
Secondary electron (SE) and back-scattered electron (BSE) imaging was conducted using the JEOL JSM-7400F scanning electron microscope (SEM) at the Ilse Katz Institute for Nanoscale Science and Technology at the Ben-Gurion University of the Negev (BGU). Energy-dispersive spectroscopy (EDS) analysis was made using a Thermo NORAN System SIX detector. Accelerating voltage was 15 kV and beam current 10 nA. Counting time was 60 s for most analyses, and we used 100 s for analysing phases that had a low concentration of the elements of interest (Ba, Fe).
3.b. Fluid inclusions
A set of 0.1–0.2-mm-thick sections polished on both sides was prepared. Fluid inclusions in these sections were examined using a Fluid INC heating-freezing stage at temperatures of −190°C to 400°C. The accuracy of temperature measurements is ±0.5°C in the low temperature range (−190°C to 50°C) and ±2°C in the high temperature range (50°C to 400°C).
3.c. Raman spectroscopy
A Raman system was used for identification of solid phases inside fluid inclusions. The Raman system consists of a Jobin-Yvon LabRam HR 800 micro-Raman system, equipped with a liquid-N2 cooled detector and an argon laser at 514.5 nm. The laser power on the sample was c. 5 mW. The measurements were taken with a 600 g mm−1 grating and a confocal microscope with a 100 μm aperture. A typical measurement was taken for 30 s and ambient temperature was 22°C.
3.d. Radiogenic and stable isotopes
Sr isotope ratios were measured in celestine and calcite of the geodes, plagioclase from the dyke and dyke whole-rock powder and dolostones of the Ardon Formation. The basalt contains calcite veins, so the powered whole-rock was immersed in 10% cold acetic acid to dissolve the calcite prior to analysis. The pure carbonate fraction of the dolostone was recovered by reacting powdered rock with warm 1 M hydrochloric acid.
Sr was separated by standard cation exchange methods using Dowex 50 W x8 200–400 mesh resin with the Sr isotope ratios determined on the Sector 54 VG mass-spectrometer at the University of Cambridge using triple collector dynamic algorithm and normalized to 86Sr/88Sr of 0.1194 using an exponential fractionation correction. The internal standard NBS 987 gave 0.710260±0.000009 (1σ) on 92 separate measurements made in the last two years. Sr blanks were less than 250 pg and negligible, given the Sr concentration of these samples.
Samples for sulphur isotope ratio analysis were processed in the Laboratory for Ocean Biogeochemistry and were measured in the Godwin Laboratory at the University of Cambridge. Celestine and the gypsum separates were combusted at 1030°C in a Flash Element Analyser, and the resulting sulphur dioxide (SO2) was measured by a continuous-flow gas source isotopic ratio mass spectrometer (Thermo Delta V Plus). Samples were corrected to NBS-127 (δ34S = 20.3‰) and reported relative to Vienna Canyon Diablo Troilite (VCDT). The samples were weighed and the intensity of each sample was compared to the NBS-127 standard to ensure high yield during combustion. The error was determined using the standard deviation of the standard at the beginning and the end of each run (σ c. 0.2‰).
Calcite samples were reacted with 100% orthophosphoric acid in helium-flushed vials and then measured for carbon isotopes in a continuous-flow isotopic gas source ratio mass spectrometer (Thermo Delta V) coupled to a Gas Bench II interface at the Ben Gurion University of the Negev. The reference gas was calibrated using the NBS-19 standard (δ13C = 1.95‰). An internal standard, Carrara marble (δ13C = 4.7‰), was measured every five samples.
4. Field description and petrography
4.a. Outcrop scale observations
The BH dyke cuts vertically through the Ardon Formation, and has altered the adjacent shales into a black- to dark-purple-crimson-coloured rock (Fig. 2a, b). The geodes occur mainly inside grey-coloured vein-like protrusions that extend from the dyke laterally into the shales. There are cases where the geodes occupy the entire thickness of the protrusion, making it hard to define as such (e.g. Fig. 2c). There are two main types of geodes: round and elongated (Fig. 2c–e). Round geodes are concentrated adjacent to the dyke and as much as 50 m away, whereas the elongated geodes are mostly found at distances of 2–10 m from the dyke. Quartz–calcite veins, c. 1.5 cm thick, penetrate both the shales and the dyke (Fig. 2f).
4.b. Description of the geodes
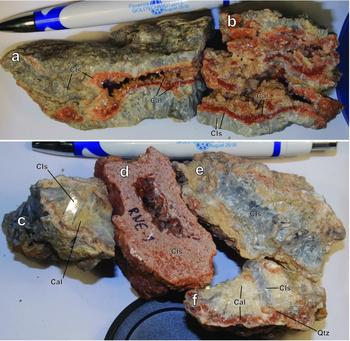
The elongated geodes are usually long and flattened horizontally, up to 20 cm long, 10 cm wide and 5 cm thick, although commonly smaller. Figure 3a shows the common appearance of such geodes. They consist of blue-grey celestine forming the rim of the geode, extending 1–4 cm inwards. The cores of the geodes consist of a cavity filled with yellow calcite scalenohedra up to 5 mm long. The celestine bears a salmon-pink colour in an altered thin zone (commonly several millimetres) surrounding the cavity. Calcite is commonly dark red at the bottom of the cavities. There are some elongated geodes that are more complex (Fig. 3b), but the basic structure remains similar.
Sample photographs. (a, b) Elongated geodes positioned in true orientation. (c–f) Round geodes.

Round geodes (Fig. 3c, e, f) are up to 10 cm in diameter but are usually c. 5 cm long. The rim of the geode is composed mostly of calcite and celestine crystals that radiate inwards. Celestine is usually euhedral and can be up to 3 cm long (e.g. Fig. 3c). Cavities, which are rare in the round geodes, are up to 1 cm in diameter. Some geodes contain virtually no calcite (Fig. 3e), whereas calcite is abundant in others (Fig. 3f). Euhedral quartz prisms are common in the round geodes, hereafter referred to as primary quartz.
There are rare occurrences of fine-grained celestine with high porosity (Fig. 3d). Celestine in such geodes is completely altered and salmon coloured, with virtually no remaining traces of the original blue colour.
4.c. Petrography
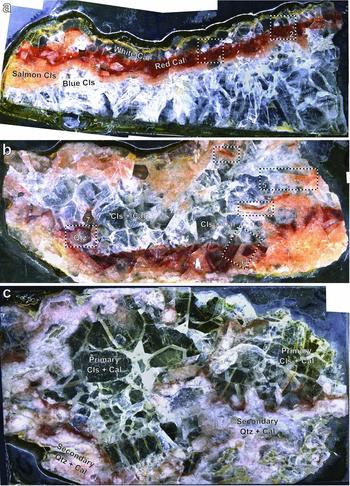
Figure 4a shows a polished slab of an elongated geode. The red colouration of the calcite forms a layer that cuts through all grains, best seen at points 1 and 2. A polished slab of a round geode is shown in Figure 4b, displaying similarly shaped crystals of calcite and celestine distinguished by their colour. It is evident that red calcite is not restricted to the bottom of cavities, but also occurs on top of pre-existing celestine crystals (such as at points 3 and 4). The salmon alteration of celestine is associated with red calcite, and is mostly located in the upper part of the crystals (e.g. point 5). At the bottom of the geode, salmon alteration parallels red calcite, as is clearly seen at point 6. Red calcite is not restricted to contacts with celestine but also occurs commonly on top of primary quartz, such as in point 7. Figure 4c shows a completely filled geode with no cavities, but with cloudy intergrowths of calcite and secondary quartz replacing the original calcite and celestine.
Polished thick sections (>100 μm) of (a) an elongated geode and (b, c) round geodes. Width of all photos is c. 2.5 cm.

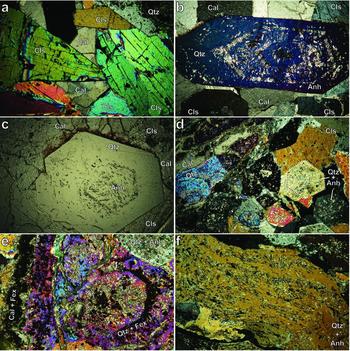
The relative timing of primary mineral growth can be inferred from the photomicrographs shown in Figure 5a and b. Primary quartz is always euhedral and its growth has not been limited by any other pre-existing crystals. Primary quartz commonly contains anhydrite inclusions that are frequently concentrated along growth zones (Fig. 5b, c), although there are cases where anhydrite inclusions are extremely abundant and randomly located within the quartz prisms (Fig. 5d). Celestine is never isolated and is always in contact with either quartz or other celestine crystals (Fig. 5a). Celestine commonly impinges upon and is therefore truncated by quartz. Celestine occasionally contains anhydrite inclusions, although these are less common than in quartz (Fig. 6a, b). These inclusions occur in both primary blue celestine and in salmon celestine. Calcite is always interstitial. It is therefore inferred that primary quartz is the earliest phase, followed by celestine and finally by calcite.
Primary textures in geodes: (a) interstitial calcite and celestine impinging on quartz; and (b) euhedral quartz prism with anhydrite inclusions. Photos were taken with crossed polars on thicker-than-usual sections. Width of photos is 6 mm. Secondary textures in geodes: (c) red calcite on top of euhedral quartz (plane-polarized, width of photo is 6 mm); (d) calcite and quartz in altered zone of a geode (dotted line marks the original shape of primary quartz, later overgrown by secondary quartz; cross-polarized, width of photo is 6 mm); (e) primary quartz overgrown by Fe-oxide-rich secondary quartz (cross-polarized, width of photo is 3 mm); and (f) oriented anhydrite inclusions in secondary quartz (cross-polarized, width of photo is 6 mm).

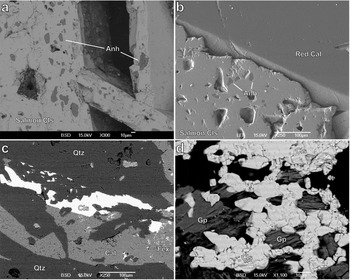
Scanning electron microscope images. (a) Backscattered electron (BSD) image of anhydrite inclusions inside altered salmon celestine. (b) Secondary electron image showing salmon celestine and red calcite contact. (c) BSD image of partly dissolved celestine in an altered zone. (d) BSD image of celestine in an alabaster nodule.

The red colouration associated with calcite, caused by micrometer-sized iron oxide inclusions, is not seen in primary quartz as opposed to celestine (Fig. 5c). Nonetheless secondary quartz that commonly grows in optical continuity with primary quartz and, like primary quartz, contains numerous anhydrite inclusions (sometimes oriented, Fig. 5d) is also rich in iron oxide inclusions. Altered zones of filled round geodes consist of vein-like intergrowths of secondary quartz and calcite (Fig. 5d–f). Ghosts of partly dissolved celestine can be frequently seen in such zones (e.g. the formerly rectangular celestine crystal in Fig. 6c).
The contact interface between salmon celestine and red calcite is of interest: Figure 6b shows that salmon celestine consists of many dissolution holes whereas the calcite shows no such features. Furthermore, calcite does not fill the holes in the celestine, suggesting that it precipitated either faster or before the celestine dissolution occurred.
4.d. Mineral chemistry
The chemical compositions of minerals measured by EDS are given in Table 1. Celestine in round geodes consists of mostly pure SrSO4 with randomly dispersed Ba-bearing patches. Such patches are composed of 2.6% barite component on average. Celestine in elongated geodes is pure without any detectable amount of Ba. We found a single occurrence of celestine with 32.5% barite component inside a quartz–calcite vein, but it is uncertain whether this is a true member of the solid solution or rather a sub-microscopic intergrowth of celestine and barite. Both red calcite and salmon celestine are characterized by detectable iron contents (7.3% and 2.2% by mole, respectively).
Chemical composition of minerals from the geodes, based on molar percentages normalized to 100%

5. Fluid inclusions
5.a. Fluid inclusion assemblage
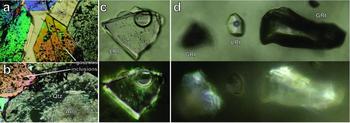
Fluid inclusions are abundant in celestine whereas no fluid inclusions suitable for study have been found in calcite. Inclusions in celestine are mainly single-phase gas or two-phase liquid-poor and gas-rich (GRI). The size of fluid inclusions ranges from c. 10–20 μm to 200 μm. They show primary character and are very abundant, forming chevron-shaped clouds of fluid inclusions in celestine cores (Fig. 7a, b). Single-phase liquid and two-phase gas-poor and liquid-rich inclusions (LRI) commonly occur in the rims of celestine, but have also been observed in the cores within the clouds of GRI. There are also clear celestine grains that do not contain clouds of GRI but are rich in LRI. LRI are both randomly distributed and linearly arrayed, indicating their primary and pseudosecondary origin, respectively. No secondary inclusions have been found. Inclusions that occur in the same sector commonly show very different liquid/gas ratios from c. 10 vol% to 95 vol% of the gas phase.
Photomicrographs of fluid inclusions. (a, b) Chevron-shaped clouds of GRI in the core of celestine and clear zones in the rims. Cross-polarized, width of photos is c. 3 mm. (c) Fine-grained metastable solid phase in a LRI. Top: plane-polarized; bottom: cross-polarized. Width of photo is 100 μm. (d) Solid phase in gaseous inclusions. Top: plane-polarized; bottom: cross-polarized. Width of photo is 200 μm.

Fluid inclusions in quartz are very similar to those hosted by celestine, but are much rarer. Some quartz crystals contain no fluid inclusions at all while others have few.
5.b. Solid phases
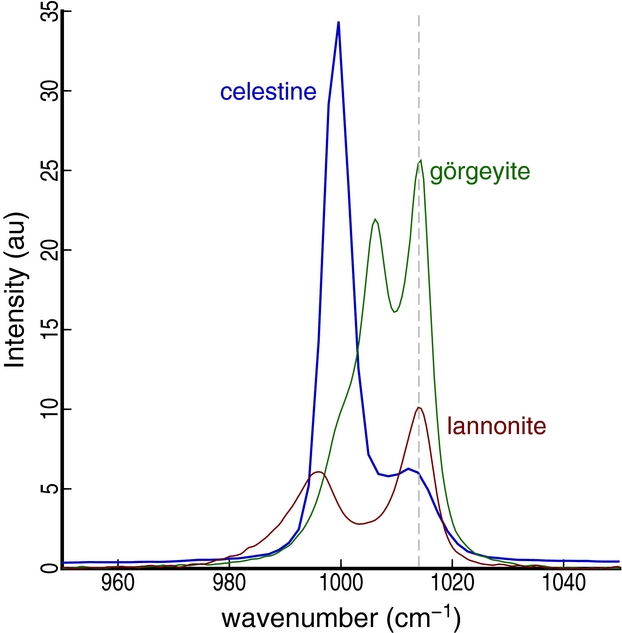
Solid birefringent phases have been observed in some fluid inclusions. These phases occur in both LRI (Fig. 7b) and GRI (Fig. 7c). It is very likely that solids in apparently single-phase gas inclusions actually reside in volumetrically small liquid phases. We were able to identify two solid phases: calcite and a sulphate phase. Calcite is rare, occurring only in a handful of inclusions. The sulphate phase is more common but in most cases the Raman signal from the solid phase was too weak to identify, being masked by the strong signal of the host celestine. Only in 4 out of 13 measurements was it possible to resolve a spectral peak distinct from that of celestine. Figure 8 shows the major spectral peak of the host celestine (at 999 cm−1) together with the peak of the solid phase hosted in the inclusion (at 1013 cm−1). The RRUFF database (Downs, Reference Downs2006) gives two possible candidates: görgeyite (K2Ca5[SO4]6·H2O, also spelled goergeyite) and lannonite (HCa4Mg2Al4[SO4]8F9·32[H2O]), both with peaks at 1014 cm−1. Lannonite is unlikely to be the solid phase because it forms in F-rich ore deposits (Williams & Cesbron, Reference Williams and Cesbron1983). On the other hand, görgeyite is a mineral that occurs in evaporitic and hydrothermal, sulphate-rich, settings (Kloprogge et al. Reference Kloprogge, Hickey, Duong, Martens and Frost2004). Both minerals are hydrous Ca-sulphates; it is possible that the observed solid phase is another hydrous Ca-sulphate of which no Raman spectrum is available for comparison, because present knowledge of solid phases in hydrous calcium sulphate systems is lacking (Freyer & Voigt, Reference Freyer and Voigt2003).
Raman spectrum of sulphates. The measured spectrum in this study (blue) contains a strong peak of celestine and a weak peak of a solid phase inside hosted fluid inclusion. Spectra of görgeyite (green) and lannonite (red) from the RRUFF database are added for comparison. Intensity in arbitrary units. Different spectra are not to scale.

The solid phases are occasionally metastable. A small solid birefringent rod has been observed in one LRI at ambient temperature. After complete freezing and subsequent melting of the inclusion, the solid phase has been dissolved at a temperature of 14.5°C. After several days the inclusion has been observed again at ambient temperature and surprisingly, numerous tiny solid phases have nucleated (Fig. 7c).
5.c. Microthermometry
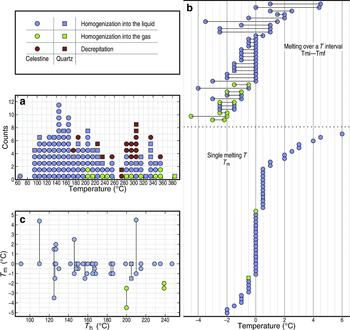
Temperatures of homogenization (T h) measured in the heating experiments are summarized in Figure 9a. Most LRI homogenized into the liquid at temperatures lower than 200°C, but some homogenized at higher temperatures of up to 350°C. Many GRI showed no discernible phase changes. Of the inclusions that did show phase changes, they homogenized into the gas at temperatures higher than 200°C and up to 380°C. Several inclusions (mostly LRI but also GRI) decrepitated during heating experiments. The solid phases commonly remained insoluble during heating.
Fluid inclusions microthermometry. (a) T h data for fluid inclusions. Each symbol is a single measurement. (b) T m data for fluid inclusions, arbitrarily sorted by increasing T m or T mf. (c) T h versus T m for a subset of the data that has corresponding T h and T m.

The homogenization temperatures should be dealt with some caution. GRI commonly include invisible, volumetrically small, liquid phases that may decrease the accuracy of the measured T h or may even make the detection of homogenization impossible (Bodnar, Burnham & Sterner, Reference Bodnar, Burnham and Sterner1985). This may explain why in some inclusions homogenization was not observed. Measured T h for other GRI might be underestimated by as much as 150°C (Bodnar, Burnham & Sterner, Reference Bodnar, Burnham and Sterner1985). On the other hand, fluid inclusions in barite (a mineral structurally and physically similar to celestine) commonly experience stretching when heated, which can lead to spuriously high T h (Ulrich & Bodnar, Reference Ulrich and Bodnar1988; Prezbindowski & Tapp, Reference Prezbindowski and Tapp1991). Partial decrepitation has indeed occurred for some LRI in celestine, especially at high temperatures. Inclusions that have been reheated to temperatures of 200°C repeat the same range of T h recorded during the first run. In contrast, inclusions that remained visually undamaged at temperatures higher than 200°C typically showed higher gas/liquid volume ratios than was observed prior to the heating run. Although decrepitation was not observed for these inclusions, some changes did occur. It is then clear that T h data higher than 200°C cannot be used for any quantitative conclusions. However, the occurrence of GRI by itself attests to the existence of a vapour phase during celestine growth, which can only occur at a certain minimal temperature. Furthermore, the spatial coexistence of both GRI and LRI suggests that a phase separation process (e.g. boiling) was in place.
Figure 9b shows the low-temperature systematics of the fluid inclusions. There are three distinct groups of fluid inclusions. The first group is dominated by LRI and consists of inclusions that melted (T m) at 0 to 0.5°C or melted over a range of temperatures (initial T mi; final T mf) with T mf of 0°C. The second less-abundant group consists of both LRI and GRI with T m or T mf lower than 0°C, of which the lowest T mi is −4.5°C. The third group consists of LRI with T m or T mf higher than 0°C. A plot of T m, T mi and T mf versus T h is shown in Figure 9c. There is no correlation between melting and homogenization temperatures.
6. Isotope ratios
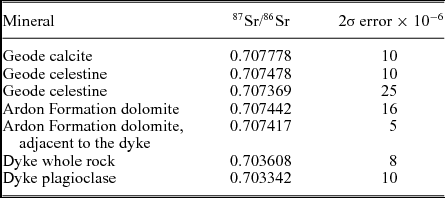
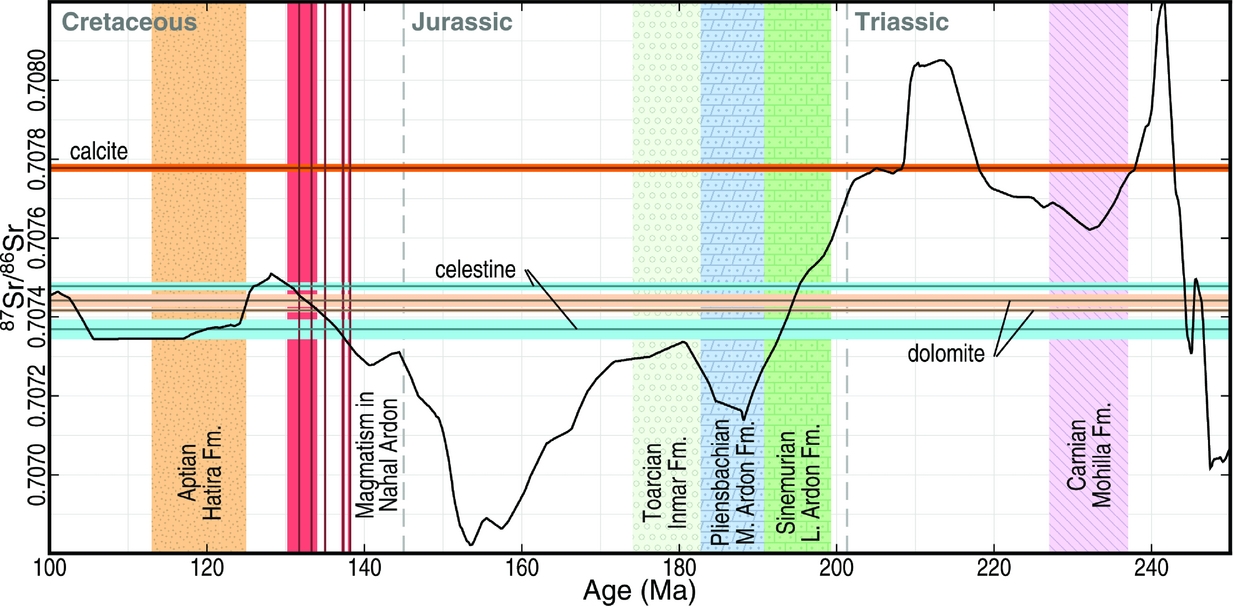
Results of the Sr isotope analysis are given in Table 2 and plotted in Figure 10. Two analysed celestine crystals have 87Sr/86Sr ratios that intercept the global seawater curve several times, although only two are relevant: (1) the deposition time of the Ardon Formation (c. 195 Ma) and (2) the age of the BH dyke in Nahal Ardon (c. 135 Ma). The Sr isotope ratios of dolostones from the sampled outcrop are similar to that of the celestine. Furthermore, assuming the measured ratio of the dolostones was preserved from primary deposition (which requires a syngenetic origin of the dolomite), we are able to corroborate the Lower Jurassic age inferred for the Ardon Formation (Hirsch, Reference Hirsch, Hall, Krasheninnikov, Hirsch, Benjamini and Flexer2005). The calcite 87Sr/86Sr ratio is much higher than that of the celestine and dolomite and in fact higher than any other seawater ratio during the Jurassic. 87Sr/86Sr ratios of the BH dyke are much lower, implying a mantle source for the basaltic magma.
Strontium isotope results

Sr isotope ratio versus age diagram relevant to the sequence of events in the Nahal Ardon exposure. Thick black line is the global 87Sr/86Sr seawater curve of Veizer et al. (Reference Veizer, Ala, Azmy, Bruckschen, Buhl, Bruhn, Carden, Diener, Ebneth, Godderis, Jasper, Korte, Pawellek, Podlaha and Strauss1999). Patterned bands show the stratigraphic column exposed in Nahal Ardon. Temporal extent of the formations is approximate. Vertical red lines represent ages of dykes in Nahal Ardon given in Teutsch, Ayalon & Kolodny (Reference Teutsch, Ayalon and Kolodny1996). Horizontal lines indicate Sr isotope ratios measured in this study. Pale-coloured margins of lines are analytical uncertainties (2σ).

Measured δ 34S of celestine is uniform at +19.9±0.5‰ VCDT (n = 15). Values are similar for the different types of celestine (blue, salmon, fluid-inclusion-bearing and absent) from different geode morphologies (round and elongated). Measured δ 34S of gypsum in alabaster nodules sampled laterally elsewhere in the Ardon Formation is +16.8±0.2‰ VCDT (n = 5).
δ 13C values of geodal calcite are also uniform. The average value was found to be −6.7±0.7‰ Pee Dee Belemnite (PDB) (n = 13), including both calcite in replacement texture (e.g. Fig. 6c) and interstitial-euhedral calcite (e.g. Fig. 5a).
The full sulphur and carbon isotope dataset is available in the online Supplementary Material (available at http://journals.cambridge.org/geo).
7. Discussion
7.a. What kind of fluids were involved and at what conditions?
7.a.1. Interpretation of fluid inclusion data
The occurrence of görgeyite (or another hydrous Ca-sulphate) in the fluid inclusions suggests that the trapped fluid consists of an aqueous calcium sulphate solution. In terms of their measured T m, inclusions can be divided into three salinity groups as described in Section 5.c. above. The eutectic temperature and salinity of the solution can be estimated using T mi values and T m or T mf values, respectively. Thus, the first group consists of either pure H2O or very dilute solutions. T mi in the range of −4 to −1°C is characteristic of sulphates (Borisenko, Reference Borisenko1977). The lack of phase relation data in hydrous calcium sulphate systems (Freyer & Voigt, Reference Freyer and Voigt2003) does not allow us to quantitatively determine fluid salinity, but it is possible to use the H2O–Na2SO4 system as an analogue (Lewis et al. Reference Lewis, Nathoo, Thomsen, Kramer, Witkamp, Reddy and Randall2010). The second group consists of inclusions with varying salinities in the range of c. 2–4 wt% equivalent Na2SO4. The third group consists of a frozen phase that persists metastably into T m or T mf above 0°C. The behaviour of this group is similar to many binary systems (although in this case it is probably better explained by a ternary system) that comprise H2O as one component (Corti & Abdulagatov, Reference Corti, Abdulagatov and Valyashko2008). At electrolyte (e.g. a sulphate) concentrations higher than that of the eutectic, the solid phase coexisting with a liquid at the liquidus is commonly a hydrated salt, the most notable example being hydrohalite (NaCl·H2O in the H2O–NaCl system; Bodnar, Reference Bodnar, Samson, Anderson and Marshall2003). Such hydrated solids are commonly metastable above their theoretical decomposition temperature, be it melting, incongruent melting or transformation into a less hydrous solid. The anomalously high T m of several inclusions and the existence of görgeyite (or possibly another hydrous Ca-sulphate) as a solid phase suggest that the third group consists of concentrated Ca-rich brine in the system H2O–CaSO4–K2SO4 (Freyer & Voigt, Reference Freyer and Voigt2004). In the H2O–Na2SO4 analogue system, this would correspond to brines with salinities slightly higher than c. 5 wt% equivalent Na2SO4. Higher salinities (> c. 20 wt% equivalent Na2SO4) are unlikely because of various metastability and immiscibility phenomena that were not observed in our heating–freezing experiments (Kotel'nikova & Kotel'nikov, Reference Kotel'nikova and Kotel'nikov2008, Reference Kotel'nikova and Kotel'nikov2010a , Reference Kotel'nikova and Kotel'nikov b ).
Celestine did not precipitate from chloride-bearing solutions. Such solutions (e.g. NaCl, KCl and CaCl2), although extremely common in celestine-forming environments (Hanor, Reference Hanor2000), would cause eutectic melting temperatures to be much lower than measured (Bodnar, Reference Bodnar, Samson, Anderson and Marshall2003). In addition, the freezing point depression for inclusions of seawater salinity is c. −2°C, but the majority of the measured inclusions melted at higher temperatures, precluding a seawater origin for the mineralizing fluids (Roedder, Reference Roedder1984).
Homogenization temperatures for fluid inclusions (Fig. 9a) show that there were two episodes of celestine growth. The first episode occurred at temperatures higher than 200°C and is represented by existence of abundant GRI inclusions that are concentrated in the interior of the crystals (Fig. 7a). The second episode occurred at temperatures lower than 200°C and is represented by smaller-sized LRI inclusions mostly in the rims of celestine.
7.a.2. Source of fluids and timing of mineralization
The occurrence of chloride-absent, pure or almost-pure, H2O inclusions suggests that the mineralizing solution was derived from meteoric water. It has been suggested that low-salinity inclusions in celestine could form by dilution of seawater (Li et al. Reference Li, Cai, Jiang, Cai, Jia, Zhang, Xiang and Yuan2012), but in our case this is not likely. Firstly, any formation water inside the sedimentary rocks should be saline due to their evaporitic origin and therefore could not dilute seawater. Secondly, dilution of seawater by mixing with meteoric water would not remove the chlorides from solution, but our data indicate that no chlorides are present at all.
The core to rim zonation in the nature and T h of fluid inclusions suggests that celestine was first precipitated at high temperatures (>200°C) followed by an episode of growth at lower (<200°C) temperatures. The continuous range of T h probably indicates that the transition from high- to low-temperature regime was not abrupt as may be implied by the chevron-shaped inclusion clouds, but rather the result of crossing a phase boundary from a vapour field to a liquid field.
The maximal burial depth of the Ardon Formation is estimated to be 1 km (Gvirtzman, Reference Gvirtzman2004), which has not reached temperatures higher than 50°C since deposition (Feinstein, Reference Feinstein1987). Consequently, the only way to precipitate minerals at high temperatures in the Ardon Formation is by advection of heated meteoric waters from the freshly intruded, gradually cooling dyke. This is supported by the occurrence of the geodes within vein-like protrusions emanating from the dyke (Fig. 2b, e). The cooling dyke served as a heat source for meteoric fluids and its contact with the country rock served as a pathway for meteoric fluids, flowing laterally away from the dyke and causing the mineralization. The intrusion of the dyke was dated using K–Ar methods to 130–135 Ma (Teutsch, Ayalon & Kolodny, Reference Teutsch, Ayalon and Kolodny1996); the mineralization is probably of the same age. At that time the central Negev was significantly elevated above sea level and groundwater was dominated by meteoric sources. The burial depth of the Ardon Formation at that time can be estimated using the fluid inclusions data. The coexistence of LRI and GRI suggests the fluid had separated into two phases: liquid and vapour. The low salinity of the fluid inclusions allows us to approximate it using the phase relations in a pure H2O system. The lowest T h into the gas (believed to represent the real boiling temperature; Bodnar, Reference Bodnar, Samson, Anderson and Marshall2003) is 200°C. The pressure that corresponds to this temperature on the boiling curve of H2O is c. 1.5 MPa (Wagner & Pruß, Reference Wagner and Pruß1999) suggesting (assuming hydrostatic pressure) a burial depth of c. 160 m. This value is by no means accurate: the system is not pure H2O and it is possible that the boiling temperature was not 200°C (for reasons described in Section 5.c. above). However, this depth is much shallower than the maximum burial depth and in agreement with isostatically and thermally driven uplift during the 140–125 Ma magmatic pulse (Gvirtzman & Garfunkel, Reference Gvirtzman and Garfunkel1997).
7.b. What is the source of strontium?
Diagenetic recrystallization of carbonates, transformation of Sr-rich aragonite to Sr-poor calcite and dolomitization of limestones are commonly invoked to explain the Sr enrichment needed to form celestine (Kulp, Turekian & Boyd, Reference Kulp, Turekian and Boyd1952; Wood & Shaw, Reference Wood and Shaw1976; Longman & Mench, Reference Longman and Mench1978; Friedman & Shukla, Reference Friedman and Shukla1980; Olaussen, Reference Olaussen1981; Hoareau, Monnin & Odonne, Reference Hoareau, Monnin and Odonne2010). However, as shown in Section 7.a.2., mineralization occurred c. 60 Ma after the deposition of the Ardon Formation, long after syngenetic dolomitization and diagenesis had ceased. Another origin for Sr then has to be considered.
The source of Sr in celestine has also been attributed to dissolution of Ca-sulphates in nearby sedimentary formations (Carlson, Reference Carlson1987; Matsubara, Kato & Hashimoto, Reference Matsubara, Kato and Hashimoto1992) and leaching of Sr from other rocks by groundwater (Wood & Shaw, Reference Wood and Shaw1976; Scholle, Stemmerik & Harpøth, Reference Scholle, Stemmerik and Harpøth1990; Ehya, Shakouri & Rafi, Reference Ehya, Shakouri and Rafi2013). Both the Ardon Formation and the underlying Mohilla Formation host abundant Ca-sulphates, which could undergo dissolution and transport by percolating meteoric water. Additionally, non-geode celestine occurs in both the Ardon Formation (e.g. Fig. 6d) and the underlying Mohilla Formation (Druckman, Reference Druckman1974). Average 87Sr/86Sr ratios of evaporites from the Mohilla Formation are 0.70763 (Bialik, Reference Bialik2012). However, 87Sr/86Sr ratios of geode celestine (0.707424) are similar to those measured in the dolomites of the Ardon Formation (0.707430) and to the 87Sr/86Sr ratio of Sinemurian seawater (Fig. 10). Although the ratios also match that of Early Cretaceous seawater, the timing of magmatism in the Negev and seawater-derived Sr has been used to explain celestine mineralization elsewhere (Yan & Carlson, Reference Yan and Carlson2003; Hoareau, Monnin & Odonne, Reference Hoareau, Monnin and Odonne2010; de Haller et al. Reference De Haller, Tarantola, Mazurek and Spangenberg2011; Tisato et al. Reference Tisato, Sauro, Bernasconi, Bruijn and De Waele2012), the composition of fluid inclusions in the Ardon geodes indicate that they were not precipitated from seawater-derived fluids. Evidently, the Sr originated from within the Ardon Formation. Formation of celestine as a residual phase after Ca-sulphate dissolution is not sufficient. Pre-existing celestine in the nodules (Fig. 6d) is volumetrically insignificant, less than 1%. Assuming that the Ca-sulphates had an unrealistically high 5% equivalent of SrSO4 by volume in their crystal structures, this would still not account for the abundant celestine observed in the geodes, which commonly constitute more than 50% of the geodes by volume (e.g. Fig. 3a, c, e). Geodes with little celestine still contain at least 10% (Fig. 3b, f) and require an external source of Sr.
Sr is not only hosted in evaporites and sulphates but also in the dolostones of the Ardon Formation, which in some cases contain 1600 ppm Sr (see online Supplementary Material available at http://journals.cambridge.org/geo for full analyses). It is unlikely that sulphate and Sr were transported together in the fluids (see Section 7.c. below) so the dolostones and other carbonates in the Ardon Formation are the most probable source for Sr instead of evaporites. Any amount of pre-existing Sr (either as celestine or in Ca-sulphates) in the nodules was overwhelmed by this influx.
The dyke did not contribute any Sr at all, at least not in detectable amounts. Teutsch (Reference Teutsch1993) showed that the concentration of Sr decreased from 600 ppm in the unaltered centre of the dyke to 100 ppm in the altered rim. Had this non-radiogenic Sr (87Sr/86Sr≈0.7033) been incorporated into the celestine its 87Sr/86Sr ratio would deviate from that of the Ardon Formation (87Sr/86Sr≈0.7074), but this is not the case. Furthermore, the alteration of the dyke occurred during Campanian time, c. 55 Ma after the postulated formation of the celestine geodes (see Section 7.d. below).
7.c. What is the source of sulphate?
Previous studies on formation of celestine nodules and geodes have suggested deposition into karst-related cavities (Kesler, Reference Kesler1944; Scholle, Stemmerik & Harpøth, Reference Scholle, Stemmerik and Harpøth1990; Tisato et al. Reference Tisato, Sauro, Bernasconi, Bruijn and De Waele2012), but the most common mechanism is the in situ replacement of pre-existing anhydrite or gypsum nodules (Salter & West, Reference Salter and West1965; Wood & Shaw, Reference Wood and Shaw1976; Fisher, Reference Fisher1977; Carlson, Reference Carlson1987; Scholle, Stemmerik & Harpøth, Reference Scholle, Stemmerik and Harpøth1990). Ca-sulphate nodules are common throughout the Ardon Formation (Nissenbaum, Reference Nissenbaum1967; Buchbinder & le Roux, Reference Buchbinder and le Roux1993), but are not present at the BH locality. It is possible that the celestine geodes formed as a replacement of such nodules and the sulphate in celestine is derived from in situ dissolution of Ca-sulphate. Anhydrite inclusions in celestine are commonly attributed to these replacement processes, further corroborating the replacement hypothesis (Salter & West, Reference Salter and West1965; Wood & Shaw, Reference Wood and Shaw1976; Carlson, Reference Carlson1987; Ehya, Shakouri & Rafi, Reference Ehya, Shakouri and Rafi2013). Euhedral quartz is a common diagenetic mineral in evaporites and Ca-sulphate nodules (Nissenbaum, Reference Nissenbaum1967; Chowns & Elkins, Reference Chowns and Elkins1974; Tucker, Reference Tucker1976; Friedman & Shukla, Reference Friedman and Shukla1980; Elorza & Rodriguez-Lazaro, Reference Elorza and Rodriguez-Lazaro1984; Chafetz & Zhang, Reference Chafetz and Zhang1998). Furthermore, Nissenbaum (Reference Nissenbaum1967) described alabaster gypsum nodules with euhedral, anhydrite-bearing, quartz prisms from elsewhere in the Ardon Formation. These quartz crystals are identical to those observed in the BH geodes. Petrographic observations suggest that celestine post-dated primary quartz (Section 4.c.). It is therefore likely that the celestine geodes were initially quartz-bearing gypsum nodules and the celestine formed by replacing anhydrite (converted from gypsum at high temperature) in these nodules. However, there are several quartz crystals in the celestine geodes hosting high-temperature fluid inclusions, suggesting that some primary quartz growth was possibly concurrent to celestine growth.
Alternatively, it is conceivable that the sulphate is derived from sulphates elsewhere in the Ardon Formation. Celestine is characterized by retrograde solubility, that is, it becomes less soluble with increasing temperatures (Hanor, Reference Hanor2000). If strontium sulphate was indeed dissolved in the fluid, it should have precipitated at the surface of the dyke or in fluid pathways adjacent to the dyke because of the reduced solubility. Instead, it precipitated inside cavities, some as much as 50 m away from the dyke implying that sulphate only became available when the Sr-bearing fluid came into contact with the precursor Ca-sulphate nodules. There is no correlation between T h and T m (Fig. 9c). It is therefore obvious that the fluid salinity does not depend on the temperature of the fluid. The different salinities of the fluid inclusions probably resulted from mixing meteoric water and dissolution products in varying proportions.
One remaining problem is the discrepancy between the δ 34S values of the celestine and the supposedly precursor gypsum: δ 34S is higher in celestine compared to gypsum (+19.9‰ and +16.8‰, respectively). Higher δ 34S values in celestine relative to accompanying Ca-sulphates are commonly reported (Boyce et al. Reference Boyce, Fallick, Hamilton and Elorza1990; Scholle, Stemmerik & Harpøth, Reference Scholle, Stemmerik and Harpøth1990; Yan & Carlson, Reference Yan and Carlson2003; de Haller et al. Reference De Haller, Tarantola, Mazurek and Spangenberg2011; Ehya, Shakouri & Rafi, Reference Ehya, Shakouri and Rafi2013), sometimes by as much as 20‰. This disparity is sometimes explained by enrichment of the heavier isotope due to sulphate reduction (although no solid evidence is provided for such processes) and, in other cases, it remains unaccounted for. In the Ardon geodes the difference is only 3‰, so this issue is less pronounced. There is an absence of experimental studies on sulphur isotope fractionation during celestine precipitation (as particularly stressed by Ehya, Shakouri & Rafi, Reference Ehya, Shakouri and Rafi2013), but a similar study on gypsum precipitation has shown that its δ 34S value is higher by c. 1.6‰ relative to sulphate remaining in solution (Raab & Spiro, Reference Raab and Spiro1991). Likewise, it is possible that the 3‰ measured difference of δ 34S between celestine and the precursor gypsum is due to either Rayleigh-type fractionation or a higher fractionation factor.
7.d. Secondary alteration
Petrographic observations indicate that calcite, secondary quartz and iron oxides crystallized after celestine and primary quartz (Section 4). This requires influx of silica, iron and calcium carbonate into the geodes after precipitation of celestine has ceased. The alteration of the celestine geodes may be coeval with the alteration of the BH dyke itself as suggested by the geochemical material balance performed by Teutsch, Ayalon & Kolodny (Reference Teutsch, Ayalon and Kolodny1996). They reported depletion of both silica and iron in the dyke during alteration, providing a viable source for these elements. Measured δ13C values of calcite in the geodes (−6.7±0.7‰) are similar to those measured in the altered dyke (−6.3±0.5‰; Teutsch, Ayalon & Kolodny, Reference Teutsch, Ayalon and Kolodny1996), also supporting common source and concurrent precipitation of calcite in both the dyke and the geodes. This alteration phase was suggested to occur during early Campanian times (c. 79 Ma; Teutsch, Ayalon & Kolodny, Reference Teutsch, Ayalon and Kolodny1996), long after the crystallization of the dyke and of celestine at c. 135 Ma. Celestine was not in equilibrium with the calcite-precipitating fluids, as evident by dissolution cavities in celestine (Fig. 6b). Divalent iron leached from mafic minerals in the dyke was oxidized in situ to trivalent iron and precipitated as iron oxides that gravitationally settled to the bottom of the geodes, forming red calcite and salmon-coloured celestine (Fig. 3a, b).
Quartz–calcite veins (Fig. 2f) probably formed during this alteration stage also. The occurrence of a Ba–Sr sulphate phase (Table 1) inside one vein is in agreement with the depletion of Sr as well as Ba from the dyke (Teutsch, Reference Teutsch1993).
8. Summary
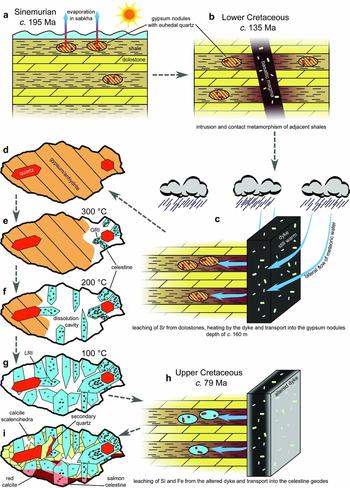
Syngenetic gypsum nodules formed together with the shales of the Ardon Formation in a Sinemurian sabkha, 195 years ago (Fig. 11a). During the first magmatic pulse of the Lower Cretaceous (c. 135 Ma) the Ardon Formation was intruded by basaltic dyke that metamorphosed the adjacent shales, and probably transformed the nearby gypsum into anhydrite (Fig. 11b). Meteoric water flowed through the relatively shallow (c. 160 m) Ardon Formation, leaching Sr from carbonates. When these Sr-enriched waters came into contact with the solid (yet warm) dyke, they partially dissolved the gypsum (now anhydrite) nodules and precipitated celestine on its expense (Fig. 11c). Some anhydrite was trapped as inclusions in newly formed celestine. Fluid inclusion patterns in the celestine record the gradual cooling of the dyke (Fig. 11d–g). By the time the dyke had cooled down completely, there were no traces left of the original Ca-sulphates. A second fluid flow event in the Upper Cretaceous (Fig. 11h) caused alteration of the basaltic dyke into secondary clays and alteration of celestine in the geodes into quartz, calcite and iron oxides (Fig. 11i).
Schematic cartoons summarizing formation of the geodes in Nahal Ardon. See text for details.

Acknowledgements
We wish to thank Efrat Eliani-Russak for her assistance with the carbon isotope analysis and Leila Zeiri for her assistance with the Raman spectroscopy. We are grateful to Dr. Alexandra V. Turchyn of the University of Cambridge for making the sulphur isotope measurements possible. Jonathan Kaminchik and Bar Elisha are acknowledged for inspiring this study.