


Introduction
The most striking characteristic of the active ice streams draining toward the Siple and Gould coasts of West Antarctica is the hundred-fold contrast in speed between the ice streams and the adjacent interstream ridges. The speed contrast develops over a zone about 5 km wide (10% of the ice-stream width) in an intensely crevassed shear margin (Fig. 1). Except perhaps at the onset of smaller precursor tributaries to the ice streams (Reference Anandakrishnan, Blankenship, Alley and StoffaAnandakrishnan and others, 1998; Reference BellBell and others, 1998), there is no clear external control on the position of these margins; they variously occur at bed-topographic lows, highs and slopes (Reference Shabtaie and BentleyShabtaie and Bentley, 1988). The speed contrast at the shear margin must be due to a switch in the dominant process of ice motion: from internal shear controlled by basal drag from a strong bed under the nearly stagnant sides, to fast basal slip with small basal drag under the ice stream.
Part of a Système Probatoire pour l’Observation de la Terre (SPOT) image showing the “Dragon” shear margin (see Fig. 3). The active ice stream is on the lefthand side and moves from top to bottom. The ice-stream surface has many crevasses which present a textural complexity. The un-crevassed region on the right is a ridge of slow-moving ice.

Estimates for Ice Stream BFootnote * show that nearly all of the opposition to the action of gravity comes from the sides and not from the bed or from longitudinal stress gradients (Reference Jackson and KambJackson and Kamb, 1997; Reference Whillans and van der VeenWhillans and Van der Veen, 1997; Reference Harrison, Echelmeyer and LarsenHarrison and others, 1998). Shear stress transmitted through the lateral shear zones controls the motion of the ice streams.
The lateral margins are sites where shear stress changes sense. Within the ice stream the shear stress largely acts on vertical planes parallel to the sides. Within the shear zone the shear stress is transformed to shear stress acting on planes parallel to the bed (Reference Whillans and van der VeenWhillans and Van der Veen, 1997). The process of this transfer is not obvious. Because of stratification according to temperature in polar ice (e.g. Reference Engelhardt, Humphrey, Kamb and FahnestockEngelhardt and others, 1990) within the ice stream, lateral shear force is concentrated in the upper, colder portion of the glacier. This force is transferred through the shear margin and then down to the bed under the interstream ridge (Fig. 2). The width of the strip of bed that ultimately supports the force has not been determined and the value of basal drag achieved within that strip is not known. Moreover, it is unclear what controls the magnitude of the force that can be transmitted. The control could be the thickness and strength of ice in the upper, cold portion of the shear margin, or the value and location of the basal stress under the interstream ridge. Whatever determines the lateral drag force ultimately determines the maximum width, driving stress and speed of the ice stream.
Schema showing stress transmission from the ice stream at the left to the interstream ridge at the right. Lines represent direction of stress transmission: vertical lines denote regions where lateral shear, Rxy, dominates, and horizontal lines where vertical shear, Rxz, dominates. Relief on bed represents the magnitude of basal drag. Vertical exaggeration is about three times.

The present study reports on a measurement program of velocity and strain rate adjacent to the margin of Ice Stream B and its interpretation in terms of how stresses are converted from lateral drag to basal drag. The study site is the southern margin to Ice Stream B2, not far from the UpB camp. This margin is migrating at a speed of 9.7 (1.1) m a−1 (Reference Echelmeyer and HarrisonEchelmeyer and Harrison, 1999), such that the ice stream is becoming wider with time and a site just outboard of the margin is thinning at 0.096 (0.044) ma−1 (Reference Hamilton, Whillans and MorganHamilton and others, 1998). (Error estimates are in parentheses.) These time changes in this margin make it an especially important site for studies on margin mechanics.
Measurements
A small strain grid was deployed on an interstream ridge (the almost stagnant “Unicorn”) and into the shear margin of Ice Stream B2 (Fig. 3). The grid poles are arranged in three lines (labeled F, G and H) about 1 km apart (Fig. 4) that were surveyed in December 1992 and again in December 1993. The F line is very nearly an extension onto the interstream ridge of the line of poles reported on by Reference Echelmeyer, Harrison, Larsen and MitchellEchelmeyer and others (1994).
Map of Ice Stream B (from Reference Whillans and van der VeenWhillans and Van der Veen, 1997). Numbers are station names. Study area is in the “Dragon” shear margin at station 21 (G37 in Fig. 4). Ice velocities are indicated with solid arrows (fast), stippled arrows (slow) and ringed spots (very slow).

Surface elevations obtained from gridding ellipsoidal heights for the snow surface at the stations indicated with dots. Arrows represent velocities along the F line. The ice stream is at the bottom, moving to the right. On the interstream ridge, the surface slopes down toward the ice stream. The coordinate system has x and y tangent at S83.5, W138 to a spherical representation of Earth, and the x axis at azimuth 287.7° (parallel to the velocity of UpB in the ice stream).

Surveying entailed the “stop-and-go” kinematic global positioning system (GPS) method, as used for the expanded strain grid near the UpB camp on Ice Stream B2 (Reference Hulbe and WhillansHulbe and Whillans, 1994, Reference Hulbe and Whillans1997). The accuracy in relative horizontal position is about 0.01 m, resulting in a relative velocity error of 0.014 m a−1. Relative motions are referenced to station G37 (Fig. 4) (called DG37 in Reference Hamilton, Whillans and MorganHamilton and others (1998)) which is a few meters from station 21 (Fig. 3). Station 21 was used by Reference Echelmeyer, Harrison, Larsen and MitchellEchelmeyer and others (1994) as a survey reference, but was lost due to burial by snow. The ice at station 21 is moving at 1.5 m a−1 in the northwest (true) direction (Reference Whillans, Jackson and TsengWhillans and Van der Veen, 1993). Absolute velocities along the strain grid are obtained by adding the relative motions to that of station 21.
Surface elevations (uncertainty relative to G37: 0.02 m) are shown in Figure 4. Elevation contours are approximately parallel to the shear margin. This indicates zero driving stress in the direction of flow of the ice stream (here referred to as the along-flow direction). Velocities of the stations in the strain grid (Fig. 4) are primarily in the along-flow direction, despite this zero along-flow component of driving stress. Evidently, the ice stream is dragging along ridge ice.
A local coordinate system is used such that the x axis is in the direction of ice-stream motion and the y axis is perpendicular to the ice-stream margin, positive into the interstream ridge. The z coordinate is vertically upward. Ux (x, y, z) denotes the x component of velocity (parallel to the shear margin). Velocities at the upper surface have been measured (Fig. 5a).
Measured and derived quantities along the F line (Fig. 4): (a) component of velocity in the x direction; (b) velocity gradient; (c) lateral shear stress at surface using a rate factor of 700 kPa a1/3; (d) stress transmission parameter, β; (e) stress-guide factor, ϕ, constrained to be no larger than 1 at the far right; (f) basal drag for the simple model (dashed line) and the more complete model.

Ice thickness is about 900 m and varies by only 50 m within the study area (Reference Echelmeyer and HarrisonEchelmeyer and Harrison, 1999, fig. 6).
Calculations of Stress
The objective is to use the measurements of surface speed and of lateral shearing to describe the transmission of force from the ice stream, through the shear margin and to the glacier bed just outboard of the shear margin. A full force-budget calculation could be used, involving many depth and transverse elements, as has been done in other applications (e.g.Reference Van der Veen and WhillansVan der Veen and Whillans, 1989; Reference Echelmeyer, Harrison, Larsen and MitchellEchelmeyer and others, 1994; Reference RaymondRaymond, 1996; Reference Jacobson and RaymondJacobson and Raymond, 1998). However, interpretation of a full numerical model might be difficult to manage considering the large and unknown spatial variations in ice stiffness to be expected in this region of strain heating and fabric development. Instead, a simpler, mainly analytical approach that involves parameterizations for the depth and horizontal variations in vertical and horizontal shear stresses is adopted here.
Along the three lines of poles, velocities are very nearly the same. This means that normal stress gradients parallel to the ice stream are nearly zero (as has been found within the ice stream as well; Reference Whillans, Jackson and TsengWhillans and Van der Veen, 1993) and that a two-dimensional (vertical and transverse to ice stream) model is sufficient.
Two sets of motion observations are to be combined to produce a consistent description of margin mechanics. The first derives from relative motion within the strain grid. This motion describes lateral shearing, ∂Ux /∂y and, after invoking the constitutive relation, lateral shear stress, Rxy. This shear stress is large within the shear margin and decreases into the interstream ridge. Measurements of this decay in lateral drag can be used to compute how much of the lateral force is being converted to drag at the bed, as discussed below. The second observation is the absolute motion of the surface with respect to the bed, or vertical shear, as derived from long-distance satellite tracking ties. It describes the net effect of vertical shearing, ∂Ux /∂z and, by inference, the vertical shear stress, Rxz , in the ice column. The stress, Rxz (b), at the bed (elevation: b) should be the same as the drag determined from the decay of lateral drag from the first set of observations. The combination of these two categories of observation and the requirement that they indicate the same basal drag, τ bx , is used to obtain new information on the style of handover of force between ice stream and the outboard bed.
The calculations are presented for the F line as shown in Figure 4. The F line extends farthest into the crevassed chaotic zone of the shear margin. The results for the two shorter lines are comparable.
Lateral shear
Here, considerations of the balance of forces in the along-ice-stream flow, x direction, are undertaken. This allows lateral shear stress, Rxy , calculated from strain rates, to be linked to vertical shear stress, Rxz . Because there is no x component of surface slope there is no contribution from gravity. Also, the potential contribution of a longitudinal (x) gradient in depth-integrated tensile stress is zero because longitudinal stretching, ∂Ux /∂x, is everywhere nearly zero (Reference Whillans, Jackson and TsengWhillans and others, 1993). In this simple case, the balance of forces (Reference Van der Veen and WhillansVan der Veen and Whillans, 1989) reduces to
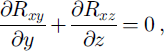
which states that increasing lateral drag, Rxy , in the y direction must be offset by decreasing vertical drag in the z direction.
The interest is in the full thickness of ice, so a vertical integration of Equation (1) is made from the bed, z = b, to the surface, z = h:
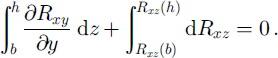
This links gradients in lateral drag to values of vertical drag. Vertical drag at the ice/air contact, Rxz (h), is zero. At the bed it reaches Rxz (b), rewritten as τ bx [≡ Rxz (b)]. Applying these to Equation (2) and switching the order of integration and differentiation for the first term:

Basal and surface slopes, ∂b/∂y (Reference Retzlaff, Lord and BentleyRetzlaff and others, 1993) and ∂h/∂y (Fig. 4), are small, meaning that the two terms in Equation (3) that involve them can be neglected. A representation for the integral in the first term is introduced:
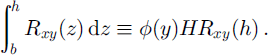
The stress-guide factor, ϕ(y), accounts for the depth variation in lateral shear stress, Rxy ; ice thickness is represented by H(= h − b). A simple way to interpret the stress-guide factor, ϕ(y), is to consider it to represent the fractional depth over which the surface stress, Rxy (h), acts. Should lateral shear stress be constant through the thickness, then ϕ(y) = 1. The value of ϕ may be affected by ice-crystal orientation fabric, but the major influence is expected to be temperature, which leads to values of ϕ < 1 because deep ice is warmer and less strong.
The stress-guide factor, ϕ(y), is expected to vary horizontally (with y) because strain heating is concentrated where ice deformation is fastest. As shown by Reference Harrison, Echelmeyer and LarsenHarrison and others (1998), this deformation has warmed and weakened the ice in the shear margin. On the other hand, open crevasses contain puddled winter air, which makes that ice colder and stronger (Reference Harrison and EchelmeyerHarrison and Echelmeyer, 1994; Reference Harrison, Echelmeyer and LarsenHarrison and others, 1998). Crystal orientation depends on strain history, which is different within the inter-stream ridge than in the ice stream. The effect of these various possibilities is permitted with a y variation in ϕ.
Inserting Equation (4) for the depth integral of lateral shear stress in the balance Equation (3), and neglecting the terms involving surface and basal slopes, gives
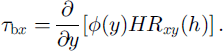
This equation links basal drag to the lateral gradient in side shear force.
The value of lateral shear stress, Rxy (h), is obtained from strain-rate measurements at the surface using the conventional constitutive relation for ice under the present case of dominant lateral shear at the surface (Reference Van der VeenVan der Veen, 1999, p. 38):
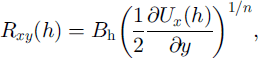
where B h is the rate factor applicable to the upper part of the glacier. The common value, n = 3, is used for the exponent. The shear stress, Rxy (h), describes force transmitted horizontally between the action of gravity on the ice stream and the reaction of drag from the interstream ridge. It is shown in Figure 5c using a near-surface rate factor of B h = 700 kPa a1/3 (for ice at −26°C; Reference HookeHooke, 1981). Temperature measurements across the “Dragon” shear margin indicate a near-surface temperature of about −26°C outboard of the heavily crevassed chaotic zone; within that zone, puddling of cold air in surface crevasses leads to significantly lower temperatures near the surface, but the survey grid does not extend that far into the shear margin.
Next, a second expression for basal drag is derived, based on the consideration of force balance in the vertical direction. Then the quantity τ bx is eliminated from both to provide an empirical estimate for various unknown parameters, including ϕ(y).
Vertical shear
The second category of observation is surface speed. The associated process is vertical shear. Vertical shearing rate is linked to vertical shear stress by (Reference Van der VeenVan der Veen, 1999, p. 38)
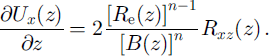
Equation (7) is integrated over the full ice thickness with the intent of linking drag at the glacier bed, Rxz (b) = τ bx , to measured surface speed. That is,
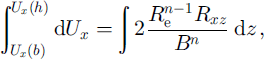
where Ux (b) is basal sliding speed. The effective shear stress, R e, is due to the two shear stresses discussed above:

At any depth where one stress is larger than the other, the effective shear stress is calculated to be very close in magnitude to the one that dominates. In the upper portion lateral drag, Rxy , used in Equation (6), dominates stresses.
At the “Dragon” site, basal slope is nearly zero (Reference Retzlaff, Lord and BentleyRetzlaff and others, 1993), so the vertical shear stress at the bed is equal to basal drag, τ bx . Equation (8) is used to solve for surface velocity, Ux (h), after an expression for the depth variation of the integrand on the righthand side is developed.
In the upper portion lateral drag, Rxy , dominates, but ice temperature is cold (−26°C; Reference Harrison, Echelmeyer and LarsenHarrison and others, 1998), so the rate factor, B, is large. Vertical shear stress, Rxz , is zero at the ice/air contact, and there seems to be no process for a great increase at shallow depths. Applying this in Equation (7) shows that there is little vertical shearing in the upper portion.
In the lower portion, Rxz (z) must be large so that R e ≅ Rxz , and temperature warmer so that B is smaller. This leads to vertical shearing being large at depth. Based on these considerations, the following heuristic relation is adopted here:

where H is the ice thickness, and (h − z) is depth measured from the snow surface. According to the considerations just noted, the exponent, m, is ordinarily expected to be larger than 1. The rate factor, B b, corresponds to the value appropriate for softer basal ice where most of the vertical shear is concentrated.
This relation (9) (for the combined depth variation in vertical shearing and rate factor) is used in Equation (8) to link basal shear stress to surface velocity.

Evaluating the integrals gives

Rearranging to solve for basal drag yields

This equation shows a sensitive dependence of basal drag on the rate factor at depth, B b, as ordinarily expected, but only a moderate dependence on the exponent m, which describes the form of the function describing the depth variation in vertical shear stress and rate factor.
It is convenient to define Ξ, the fraction of surface speed that is due to basal sliding. That is,
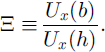
Equation (12) then becomes

which links the absolute speed of the surface to basal drag through considerations of vertical shear.
Combination
The expressions describing the processes of lateral shear (Equation (5)) and vertical shear (Equation (14)) are combined to eliminate basal drag. Equation (6) is invoked as well to produce

which is solved using measurements of Ux (h) and H to determine the spatial gradient in ϕ(y)B h with respect to B b(1 − Ξ)1/n .
To make the results easier to interpret, a further assumption is made: lateral gradients in the rate factor at depth, ∂B b/∂y, are neglected. The convenience of this assumption is that B b may be moved from the lefthand side of Equation (15) inside the differential on the righthand side. This assumption would be invalid if there were strong horizontal gradients in temperature just above the bed in the interstream ridge. However, this ice must be moving entirely by internal deformation, being nearly fixed to the bed, so there is little range for a horizontal temperature gradient. In fact, the ice near the bed is probably everywhere near the melt temperature, and the rate factor near the bed, B b, is not expected to vary importantly along the strain grid. Furthermore, the exponents m and n appearing on the lefthand side of Equation (15) are also moved inside the differential on the righthand side. This is appropriate for the flow-law exponent, n. It is reasonable for the exponent m in first order, because the shape of the depth variation in vertical shear stress and rate factor (Equation (7)) have been taken as constant in the transverse direction, at least in the region of large stresses studied here.
Reference Jacobson and RaymondJacobson and Raymond (1998) find concentrated heat dissipation near the bed just outboard of the slip/non-slip boundary at the bed. This model result does not conflict with the present assumption. The heat source is associated with a hypothetical discontinuity in basal slip rate that is inboard of the present transect of study.
Making these simplifications leads to

or, equivalently on integration, considering that ∂Ux /∂y → 0 as y → ∞:

In these equations the quantity β(y) is a collection of the factors that relate to depth-varying strength of the ice:
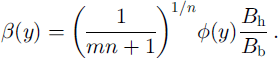
The most unclear factors in this group are B b (which affects the rate of vertical shear) and ϕ (the stress-guide factor for horizontal stress transmission). It is convenient to keep these uncertain quantities “rolled up” into one parameter, β(y), and solve for this parameter.
Equation (16) or (17) is solved for β(y) using data on Ux (h), and ice thickness H (taken as constant). In solving Equation (16) the boundary condition is ∂β/∂y = 0, for large y. For Equation (17) it is Ux (h) = 0, at the ridge end of the strain grid. Both equations, with their respective boundary conditions, lead to qualitatively similar results.
Results
Consider first a very simple example, an isothermal glacier, so B h = B b. Assume no preferred crystal orientation so that there is no stress-guide effect, and the whole ice thickness is involved in horizontal stress transmission, so ϕ = 1. Take m = 1 (by analogy to laminar or lamellar flow), and n = 3, as is usual. In this case Equation (18) leads to β = 0.63.
For more realistic situations the stress transmission parameter β(y) describes how much more important the upper part of the glacier is compared to deeper strata for stress transmission. There are competing contributions to the parameter β. The dominant effect arises because deeper strata are warmer, and the deep rate factor, B b, is smaller than the surface value. This tends to increase the value of β. However, shallower strata may be stronger on account of a preferred crystal-orientation fabric, and the effective thickness over which the shear stress acts may be less than the full ice thickness (stress-guide factor, ϕ, less than unity), which tends to decrease the value of β. The measurements, together with Equations (16) and (17), lead to values of β in the range 1–3 (Fig. 5d), assuming no sliding (Ξ = 0) under the interstream ridge. This means that the temperature effect (or some other effect with the same properties) dominates. Deep ice is softer than shallow ice.
The calculations show a strong horizontal gradient in the stress transmission parameter, β, being small near the ice stream and increasing sharply at about y = 3 km. There can be no unique interpretation for this because the parameter β is composed of five primary parameters, and the proportion of sliding, Ξ, is yet another parameter. One interpretation stands out as being most reasonable and simple. This is that the thickness of the stress guide, ϕ, changes from a small fraction in the ice stream to a larger fraction in the interstream ridge. A net contrast in ϕ of 2.7 times over the study area, or 1.5 times over the critical zone 2.5 <y <3.0 km, is called for to explain the change in β shown in Figure 5.
One possibility is that the stress transmission parameter, β, is small in the shear margin because of strain heating. Strain heating is given by the product of shearing, ∂Ux /∂y, and shear stress, Rxy , both shown in Figure 5. The heat so generated is large at y < 2.8 km. This is much farther left than the decrease in the value of β. The calculated pattern in β cannot be accounted for with strain heating.
Figure 5e shows the upper limit to values of the stress-guide factor, ϕ. At the far right it has been set to the maximum possible value, 1. Assuming that the ratio of rate factors, B h/B b, is constant along the grid leads to a stress-guide factor of 0.4 at the far left. That is, 40% of the thickness is involved in transmission of lateral drag. A smaller value for ϕ at the far right in the interstream ridge, or colder basal temperatures (larger B b), would lead to smaller calculated stress-guide factors in the shear zone. The fractional thickness of stress-bearing ice is 40% or less in the shear zone.
Basal drag is calculated for the outboard zone under the interstream ridge using Equation (12), assuming no basal sliding (Ξ = 0, for all y), and the interpretation that the calculated variation in β is due to variation in the thickness of the stress guide, ϕ, and not B b. The results are presented in Figure 5f. Basal drag decays progressively along the studied zone, with much of the decay occurring before y = 3.0 km. The deep rate factor, B b, is calculated from Equation (18) to be 118 kPa a1/3, a value appropriate for ice near the melt temperature. Larger values could be determined only if unphysical values of ϕ > 1 at the ridge end of the grid are used. The implication is that the interstream ridge is wet-based or close to being wet-based.
This pattern in basal drag may be contrasted with that computed from a very simple model based on the gradient in lateral shearing. (This “simple model” has ϕ constant at 1.0 and rate factor constant with depth at the depth- and temperature-weighted value of 540 kPa a1/3 (Reference Whillans and van der VeenWhillans and Van der Veen, 1997) and basal drag computed using Equations (5) and (6)) That result shows a spike at 2.8 km (Fig. 5f, dotted line). The present, more sophisticated model produces a wider zone of large basal drag and not such an extreme value.
The lateral shear force acting on the ice stream is computed as well. The maximum lateral drag in the shear margin is about Rxy = 225 kPa (Fig. 5c) at the extreme inboard edge of the strain grid, but the value is increasing and probably increases beyond the limit to the strain grid. Using the estimate of 40% for ϕ at the limit to the strain grid leads to a thickness-mean shear stress of 90 kPa and a lateral force ϕRxyH of about 100 kPa km. This is a much smaller force than that determined from deformation measurements within the ice stream. Reference Echelmeyer, Harrison, Larsen and MitchellEchelmeyer and others (1994) obtained 200 kPa (using a depth-representative temperature in the calculations), and Reference Whillans and van der VeenWhillans and Van der Veen (1997) 220 kPa (for the thickness mean), both using measurements from somewhat farther into the shear margin. Reference Jackson and KambJackson and Kamb (1997) obtained 220 kPa for the thickness mean based on laboratory tests of core samples. Reference Harrison, Echelmeyer and LarsenHarrison and others (1998) obtained 200 kPa for the upper layer by back-calculation from the heat dissipated in the shear margin. Evidently the F line of poles does not extend far enough into the ice stream to capture the maximum lateral drag. In fact, the maximum shearing rate observed along the F line is 0.064 a−1, whereas the fastest shearing rate in the middle of the shear zone is about 0.12 a−1 (Reference Whillans, Jackson and TsengWhillans and others, 1993; Reference Echelmeyer, Harrison, Larsen and MitchellEchelmeyer and others, 1994; Reference Whillans and van der VeenWhillans and Van der Veen, 1997). For a shear margin to Ice Stream D, Reference Scambos, Echelmeyer, Fahnestock and BindschadlerScambos and others (1994) obtained a surface value of lateral stress of 150 kPa from tracking of features in satellite images of the southern margin, but it is not clear what rate factor is used in that calculation. At DnB, at the mouth of Ice Stream B, Reference Bindschadler, Stephenson, MacAyeal and ShabtaieBindschadler and others (1987) obtained a value of 160 kPa for the depth-mean shear stress using a rate factor for the mean ice temperature. If surface temperatures are used, the measured lateral shear rate of 0.11 a−1 leads to a lateral stress of about 200 kPa. The different sites provide rather similar results.
Heat Dissipation
The work expended by the two types of shearing generates heat according to the product of stress and shearing rate. It is instructive to consider where most heat is being produced, although the calculations cannot be made with great precision. Reference Harrison, Echelmeyer and LarsenHarrison and others (1998) conducted a very good complementary study.
The heat generated by lateral drag is given by
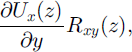
but nearly all dissipation occurs where both of the factors in this product are large, that is, in the upper, stress-guide portion of the shear margin. In that zone, one may use surface values for the quantities:
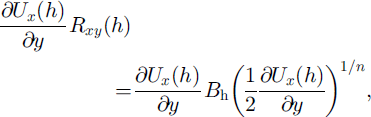
in which the constitutive relation (Equation (6)) has been applied. This calculation of heating is very sensitive to the value of shearing rate, ∂Ux /∂y, which is large in the shear margin and decays with distance into the interstream ridge (Fig. 5b). The largest values are at the end of the grid, at y = 2.5 km (∂Ux /∂y = 0.064 a−1). Using a rate factor, B h = 700 kPa a1/3, this leads to a heat production by lateral shear of 0.47 mW m−3 (being dissipated in the upper 40% of the thickness), a slightly larger value than that calculated by Reference Raymond, Echelmeyer, Whillans, Doake, Alley and BindschadlerRaymond and others (2001, fig. 5). Beyond the end of the grid, shearing rate reaches values 1.9 times larger (Reference Whillans, Jackson and TsengWhillans and others, 1993), and the rate of heat dissipation should be 1.91+(1/n) = 2.4 times larger, or 1.1 mW m−3, or somewhat smaller if the warming of the shear margin and consequent reduction in rate factor are introduced.
This estimate of lateral heat production may be summed through the shear margin to calculate the power released for a unit length of ice stream. The double integration covers the stress-bearing portion of the ice stream (the upper 40%) and the y dimension and yields 220 W m−1.
This power release into shear margins maybe compared with that at the bed beneath the ice stream. That power release is given by

Basal drag, τ bx , under the ice stream is 2 kPa or less (Reference KambKamb, 1991; Reference Whillans and van der VeenWhillans and Van der Veen, 1997), the mean ice speed is about 300 m a−1 and the half-width about 17 km (Reference Whillans and van der VeenWhillans and Van der Veen, 1997). This leads to a power expenditure of about 330 W m−1, or less. This result is uncertain by several factors as well, in this case largely because a precise value of basal drag is not known. However, it seems that the power expended at the sides is similar to that expended at the bed.
Heat production by vertical shear is much smaller. It is estimated using
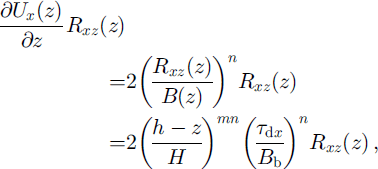
in which Equations (7) and (9) have been used (supposing that R e(z) ≈ Rxz (z)). This quantity becomes larger with depth, reaching a maximum of
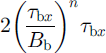
which is the maximum heat dissipation by vertical shear stress. At the lefthand end of the strain grid, τ bx = 50 kPa, B b = 120 kPa a1/3, leading to a maximum dissipation rate of 0.23 mW m−3. This maximum value is much smaller than the heat dissipation by lateral shearing. Relatively little heat is expended at the bed outboard of the ice stream.
In principle, it is possible to make more calculations of heat dissipation and seek to balance the work done against potential energy lost. In essence, this would be a repeat of force-budget analyses. The uncertainties with this approach are so large that the exercise is not very instructive.
These calculations of heat dissipation highlight the sites where heat is being added to the glacier. Frictional heat is released in a concentrated form high in the shear margin, as suggested by Reference Harrison and EchelmeyerHarrison and Echelmeyer (1994), and confirmed by measured temperature profiles (Reference Harrison, Echelmeyer and LarsenHarrison and others, 1998), and not so much at the bed of the ice stream. There is rather little heat available for basal water production (per unit area) or for heating the base of the interstream ridge. In fact, these heating rates, together with typical values of geothermal heat, are unable to balance upward heat conduction (Reference Engelhardt, Humphrey, Kamb and FahnestockEngelhardt and others, 1990) and keep the bed from freezing to the substrate. This consideration challenges the common view of ice-stream mechanics that frictional heat is able to keep the bed wet and even generate lubricating water (Reference RoseRose, 1979).
Conclusions
This is the first field-based description of stress transmission from the outboard bed of an ice stream into a shear margin. The work is related to the modeling studies of Reference Echelmeyer, Harrison, Larsen and MitchellEchelmeyer and others (1994), Reference Scambos, Echelmeyer, Fahnestock and BindschadlerScambos and others (1994), Reference RaymondRaymond (1996), Reference Van der Veen and WhillansVan der Veen and Whillans (1996) and Reference Raymond, Echelmeyer, Whillans, Doake, Alley and BindschadlerRaymond and others (2001) and measurements by Reference Whillans, Jackson and TsengWhillans and others (1993), Reference Echelmeyer, Harrison, Larsen and MitchellEchelmeyer and others (1994), Reference Jackson and KambJackson and Kamb (1997), Reference Whillans and van der VeenWhillans and Van der Veen (1997) and Reference Echelmeyer and HarrisonEchelmeyer and Harrison (1999). It extends the previous suite of measurements from the intensely crevassed chaotic zone of the shear margin onto the nearly stagnant interstream ridge. The study locates the outboard extent of the bed that opposes the action of ice-stream motion, and it describes the transfer of lateral drag from the interstream ridge through the shear margin to the ice stream.
The mechanical bridge begins with basal drag under the interstream ridge, just outboard of the ice stream. Basal drag reaches 60 kPa at the extreme inboard edge of the studied region and decreases away from the ice stream over a 3 km wide zone to near-zero values. This is the basal drag that ultimately controls the motion of the ice stream.
There is a change across the margin in the proportion of ice thickness that carries lateral shear stress. At the inner edge of the strain net (within the shear margin), <40% of the thickness carries lateral stress. Counter to this decrease in thickness of stress-carrying ice from the interstream ridge towards the ice stream, there is an increase in stress within the stress-bearing part of the ice and an increase in total lateral force.
This small thickness of stress-bearing ice in the shear margin accords with temperature–depth measurements in Ice Stream B by Reference Harrison, Echelmeyer and LarsenHarrison and others (1998) and by H. Engelhardt (quoted in Reference Jackson and KambJackson and Kamb, 1997). The temperature profile shows that below about half-depth the ice is much warmer, and therefore weaker. A secondary reason for the upper ice being stronger is that above about 200 m puddled cold air in crevasses could lead to much colder (and stronger) ice just beneath the crevasses (Reference Harrison and EchelmeyerHarrison and Echelmeyer, 1994; Reference Harrison, Echelmeyer and LarsenHarrison and others, 1998). However, this effect is small compared to the effect of the general temperature increase with depth.
Figure 2 shows schematically the handover of force from the ice stream to bed under the interstream ridge. The upper 40% of the ice stream carries lateral drag. This drag force is converted to basal drag over a span of about 1 km. The upper cold portion of the ice stream transmits stress into the interstream ridge, where it decreases in value with distance into the interstream ridge because of drag originating at the glacier bed.
The mainly analytic study presented here required some simplifications. It would seem worth repeating this with a numerical model, especially a model that can allow for time change in margin position.
Acknowledgements
We thank T. Payne and an anonymous referee for many helpful remarks, and appreciate the patience and constructive criticism of the scientific editor, R. Greve. Supported by U.S. National Science Foundation–Office of Polar Programs grant No. OPP-9615127. Byrd Polar Research Center contribution No. C-1222.



