Introduction: social divisions and solidaristic attitudes
There has often been concern that social cohesion is in decline in modern societies. Pahl noted some time ago that sociologists ‘regularly affirm that there has been some fall from grace and that the morality of their times is confused and impoverished’ (Reference Pahl1991: 345). Governments also, from time to time, become concerned about ‘social glue’, interpreted as a lack of common identity, interaction and harmonious relations between groups (especially defined by ethnicity), such as after the urban disturbances in Britain in 2001 (LGA et al., 2002). However, as Robinson (Reference Robinson2005) identified, the official version of ‘community cohesion’ downplays issues of solidarity, replacing reference to ‘social solidarity and reductions in wealth disparities’ (Forrest and Kearns, Reference Forrest and Kearns2001) with an aspiration for equality of life opportunities. More recently, the solidaristic component of cohesion has become more prominent as a social and political issue in times of austerity and ‘new migration’. In a critical review of the policy paradigm of community cohesion, Ratcliffe (Reference Ratcliffe, Ratcliffe and Newman2011a) argues that cohesion must be de-ethnicised and recognises ‘the presence of intra- as well as inter-“community” divisions’. He contends that ‘any attempts to achieve good relations between people from different backgrounds in the absence of a serious push on equality are destined to fail’ (p. 31).
Given this interpretation of social cohesion as having a solidaristic foundation, several developments in the UK might serve as barriers to its achievement. It is reported that support for the government's role in welfare and for increasing spending on benefits has ‘declined markedly in the past decade’, and there is a growing view that ‘generous’ benefits are a deterrent to employment seeking (Clery, Reference Clery, Park, Clery, Curtice, Phillips and Utting2012). These attitudes are supported by recent political discourse about ‘strivers versus skivers’ in the debate about welfare reform in the UK. At the same time, recent research has reported that the social stigma attached to benefit claiming in the UK (the view that other people deem benefit claimants to be shameful and of low status) is ‘quite common’, again supported by media coverage which focuses on lack of reciprocity and effort on the part of claimants (Baumberg et al., Reference Baumberg, Bell, Gaffney, Deacon, Hood and Sage2012). There is also a convergence between negative attitudes to immigration and welfare, in ways which undermine social cohesion. A large majority are now in favour of reducing immigration to the UK (Blinder, Reference Blinder2012), with support focusing on the skill levels and financial self-sufficiency of migrants. These attitudes are again reflected in, and possibly supported by, a government discourse about the risk of attracting ‘benefit tourists’ (Parkinson, Reference Parkinson2011), termed the ‘misplaced perception of the “burden” of new migrants’ (Pillai et al., Reference Pillai, Kyambi, Nowacka and Sriskandaajah2007).
The backcloth to any discussion of social cohesion in the UK is one of inequalities in income latterly converted into increasing inequalities in wealth (Dorling, Reference Dorling2010). Projections for the current decade also indicate a growing income divide (Brewer et al., Reference Brewer, Gambin, Joyce and Wilson2012). These long-term patterns of inequality are said to have become manifested in patterns of increasing socio-spatial polarisation (Dorling and Rees, Reference Dorling and Rees2003). Whilst early evidence from the 2011 Census indicates that residential segregation is declining for most ethnic minority groups in most urban areas (Catney, Reference Catney2013) and that ethnic minority groups are ‘spreading out’ to live in more mixed areas (Simpson, Reference Simpson2012), there is also some evidence that White British people are becoming slightly more segregated in many districts (Catney, Reference Catney2013; Johnston et al., Reference Johnston, Poulsen and Forrest2013).
Our interest is in the potential consequences of these trends for social cohesion, through the possible relationship between where you live and the attitudes you hold. Could hardened attitudes to welfare be related to patterns of polarisation and segregation? Do differences between individuals and areas in ethnic terms matter as much as income differences in this regard? The possibility that inequality and separation might impact upon solidaristic attitudes, the underpinning of social cohesion, was raised by Wilkinson and Pickett (Reference Wilkinson and Pickett2009) in their analysis of inequality. Their argument was that ‘when we have less to do with other kinds of people, it's harder for us to trust them’ (p. 51) and ‘we are less likely to empathise with those not seen as equals; material differences serve to divide us socially’ (p. 57). As we have seen, attitudes to income inequality and redistribution depend upon such things as empathy with the poor and trust in benefit recipients. Thus, we might ask whether social cohesion is undermined by the trend to live amongst those most like ourselves in terms of economic status, within an increasingly unequal society? On the other hand, will the trend towards more neighbourhood ethnic mixing generate greater social cohesion? Before addressing these questions, we shall consider further the issue of how where someone lives, the types of people and circumstances around them, could in theory affect their attitudes to such things as inequality and income redistribution.
Individual attitudes in a residential context
A recent review of the literature concluded that public attitudes to economic inequality are susceptible to change over time, but without clear explanations as to why, and that attitudes to redistribution are complex and contradictory (Orton and Rowlingson, Reference Orton and Rowlingson2007).
A major influence on welfare attitudes is material position, or self-interest, with those on higher incomes less likely to be concerned about inequality or to support redistribution as they have most to lose from any state intervention on the issue (Piketty, Reference Piketty1995; Linos and West, Reference Linos and West2003). Conversely, those with more to gain are more likely to support redistributive policies, such as welfare benefit recipients, those living in social housing and welfare service workers (Hasenfeld and Rafferty, Reference Hasenfeld and Rafferty1989; Papadakis and Bean, Reference Papadakis and Bean1993).
Personal values, or moral principles, are a second major factor for both attitudes and behaviours (Rokeach, Reference Rokeach1968). Values are formed through the early years of socialisation and are seen as relatively durable and resistant to change through experience (Stern et al., Reference Stern, Kalof, Dietz and Guagnano1995). The critical value in relation to inequality and redistribution is altruism, namely where one places concern for others against concern for oneself (Sefton, Reference Sefton and Park2005; Park et al., Reference Park, Phillips and Robinson2007).
Attitudes may also be shaped by knowledge accumulated in daily life. Pahl et al. (Reference Pahl, Rose and Spencer2007) reported that social comparisons tend to be narrow and that people are ‘quiescent’ about inequality because their knowledge of its extent is limited. It has also been shown that richer groups tend to understate their relative affluence, whilst poorer groups understate their relative poverty (Sefton, Reference Sefton and Park2005). Indeed, when people are presented with new knowledge about the true scale of inequality, support for redistribution rises (Bamfield and Horton, Reference Bamfield and Horton2009). Living experiences which help to overcome constrained knowledge about inequality may, therefore, alter attitudes.
This is where neighbourhood of residence may matter, as previously shown by the authors, though in work which could not take ethnicity into account (Bailey et al., Reference Bailey, Gannon, Kearns, Livingston and Leyland2013). Neighbourhoods shape opportunities for interaction and relationship or network building, as well as for impersonal experience, observation and emulation, with consequent effects upon political party support (Johnston et al., Reference Johnston, Jones, Sarker, Propper, Burgess and Bolster2004). However, neighbourhoods are situated in different kinds of places, and this may also have effects. Urban areas are places of higher density and greater social differences (Fincher and Jacobs, Reference Fincher and Jacobs1998), and this may affect the level and nature of social interactions as well as influence the way people think about others and society (Bridge, Reference Bridge2005). Indeed, it has previously been shown that there is a lower probability of left-of-centre voting in the UK the more rural an area is (Johnston et al., Reference Johnston, Propper, Burgess, Sarker, Bolster and Jones2005).
In our earlier work, we have distinguished between two broad means by which neighbourhoods may influence people's views about inequality and redistribution, namely attitude transmission and knowledge accumulation (Bailey et al., Reference Bailey, Gannon, Kearns, Livingston and Leyland2013). Research into neighbourhood effects upon behaviours has emphasised the social-interactive mechanisms at work (Galster, Reference Galster and van Ham2012). People may consider and then adopt the behaviours and attitudes of others through discourse – ‘those who live together, talk together’ (Johnston et al., Reference Johnston, Jones, Sarker, Propper, Burgess and Bolster2004: 39) – or go through a less conscious emulation of ‘role models’ and conformity to local norms – ‘people who live together act like each other’ (ibid.: 369). We consider it equally plausible that neighbourhood context could influence welfare attitudes. People living in deprived neighbourhoods may be surrounded by, and come into contact more with, people who support redistribution (since income is a major influence). If attitude transmission is at work, there would be a positive effect upon the attitudes of all residents, with increased concern about inequality and increased support for redistribution in such circumstances.
A second set of neighbourhood effects mechanisms is the accumulation of knowledge through social networks, impersonal encounters and observations. In this case, residence in a deprived neighbourhood may increase someone's knowledge or awareness of the scale of a low income group and the conditions in which they live. We would expect the effect of this upon attitudes to be greater for higher income groups, who may have less prior knowledge of lower income groups. Where lower income groups live in more affluent areas, we would expect the effect of knowledge accumulation to be a rise in support for redistribution as they become aware of the extent of inequality. Thus, rather than a uniform effect of neighbourhood deprivation upon everyone's attitudes, as in attitude transmission, where knowledge accumulation is operational, we would expect an interaction effect between neighbourhood deprivation and income.
With regards to ethnicity, there has been recent interest in the effects of residential ethnic diversity upon two aspects of cohesion, namely social contact and trust. This is important as trust may in turn influence attitudes to other groups as members of the community and as potential recipients of social assistance. There is the potential through increased social contact for neighbourhood ethnic diversity to reduce prejudice towards ethnic minorities and immigrants, in accord with the ‘contact hypothesis’ (Allport, Reference Allport1954; Pettigrew and Tropp, Reference Pettigrew and Tropp2006), and by implication to raise levels of trust in others. However, Putnam (Reference Putnam2007) reported that ethnic diversity was associated with both less social contact (‘social withdrawal’) and lower levels of trust both within and between co-resident ethnic groups. European research has also reported a negative impact of ethnic diversity upon social contacts (Vervoort et al., Reference Vervoort, Flap and Dagevos2010; Gijsberts et al., Reference Gijsberts, van der Meer and Dagevos2011). Furthermore, lower levels of trust have been shown for the ‘native’ (sic) group in neighbourhoods with more ethnic minorities present, whilst levels of trust for ethnic minorities depended upon which other ethnic group was also present in the area (Bakker and Dekker, Reference Bakker and Dekker2012).
Research in the UK adds further refinement and complexity to the picture. Uslaner (Reference Uslaner2010) argued that it is residential segregation rather than neighbourhood diversity that causes lower levels of trust, whilst Sturgis et al. (Reference Sturgis, Brunton-Smith, Read and Allum2010) showed a negative effect of diversity upon trust in neighbours, but no effect upon generalised trust. Rather importantly for our purposes, other UK research has suggested that once area deprivation is taken into account, neighbourhood diversity has little or no additional effect upon social interaction (Letki, Reference Letki2008; Laurence, Reference Laurence2011). However, the effects of neighbourhood diversity and its interaction with individual ethnicity, has yet to be studied in relation to another key dimension of social cohesion beyond social contact and trust, namely welfare attitudes.
Research aims
Our aim is to consider whether attitudes to income inequality and redistribution, as influenced by individual circumstances, are also affected by the residential context in which people live, thus:
• Do neighbourhood context characteristics such as higher deprivation and density, which may increase exposure and contact with others in urban situations, lead to greater concern about inequality and higher support for redistribution, after taking into account the influence of individual characteristics, including income, altruism and ethnicity? Furthermore, do the effects of neighbourhood context vary according to these individual characteristics?
• Are levels of concern about inequality and support for redistribution lower in more ethnically diverse neighbourhoods (reflecting other evidence on lower levels of contact and trust in such circumstances)? How are any effects of neighbourhood diversity influenced by individual characteristics and by other context variables such as deprivation?
Methods
We analysed responses to a national attitudes survey by attaching neighbourhood context variables to the original survey data-set.
Main data source
The data are sourced from the British Social Attitudes Survey (BSAS) 2009, based on a random sample survey of adults (18 or over) in private households with a 55 per cent response rate (Park et al., Reference Park, Curtice, Clery and Bryson2010). The BSAS uses a multi-stage sample design with a stratified random sample of postcode units as the primary sampling units (CML, 2011). We take account of clustering of the sample through multi-level modelling.
Some of the questions we are interested in were asked of a random sub-set (two-thirds) of the sample, and we restrict our analysis to the responses for England. Our sample size for the individual attitudinal questions ranges from 1,589 to 2,466, and for the multivariate modelling we have a sample of 1,230, after cases with missing values on any variables are omitted.
Dependent variables
We explored questions asked of respondents in a self-completion annex to the main survey. Four questions cohered around the topic of inequality and redistribution, with a Cronbach's Alpha score of 0.76. The questions, all of which used the same five-part Likert response scales from ‘strongly agree’ to ‘strongly disagree’, were as follows:
Differences in income in Britain are too large.
It is the responsibility of the government to reduce the differences in income between people with high incomes and those on low incomes.
Government should redistribute income from the better-off to those who are less well off.
Ordinary working people do not get their fair share of the nation's wealth.
We looked at the four questions separately, and also combined them into a Support for Redistribution Index running for 0 to 100 (mean 62; standard deviation 19), with higher scores indicating more concern about inequality and more support for redistribution.
Individual independent variables
Three individual characteristics were of particular interest: income, altruism and ethnicity. Household income data were collected using a single question with seventeen response categories. We equivalised the income data using the modified OECD scales and mid-points. Income is used as a continuous variable in the modelling, but reduced to five bands for descriptive statistics.
We have categorised respondents as more or less altruistic on the basis of the following question:
Some people think it is important to put yourself first whilst other people think it is more important to think of others. Which of the statements on this card comes closest to your view?
Put yourself first and leave others to do the same.
Put yourself first but also consider other people's needs and interests.
Consider everyone's needs and interests equally, including your own.
Put other people's needs and interests above your own.
Those who selected the third or fourth statements were considered to have higher altruism and the others lower, dividing the sample as follows: 64 per cent v 36 per cent.
Ethnic origin was recorded using twelve response categories, which we have grouped into White (including European and Other Whites) and ethnic minority/Non-White, dividing the sample 90 per cent v 10 per cent. Further differentiation would not have been possible given sample sizes.
We also control for other individual characteristics in regression modelling: gender, age, household type, region, main income source, occupation and current or past employment in the public sector. These are all factors by which attitudes to inequality and redistribution have been noted to vary in past research. The extensive controls we have applied also help us respond to the problem of potential selection bias in the study of neighbourhood contextual effects (Galster et al., Reference Galster, Andersson, Musterd and Kauppinen2008).
Neighbourhood independent variables
We measured three characteristics of neighbourhoods – deprivation, density and ethnic composition – at the scale of Lower Super Output Areas (LSOAs). LSOAs have an average population of 1,500, are designed to be relatively homogenous and of consistent size and offer a finer-grained analysis than wards or postcode sectors (average 5,000). There are 32,482 LSOAs in England. In Scotland, the official geographical units are much smaller, and Scotland could be considered to have a different political and social context post-devolution. We thus, restrict our analysis to England.
Exploratory factor analysis (Costello and Osbourne, Reference Costello and Osborne2005) was used to derive measures of neighbourhood context using variables from the Census 2001 and General Land Use Database 2005. Two factors appeared to be associated with attitudes and were therefore pursued. The first factor measured aspects of deprivation, with loadings on unemployment, inactivity, lack of qualifications, social renting, long-term illness, crime and lone parenthood. The second factor measured urbanity/rurality, loading on measures of population density and greenspace. Neighbourhoods were divided into quintiles for bivariate analysis, whilst the factor scores were used as continuous variables in the modelling. These two factors had a modest correlation (0.4), given the concentration of lower income groups in larger urban areas in England.
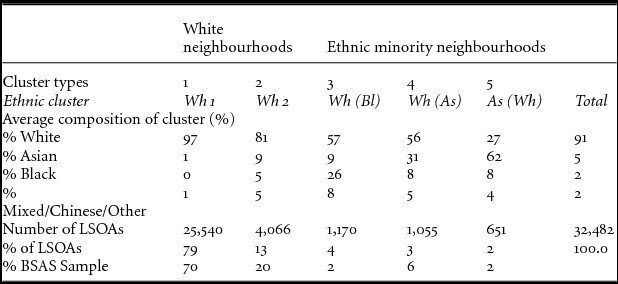
For ethnicity, cluster analysis was used to identify neighbourhood types, based on four broad ethnic groupings: White, Asian, Black and Mixed/Chinese/Other. Five neighbourhood types were identified (see Appendix 1). These were grouped into White-dominated neighbourhoods, clusters 1 and 2 (with Whites typically 80–95 per cent of the local population) and ethnic minority neighbourhoods, clusters 3, 4 & 5 (with ethnic minority groups typically 45–65 per cent of the local population). These ethnic minority neighbourhoods make up 9 per cent of all LSOAs in England, and 10 per cent of the BSAS 2009 sample come from these neighbourhoods.
Analyses
We first examine responses to the four questions on inequality and income redistribution according to the key individual characteristics of interest (income level, altruism and ethnicity), and the three aspects of neighbourhood context (deprivation, density and ethnicity).
We then look at how individual and contextual variables simultaneously affect attitudes, with the Support for Redistribution Index as the dependent variable and using multi-level modelling in MLWIN with restricted iterative generalised least squares estimation (Rasbash et al., Reference Rasbash, Charlton, Browne, Healy and Cameron2010): postcode sectors (PSUs) are the highest level 3, with neighbourhood characteristics included at level 2, and the individuals as level 1. We construct four regression models in stages. In the first, we look at the associations between individual characteristics and attitudes to inequality and redistribution, including ethnicity, income, altruism and other measures of material position and self-interest. The second model includes the effects of neighbourhood deprivation and density, allowing for interactions with individual income and altruism. In the third model, we add the neighbourhood ethnicity variable as well as an interaction term with deprivation. The final model includes further interaction terms between neighbourhood ethnicity, deprivation and individual altruism.
Limitations
We are using an existing data-set and therefore have no influence over the questions asked. Whilst the questions we have selected reflect the concepts and issues we wish to explore, there will always be debate about these. Sefton (Reference Sefton and Park2005) has noted that support for redistribution varies according to how the questions are phrased. The data are also cross-sectional and so we cannot properly account for selection effects – i.e., the fact that people with particular sets of views, or characters amenable to change in particular ways, may move into particular kinds of neighbourhoods (Hedman and van Ham, Reference Hedman, van Ham, van, Manley, Bailey, Simpson and Maclennan2012) – despite our use of extensive individual controls. Further, although we are interested in how people may be shaped by where they live, we cannot assess this comprehensively without good measures of people's residential mobility (Hedman, Reference Hedman2011) and their neighbourhood histories (van Ham et al., Reference Van Ham, Hedman, Manley and Coulter2012), neither of which are available in any national attitudinal surveys as far as we are aware. Attitudes can also be affected by people's social networks beyond their home neighbourhood and in the workplace, neither of which have been assessed here.
Results
Individual characteristics: income and altruism
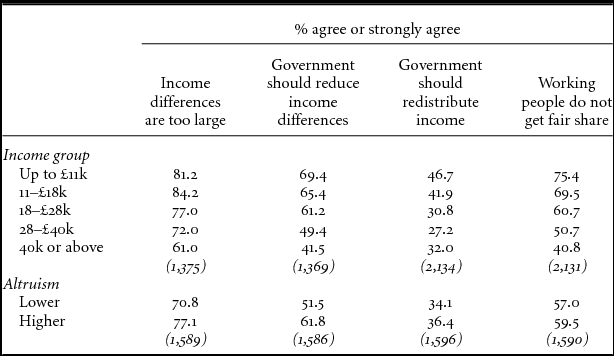
As can be seen from Table 1, attitudes change with income, the differences being greater in the upper ranges of the income scale. As income increases, fewer people think inequalities are too great or unfair, and fewer people agree that there should be government action on the issue. Support among higher income groups for redistribution of income is weaker than general support for government action (of any kind) to reduce income differences, perhaps since the latter might include welfare payments from general taxation, whereas the former implies taxing richer people to take money from them to give to lower income groups. In general, these findings are in accord with the theory that self-interest is a strong influence on welfare attitudes. Table 1 also shows that people who are more altruistic in general are more concerned about inequalities and more supportive of government action on the issue, but that differences in welfare attitudes by this general value are not as great as the differences by income.
Attitudes to inequality and redistribution by income quintiles and altruism

Neighbourhood context: deprivation and density
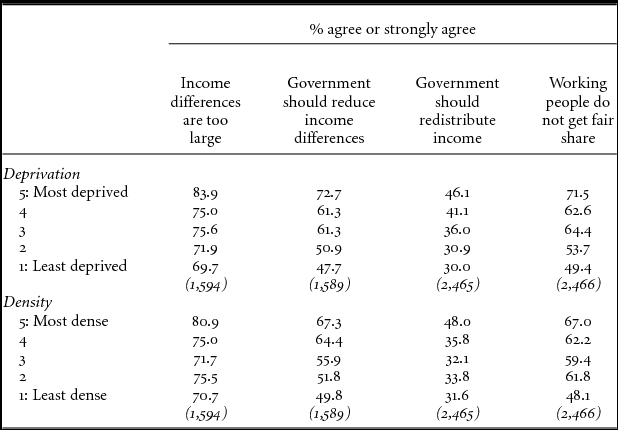
Table 2 shows how the responses to the four attitudinal questions vary by the neighbourhood of the respondent. As one might expect, concern about inequality and support for redistribution both rise as neighbourhood deprivation rises, though the neighbourhoods appear to coalesce in three groups: quintiles 1 and 2 (least deprived), quintiles 3 and 4 and quintile 5, where attitudes are several points apart from the next quintile. Attitudes vary the most on the issue of whether the responsibility to reduce income differences lies with the government, with support for this view 1.5 times higher in the most deprived than in the least deprived areas.
Attitudes to inequality and redistribution by neighbourhood deprivation and density quintiles
Variations in attitudes by neighbourhood density are less than by neighbourhood deprivation (Table 2). Concern about inequality and support for redistribution are lower in less dense, non-urban areas, and higher in the most dense, urban areas. The most striking differences are: much higher support for redistributive action among residents in the most dense neighbourhoods (12 points higher than in the next quintile); and much lower levels of concern about unfairness for working people in the least dense areas (14 points lower than in the next quintile).
Multivariate analysis of income, altruism, deprivation and density
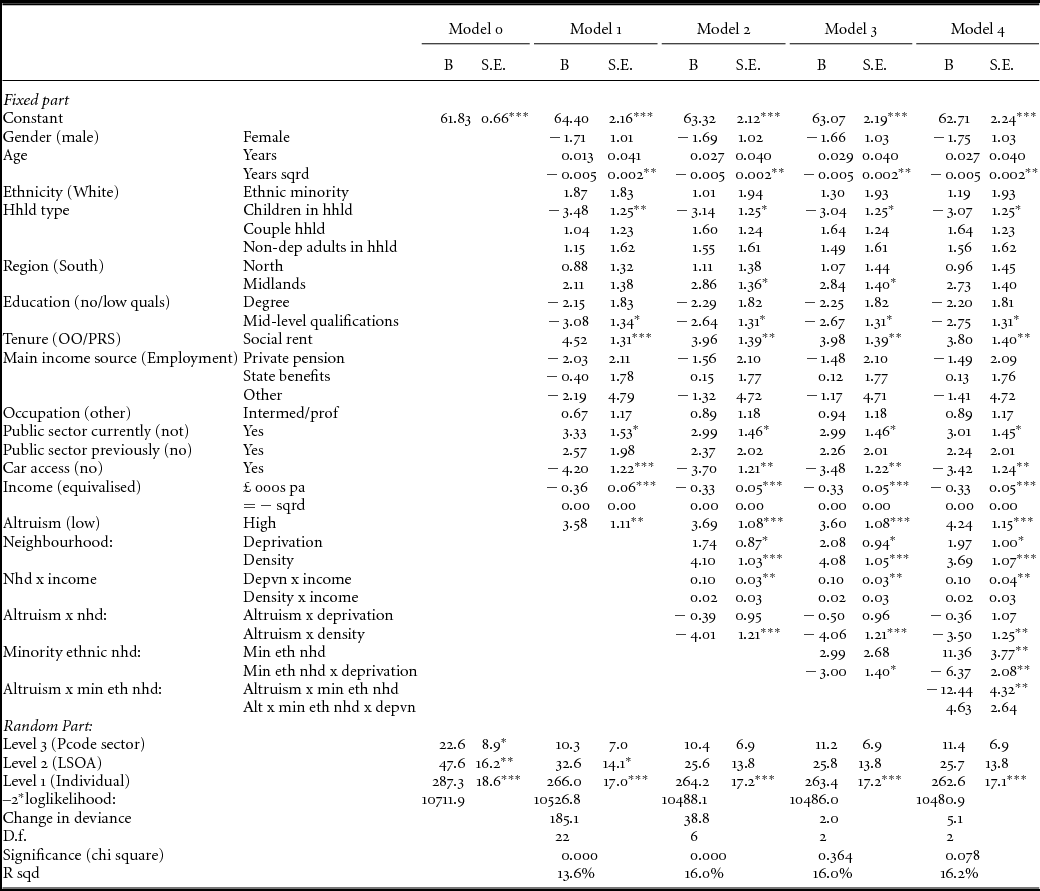
The next stage of our analysis used the Support for Redistribution Index created from the four attitudinal questions in a multi-level regression model that included individual characteristics and neighbourhood context measures as independent variables. The results of the modelling are given in Table 3.
Multivariate models of inequality and redistribution index
Notes: Significance levels: * = 5%; ** = 1%; *** = 0.1%; for random effects, these are based on one-sided tests.
Number of cases: 1229 at Level 1; 806 at Level 2; 194 at Level 3.
Model 1 in Table 3 confirms that greater individual income and wealth are associated with lower support for redistribution, as indicated by the significant, negative coefficient for car equivalised income and also car access. Support for redistribution also falls with age, and is lower in households with dependent children. Support for redistribution is higher among those employed in the public sector, or living in social rented housing, as expected.
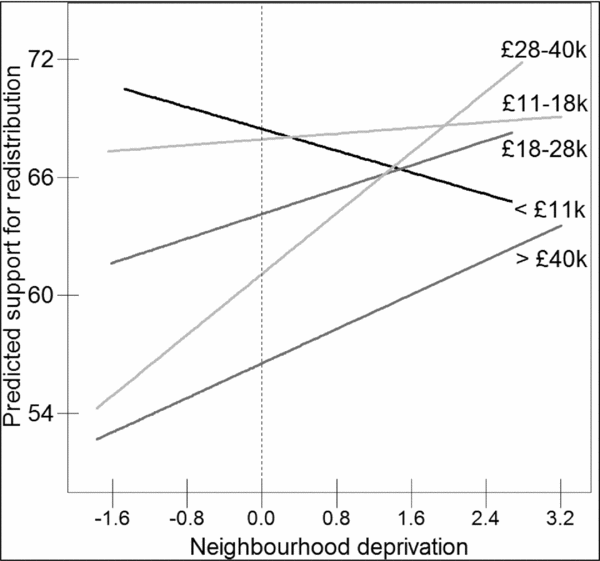
In the next stages, Models 2 to 4, we see that, after controlling for individual characteristics, support for redistribution increases with neighbourhood deprivation with the term significant in all three modelsFootnote 1 indicating that residential context does have effects on attitudes, at least for some groups. In Model 2, for example, there is significant interaction between neighbourhood deprivation and individual income so that support for redistribution rises faster with neighbourhood deprivation for higher income groups, as illustrated in Figure 1. From the middle income band upwards, support for redistribution increases with neighbourhood deprivation, but it does so at a faster rate for people in the higher income bands (£28–£40k and >£40k). For the two lowest income groups in Figure 1, there is either no effect of area deprivation, or a slightly negative effect. The fact that the effects of other controls for material position are largely unchanged between models 1 and 2 suggests that this is a real context effect, rather than being a product of neighbourhood deprivation merely reflecting unmeasured dimensions of individual income and wealth.
Inequality and redistribution index by neighbourhood deprivation and individual income Notes: Based on model 2 in Table 3, with income reduced to five bands.Higher score on x-axis indicates increasing neighbourhood deprivation. All other factors held constant.
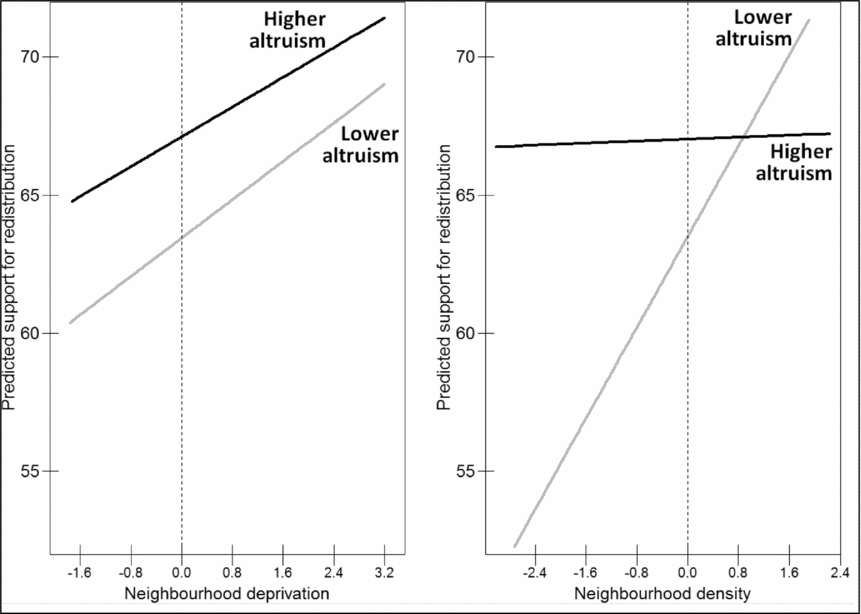
Model 2 in Table 3 also highlights the effects of altruism and density. Both individual altruism and neighbourhood density have significant positive effects upon support for redistribution, but there is also a significant interaction term between altruism and neighbourhood density (though not with deprivation), indicating that the effect of neighbourhood density is only effective for those with low altruism. This effect is illustrated in Figure 2, where an increase in the index score is observed for less altruistic respondents as neighbourhood density increases, whereas there is no change in the index score across the density spectrum for the more altruistic group. Indeed, those with low altruism living in the most dense neighbourhoods have higher support for redistribution than the altruistic group living in neighbourhoods of low density.
Inequality and redistribution index by neighbourhood deprivation, density and individual altruism Notes: Higher score on x-axis indicates increasing neighbourhood deprivation and density. All other factors held constant.
Individual and neighbourhood ethnicity
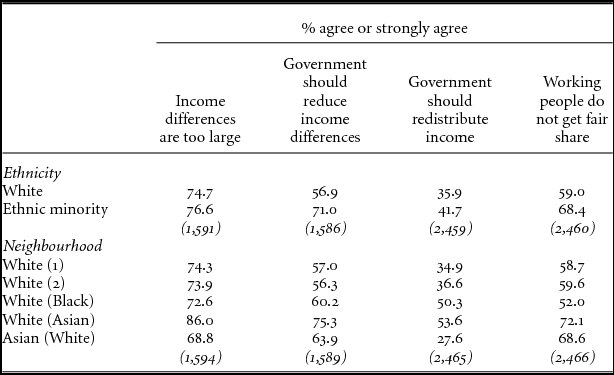
Generally speaking, ethnic minority respondents were more concerned about inequality and more supportive of redistribution than the White majority respondents, as shown in Table 4. The difference between the two groups was greatest with regard to views about government responsibility to reduce income differences. However, our multivariate analyses indicate that these differences in attitude between ethnic minority and White respondents may be due to factors such as differences in income, employment and housing tenure between the two groups, as the individual ethnic term was not significant in any of the models.
Attitudes to inequality and redistribution by individual and area ethnicity
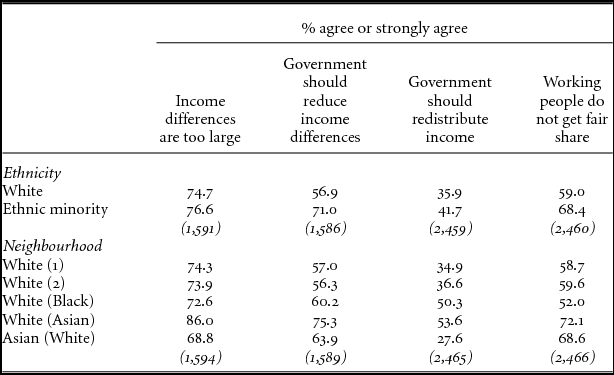
Table 4 also shows how the pattern of responses to the four questions varies across the different type of ethnic neighbourhoods. Overall, support for government responsibility or action on income inequality is lower in the White-dominated neighbourhoods than in the more ethnically mixed areas. One other thing to note is a marked difference in responses from people living in the two mixed Asian and White neighbourhood types (clusters 4 and 5). The level of agreement with each of the four statements is highest in the White(Asian) neighbourhoods, where Whites are twice as numerous as Asians, though Asians make up a third of the population. Conversely, concern for inequality and support for redistribution is lower in Asian(White) neighbourhoods, where the population mix is reversed, so that Asians are twice as numerous as Whites (see Appendix 1). This might be indicative of a different cultural attitude to inequalities and the role of the state in Asian communities, or reflect less sympathy among the majority White group for those on lower incomes when living in a predominantly Asian area. Such interactions are the next thing we explore.
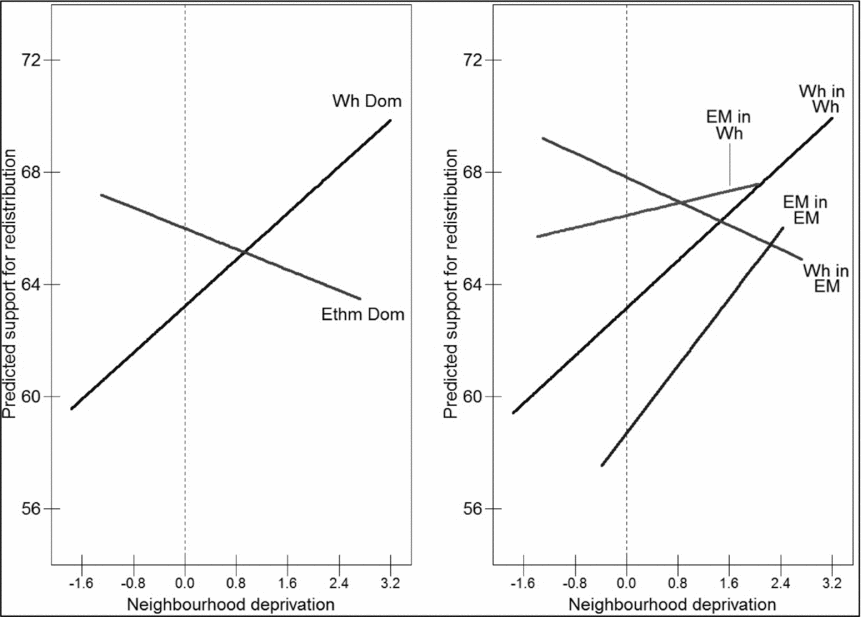
When we construct multivariate models of the Support for Redistribution Index there are several interesting interactions between individual ethnicity and altruism on the one hand, and neighbourhood deprivation and ethnicity on the other. As Model 3 in Table 3 and the left hand pane in Figure 3 both show, support for redistribution is, on average, higher in ethnic minority neighbourhoods than in White majority neighbourhoods at average levels of deprivation, although the term for ethnic minority neighbourhoods is not significant in Model 3. But whereas in White neighbourhoods support rises with neighbourhood deprivation, in ethnic minority neighbourhoods support for redistribution falls as deprivation rises – the interaction term is significant in Model 3, and indeed cancels out the main effect of deprivation for those in ethnic minority neighbourhoods. If we divide the sample into Whites and ethnic minorities, however, we find that the fall in support for redistribution as deprivation rises is only true for Whites in ethnic minority neighbourhoods (Figure 3, right hand pane, model not shown). Furthermore, the rise in support for redistribution with increasing levels of deprivation is most rapid in the case of Whites in White neighbourhoods and ethnic minorities in ethnic minority neighbourhoods, suggesting that correspondence between individual and neighbourhood ethnicity has a positive effect upon attitudes.
Inequality and redistribution index by individual and neighbourhood ethnicity at different levels of neighbourhood deprivation Notes: Higher score on x-axis indicates increasing neighbourhood deprivation and density. All other factors held constant. The coefficients for the Whites in Ethnic Minority areas as well as the interaction term with neighbourhood deprivation were very close to statistical significance at the 0.05 level.
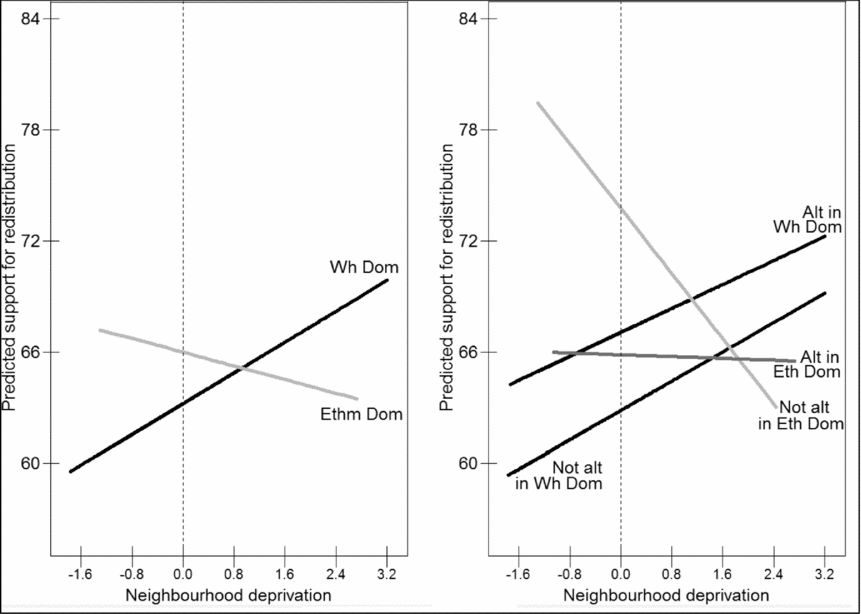
When we examine the effects of altruism in different neighbourhood contexts, in both ethnicity and deprivation terms (Model 4 in Table 3), we see a similar picture (Figure 4). The lowest support for redistribution exists among those with low altruism living in White majority neighbourhoods, but is highest among the similar group, low altruists, living in ethnic minority neighbourhoods. The other striking finding illustrated in Figure 4 is that whilst in White neighbourhoods the rise in support for redistribution with area deprivation (noted above) is true both for those with low and high altruism, this is not the case in ethnic minority neighbourhoods: here, the fall in support for redistribution as deprivation rises is true only for those with low altruism in ethnic minority neighbourhoods, and the decline is steep. An equivalent version of Model 4 and Figure 4 for White respondents produced exactly the same pattern.
Inequality and Redistribution Index by Altruism and Neighbourhood Ethnicity at Different Levels of Neighbourhood Deprivation Notes: Higher score on x-axis indicates increasing neighbourhood deprivation and density. All other factors held constant.
Discussion
In accord with existing understandings of individual attitudes, we found that material interests and personal values were strong influences upon concern for inequality and support for income redistribution. This was evident in the results for higher income and car ownership, which reduce support for redistribution, and for public sector employment and altruism, which increase support for redistribution. However residential context mattered as well. This may explain why living in social rented housing was positively associated with support for redistribution, but relying on state benefits for one's income was not: social renting may affect attitudes through the socialisation processes that occur within housing estates (Hanley, Reference Hanely2007), rather than being merely a signifier of self-interest.
In line with our research aims, our most important findings relate to how the neighbourhood context in which people live appears to influence their attitudes, most particularly through their interaction with individual characteristics and values. If a cohesive society is one which ‘hangs together’ and in which collective wellbeing is maximised and inter-group conflict minimised (Kearns and Forrest, Reference Kearns and Forrest2000), then living amongst one another, particularly with those who are somehow different to ourselves, may be important. As Barry (Reference Barry1989) argued, people are more likely to make sacrifices, such as agreeing to greater redistribution of income in our case, for those they interact with and/or share common institutions with. It is probable that both neighbourhood context and city or urban context are important influences on attitudes, as shown in our results for neighbourhood deprivation and density, both having a positive association with support for redistribution. At the neighbourhood level, mechanisms of both attitude transmission – through socialisation, communication and emulation processes – and knowledge accumulation are likely to operate.
But the findings for density are also suggestive of an urban effect, a ‘civilising’ influence of urban living that goes beyond the ‘toleration of differences’ identified by the classical sociologist Louis Wirth (Reference Wirth1938) as a prerequisite for rational behaviour in the city. Rather, the fact that support for redistribution increases with density points towards a realisation, in an urban context, of what Boyd (Reference Boyd2006) terms the ‘substantive’ version of civility – membership of a political community with attendant rights and responsibilities – with both ‘functional’ and ‘intrinsic’ value. In other words, we enact civility as ‘a moral obligation that we owe to others’ (p. 875), both so as not to ‘endanger peace and order’, but also out of a realisation that to afford others respect and dignity is a reflection of ourselves, and of the fact that others are no different to ourselves (Shils, Reference Shils and Grosby1997). In denser neighbourhood contexts, we may encounter and interact with others who are different to ourselves, and in so doing utilise the other version of civility, ‘formal civility’, comprising a range of social courtesies, manners and politenesses. The intriguing connection, hinted at in our findings, is that this urban form of behaviour and experience may feed through to attitudes to inequality, so that there is a link, however indirect, between ‘formal’ and ‘substantive’ civility.
Most interestingly, we found that the effects of neighbourhood context upon attitudes were greater for those groups with lower levels of concern about inequality and lower support for redistribution in the first place. Thus, neighbourhood deprivation had a stronger positive effect upon the attitudes of those on higher incomes, and, similarly, neighbourhood density had a stronger positive effect upon the attitudes of those with lower levels of altruism. It might be hoped that such support could feed through to policy interventions to reduce inequality to such an extent that wellbeing outcomes of the kinds examined by Wilkinson and Pickett (Reference Wilkinson and Pickett2009) were to improve, but also so that conflict over inequality were forestalled – events such as the riots which ‘ensue due to the [social] landscape’ and in so doing also constitute a place (Dorling, Reference Dorling2012a). In that case then the pursuit of ‘mixed communities’ would be more likely to meet the two tests stipulated by Galster (Reference Galster2007), namely that such mixing would enhance both social equity and efficiency right across society. But our research also indicates that the argument about whether or not social mixing is an agenda worth pursuing should not be restricted to the question of whether or not it improves life chances or labour market outcomes for individuals (Manley et al., Reference Manley, van Ham and Doherty2011), but must also consider societal level effects upon civic attitudes.
Our findings in relation to the Ethnic dimension of the neighbourhood context are a little more complicated. In the first place, it would appear that in more mixed neighbourhoods, i.e. those not so dominated by the White majority, people express greater concern about inequality and more support for redistribution. And when White people or less altruistic people live in such ethnically mixed neighbourhoods, they also exhibit more support for redistribution than equivalent people living in White-dominated neighbourhoods. This is consistent with Uslaner's (Reference Uslaner2010) finding for the UK that, ‘For whites, simply living in diverse and integrated neighborhoods boosts trust’ (p. 27). On this basis, we would argue that the recent trend for more ethnically mixed communities could produce effects in terms of political attitudes via the neighbourhood mechanisms we described earlier, and thus social interactive benefits should not be discounted, for example when justifying mixed communities mainly on housing quality grounds (Ratcliffe, Reference Ratcliffe, Ratcliffe and Newman2011b). Furthermore, if ‘an equalities approach to social cohesion would look first to address inequality’ (Newman and Ratcliffe, Reference Newman, Ratcliffe, Ratcliffe and Newman2011), again our findings indicate that ‘a social capital framework’ and ‘policies that are assumed to build bonding capital based on the creation of an enhanced social housing mix’ (p. 264) could also have an important role to play in the medium- to long-term in helping to shift public attitudes towards greater support for equality and redistribution.
One qualification to this is the fact that the higher support for redistribution among Whites and non-altruists living in ethnically mixed neighbourhoods falls as neighbourhood deprivation rises, in contrast to the main effect of deprivation and to the fact that for Whites living in White-dominated neighbourhoods support for redistribution rises with increased deprivation. This may indicate that concern for those on low incomes or on benefits extends more to those who are similar to the majority than to those who are ethnically different. High levels of deprivation in neighbourhoods with large ethnic minority populations might raise questions in the minds of White majority residents living in such neighbourhoods about the causes of low income and entitlement to benefits of such groups, thus reducing their support for redistribution. Indeed, one issue that we have not been able to assess here is how the specific ethnic composition of more deprived ethnic minority neighbourhoods differs from other such neighbourhoods (e.g., in terms of countries of origin and citizenship status), which may affect the attitudes of White majority residents. However, the finding is important given what we know about the distribution of Ethnic minority residents in the UK, namely that even in towns and cities with large ethnic minority populations, Asian and Black residents can be two to five times as numerous in the most deprived neighbourhoods as in other areas (Turok et al., Reference Turok, Kearns, Fitch, Flint, McKenzie and Abbotts2006, pp. 110–11).
The findings with regard to the ethnic context may also be a manifestation of what Hickman et al. (Reference Hickman, Mai and Crowley2012) describe as the impact of ‘dominant narratives in local settings . . . on the unfolding of social cohesion’ (p. 191), reflecting public discourse and suspicions about ethnic minorities and immigrants on benefits. Recalling that Whites are still often the largest resident group in most of the ethnically mixed neighbourhoods considered here (see Appendix 1), it may also be the case that support for redistribution falls as deprivation rises in ethnically mixed neighbourhoods due to the ‘narratives of “from hereness”’ that emerge in such socially excluded and marginalised communities (Hickman et al., Reference Hickman, Mai and Crowley2012: 195), again raising the issue of the perceived legitimacy and entitlement of ethnic minority residents. As Flint and Robinson put it: ‘The neighbourhood is the arena in which the dynamics of community and cohesion play out’ (Reference Flint, Robinson, Flint and Robinson2008: 263).
Our findings also highlight the issue of whether residential separation along economic lines might matter more for societal attitudes and cohesion than ethnic residential patterns? Past research has shown that segregation by employment and income in English cities can equal or exceed ethnic segregation (Turok et al., Reference Turok, Kearns, Fitch, Flint, McKenzie and Abbotts2006). Further, as ethnic segregation gradually declines, the difficulty of producing and sustaining neighbourhoods mixed by housing tenure and income (Meen et al., Reference Meen, Gibb, Goody, McGrath and Mackinnon2005) becomes socially more significant. This is also important given that religious identity is falling, and national identity as a factor in self-identity, and by implication the identification of others, is increasingly challenged by identity based on factors such as lifestyle and profession (Marsh et al., Reference Marsh, Bradley, Love, Alexander and Norham2007). It may be that status and income factors, more than ethnic factors, increasingly influence who we choose to live amongst and who we wish to care about.
Conclusion
‘What is it about certain cities and places that fosters specific attitudes?’
‘Do creative, social and civic attitudes change depending on where we live?’
‘Does it come from the socioeconomic–ethnic mix; are the proportions in the urban stew critical, like in a recipe?’(David Byrne (Reference Byrne2010): Bicycle Diaries, pp. 245–46)
The findings from our analysis of opinions on inequality and income redistribution in England suggest that patterns of residence exert a degree of influence over aggregate levels of concern about income differences and support for solidaristic policy interventions. Thus, there may be societal consequences emanating from recent trends and developments that sustain or extend residential sorting in the UK, including: growing income inequality (OECD, 2011); rising wealth inequalities and housing equity/price differentials (Dorling, Reference Dorling2012b; Thomas, Reference Thomas2011); relocation of housing benefit recipients to cheaper districts (Brown, Reference Brown2012); and weaker delivery of affordable housing through reductions in grant funding and reconsideration of planning obligations placed upon developers (Wilson, Reference Wilson2013; Tate et al., Reference Tate, Lloyd, Sankey, Carlyon, Marshall, Jefferys, Williamson and Chung2012).
To the extent that current trends and policies (or absence of policies) lead to the continuing separation of the rich from the poor or the non-altruistic from those in need, then the solidaristic sentiments that underpin social cohesion may be weakened. Furthermore, whether or not the recent trend towards more ethnic residential mixing has a positive effect upon attitudes to redistribution may depend upon a number of things: the extent to which such ethnic mixing extends beyond deprived areas, for example through the suburbanisation of ethnic minorities (Finney and Simpson, Reference Finney and Simpson2009); whether the prosperity of ethnic minority households and areas can be improved; and whether or not White-dominated areas expand elsewhere (Easton, Reference Easton2013).
Sennett (Reference Sennett2012) remarks that inequality weakens co-operation and that: ‘Both sympathy and empathy convey recognition, and both forge a bond . . . and both these recognitions are necessary . . . to practice co-operation’ (p. 21). But he also notes that sympathy and empathy are forms of engagement with others, and, as such, our study points towards the potentially, collectively corrosive effects not only of inequality and differences between individuals, but also of differences between areas in reducing that engagement.
Neighbourhood ethnic clusters