
I. INTRODUCTION
Recently, the aggravated energy and environmental problems have encouraged extensive investigation of new clean energy to replace traditional fossil fuels. Photocatalytic technology is considered as the effective means for converting solar energy to chemical energy. Especially, the photocatalytic hydrogen production from water has become one of the most exciting, sustainable, and environmentally friendly technologies for producing renewable fuels. The photocatalytic hydrogen production could convert solar energy to chemical energy from water, which is potential to replace the traditional fossil fuels.
In 1972, Fujishima and Honda found that Pt and rutile TiO2 electrodes could photoelectrochemically split water under visible light.Reference Fujishima and Honda1 Since then, photocatalytic water splitting to produce hydrogen has been considered as an ideal technology. Lots of semiconductor photocatalysts were reported, such as TiO2,Reference Luo, Yu, Li, Dong, Wang, Fan and Zhang2 ZnO,Reference Sin, Lam, Satoshi, Lee and Mohamed3 Cu2O,Reference Luo, Huang, Li, Dong, Fan and Zhang4 SrTiO3,Reference Dong, Shi, Cheng, Wang, Weng and Han5 CdS,Reference Ma, Yehezkeli, Domaille, Funke and Cha6 MoS2,Reference Ai, Ruan, Shen and Lu7 and BiVO4,Reference Negishi, Naya and Tada8 to enhance the optical absorption range of the semiconductors, the separation capability of the photoinduced electron–hole pairs, the photocatalytic stability of the photocatalysts, etc. Recently, it is found that graphitic carbon nitride (g-C3N4) with the narrow band gap and high stability is a potential photocatalyst. As a nonmetallic polymeric organic semiconductor, g-C3N4 has a layered structure, and it can be easily prepared by thermal polymerization of abundant nitrogen-rich precursors such as urea, thiourea, melamine, dicyandiamide, cyanamide, etc.Reference Su, Sun, Wang, Yang, Cheng and Zhang9–Reference Li, Sun, Sui, Qian and Chen12 It has been widely investigated for the photocatalytic pollutant degradation, photocatalytic water splitting, CO2 reduction, etc.Reference Zhang, Jiang, Liu, Wang, Liu, Zhu and Zhu13–Reference Kuriki, Ishitani and Maeda15 Nevertheless, the photocatalytic activity of the bulk g-C3N4 is very low, due to the high recombination rate as well as few active and adsorption sites exposed.
To increase the photocatalytic activity of g-C3N4, many strategies have been taken, such as nanostructure engineering, foreign elements doping, and band alignment by coupling with other semiconductor photocatalysts to improve the electron–hole separation.Reference Ma, Ran, Dai, Jaroniec and Qiao16–Reference Gu, Liao, Yin, Long, Wang and Xue19 Gu et al.Reference Gu, Liao, Yin, Long, Wang and Xue19 obtained g-C3N4 microspheres through a template-free solvothermal approach with postheating treatment. The porous microspheres exhibited narrow band gap and lower resistance, leading to more effective visible-light harvesting and photogenerated charge carrier transport. She et al.Reference She, Wu, Xu, Zhong, Wang, Song, Nie, Liu, Yang, Rodrigues, Vajtai, Lou, Du, Li and Ajayan17 reported that α-Fe2O3 nanosheets were able to promote exfoliation of g-C3N4 in α-Fe2O3/g-C3N4, and the obtained 2D hybrid exhibited a Z-scheme junction, which effectively suppressed the recombination of electron–hole pairs. Zhang et al.Reference Zhang, Lan, Lin, Lin and Wang18 modified g-C3N4 with Pt, PtOx, and CoOx as redox cocatalysts to directly split pure water photocatalytically.
Doping adds external impurities into semiconductor, which is beneficial to modulate the bulk and surface electronic structures for the manipulation of optical, luminescence, conductive magnetic, or other physical properties.Reference Yan, Li and Zou20 Doping of metal elements, such as Fe, Cu, Co, Ni, etc., could modify the optical and electronic properties of g-C3N4 to increase light absorption, reduce band gap, and accelerate charge mobility, which are necessary for pronounced photocatalytic activity.Reference Ding, Chen, Antonietti and Wang21,Reference Yue, Li, Iwai, Kako and Ye22 Furthermore, due to the advantages of abundance, environmental friendliness, and easy synthesis, the nonmetal element doping is also a successful method to improve the photoactivity of g-C3N4. According to the report,Reference Hu, Ma, Xie, Li, Fan, Wang, Wang, Wang, Kang and Wu23 the oxygen-functionalized S and P co-doped g-C3N4 nanorods had the outstanding visible-light–driven rhodamine B degradation activity. S and P co-doping inhibited the crystal growth of g-C3N4 and enhanced the photocatalytic RhB degradation. Zhu et al.Reference Zhu, Ren and Yuana24 proposed that the phosphorus-doped g-C3N4 had the increased H2 evolution rate than pure g-C3N4. In addition, other nonmetal elements, such as B, O, and S, were doped and investigated.Reference Bu and Chen25–Reference Kong, Won, Kim and Woo27 Although there are many reports on nonmetal element doping, the effects of different nonmetal elements on band gap and electronic structure are rarely reported.
In this work, we have successfully fabricated B, P, and F doped g-C3N4, by a facile one-step heating method. The doping effects of three different elements on g-C3N4 were determined by a series of spectroscopy and electrochemical analysis. The photocatalytic activities were measured by photocatalytic H2 evolution under visible light illumination. A possible reaction mechanism was proposed.
II. EXPERIMENTAL SECTION
A. Synthesis of photocatalysts
All the chemicals used were of analytical grade, and deionized water was used in all the experiments.
g-C3N4 was prepared by calcination using urea as the precursor. Typically, 10 g urea was heated to 520 °C with a heating rate of 5 °C/min and maintained at 520 °C for 2 h in a muffle furnace. The calcination process was carried out in a semiclosed system of a covered crucible to prevent sublimation. The obtained graphitic carbon nitride was labeled as CN.
The nonmetal element doped g-C3N4 were synthesized by one-step heating the mixture of urea and the precursor of nonmetal elements (NaH2PO4 for element P, (C6H5)4BNa for B, and NH4F for F). In a typical procedure, 10 g urea and appropriate amounts of the precursor of nonmetal elements were mixed in 20 mL water followed by ultrasonic treatment for 30 min at normal temperature. The mixture was further stirred at room temperature for 30 min and then heated to 80 °C for 3 h to evaporate water to obtain white powders. After grinding, the obtained powders were annealed at 520 °C with a heating rate of 5 °C/min and maintained at 520 °C for 2 h in a muffle furnace. The final products were collected for use without further treatment. The products were named as XCN, X referred to the doped element (B, P, or F) in g-C3N4. The proportion of nonmetal elements in urea is 0.05 wt% in the precursors of all the doped samples.
B. Characterization
Scanning electron microscopy (SEM) was performed on a Hitachi S-4800 electron microscope (Hitachi, Tokyo, Japan) operated at a beam energy of 10.0 kV. The catalysts were gold-coated on a Bal-Tec SCD-500 device (Bal-Tec Co., Balzers, Liechtenstein) for 100 s (gold coat 100 Å thick). The crystal structures were identified by X-ray diffraction (XRD) with a Philips X’Pert Pro diffractometer (Philips, Amsterdam, the Netherlands) by Ni-filtered Cu Kα radiation (λ = 0.15418 nm). The powder patterns were measured between 5° and 80°. X-ray photoelectron spectroscopy (XPS) analysis was performed on a PHI 5000 VersaProbe high performance electron spectrometer (ULVAC-PHI, Inc., Chigasaki, Japan) via monochromatic Al Kα radiation (1486.6 eV). The samples were outgassed at room temperature in a UHV chamber (<5 × 10⁻⁷ Pa). The charging effect of samples was compensated by all binding energies (BEs) referenced to 284.6 eV of the C 1s peak. The baseline of the signals was created considering a Shirley-type background. All the signals were fitted via Gaussian–Lorentzian curves to obtain the BEs of the different element core levels. The Brunauer–Emmett–Teller (BET) surface area was measured by nitrogen adsorption at 77 K on a Micromeritics ASAP-2020 adsorption apparatus (Micromeritics, Norcross, Georgia). The FTIR spectra were collected from 400 to 4000 cm−1 at the spectral resolution of 4 cm−1 on a Nicolet 5700 FTIR spectrometer (Thermo Electron Corporation, Madison, Wisconsin). The samples (5 mg) were mixed with KBr and pressed into self-supported pellets (50 mg/cm2). UV-vis diffuse reflectance spectroscopy data were recorded in the range of 200–800 nm by using a Shimadzu UV-2401 spectrophotometer (Shimadzu Scientific Instruments, Inc., Columbia, Maryland) with the reference of BaSO4. Photoluminescence (PL) spectra were determined on an F-7000 fluorescence spectrophotometer (Hitachi, Tokyo, Japan). The wave length of the excitation light was 325 nm. The experiments were carried out in the solid state. The slit in all measurements was 1.5 nm.
C. Photoelectrochemical measurements
Electrochemical measurements were carried out on a CHI660A electrochemical workstation (Shanghai Chenhua Instrument, Inc., Shanghai, China) using a standard three-electrode cell. The prepared samples were deposited on an In-doped SnO2-coated glass (ITO glass) electrode as the working electrode with an active area of approximately 1 cm2, with Pt wire as the counter electrode, saturated calomel electrode (SCE) as the reference electrode, and 0.5 M Na2SO4 aqueous solution as the electrolyte. A 300 W Xe lamp with the 420 nm cut-off filter served as a light source. The working electrodes were prepared as follows: 2 mg photocatalyst was grounded with 5 mL ethanol and 10 μL 5% Nafion (DuPont) to make a slurry. Afterward, the slurry was coated onto a 1 × 1.5 cm ITO glass electrode. After air-drying, the working electrode was further dried at 393 K for 2 h to improve adhesion. Finally, a homogeneous film can be obtained. The transient photocurrent densities of the as-prepared electrodes were tested at 0.5 V versus the SCE under visible light irradiation.
D. Photocatalytic H2 generation testing
The photocatalytic hydrogen evolution reactions were carried out in a top-irradiation type vessel linked to a gas-closed glass system (Ceaulight CEL-SPH2N-D, Ceaulight, Beijing, China) under an irradiation of the 300 W Xe lamp with the 420 nm cut-off filter. 50 mg of the catalyst was dispersed in 100 mL aqueous solution containing triethanolamine (TEOA; 10 vol%) as the sacrificial electron donor. H2PtCl6 aqueous solution was added, which was in situ reduced to Pt (3 wt% Pt) during the reaction. The temperature of the solution was kept around 6 °C. The reaction system was sealed and evacuated for 30 min before illumination. The amount of generated hydrogen was automatically collected and determined by using an online gas chromatograph equipped with a thermal conductive detector. Argon was used as the carrier gas for gas chromatography.
III. RESULTS AND DISCUSSION
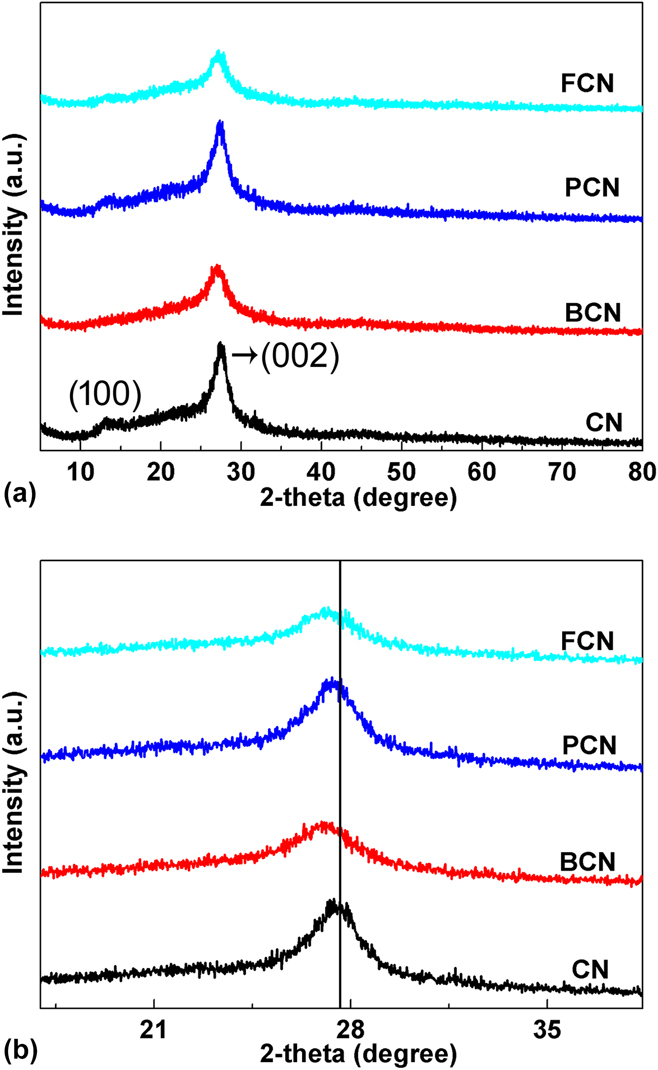
The crystal structure, texture, and optical and electronic properties of the as-prepared CN, BCN, PCN, and FCN samples were investigated by various characterization methods. The crystalline structures of the as-prepared samples were examined by XRD analysis. The XRD patterns of the three different nonmetal element-doped g-C3N4 are shown in Fig. 1(a). Clearly, pure graphitic carbon nitride (CN) shows two XRD peaks at 2θ = 13.1° and 27.5°, which can be perfectly indexed to the (100) and (002) planes of g-C3N4, respectively.Reference Lan, Zhang and Wang28 The (100) plane with the average interlayer distance of d = 0.675 nm is related to the in-plane repeating units of the heptazine heteroatom cycles, and the (002) plane with an average distance of d = 0.326 nm is attributed to the graphitic layer stacking, similar to graphite.Reference Ma, Li, Li and Liu29–Reference Gracia and Kroll31 Interestingly, when B, P, and F doped, the peak of 27.5° shifts to 27.1°, 27.3°, and 27.0° [Fig. 1(b)], indicating that an increased interplanar stacking distance for BCN, PCN, and FCN, and the dopants are possibly adsorbed in a large hollow space of the interplanar structure.Reference Ma, Lv, Xu, Liu, Zhang and Zhu32 In addition, the peak intensity at about 27.3° follows the order: CN > PCN > BCN > FCN. The decreased peak intensity suggested that the nonmetal element doping suppressed the g-C3N4 growth.
(a) Powder XRD patterns of CN, BCN, PCN, and FCN samples; (b) the magnified patterns in the range of 17°–38°.

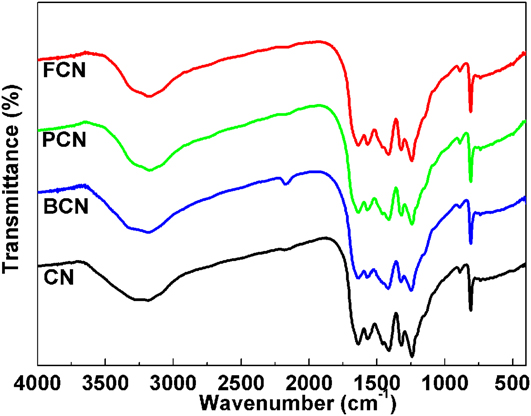
The molecular structure information of carbon nitride materials was analyzed by using FTIR spectra, as depicted in Fig. 2. The CN, BCN, PCN, and FCN samples exhibit similar FTIR vibration modes. For the pure CN sample, the peak at 809 cm−1 is related to the out-of-plane bending vibration of the s-triazine ring.Reference Li, Gan, Wang, Han and Niu33 The prominent peaks at 1237, 1319, 1414, 1572, and 1638 cm−1 are typical stretching vibration modes of C=N and C–N heterocycles.Reference Christoforidis, Montini, Bontempi, Zafeiratos, Delgado Jaen and Fornasiero34 In addition, the broad peak between 3600 and 2900 cm−1 corresponds to the stretching vibration modes of the N–H and O–H stretches of the adsorbed H2O. Furthermore, all samples have the weak peak at about 2167 cm−1, which belongs to –C≡N or –C≡C– and possibly result from the unreacted intermediate species HO–C≡N or –C≡N on the surface.Reference Zhang, Zhang, Zhang and Wang35
FTIR spectra of CN, BCN, PCN, and FCN samples.

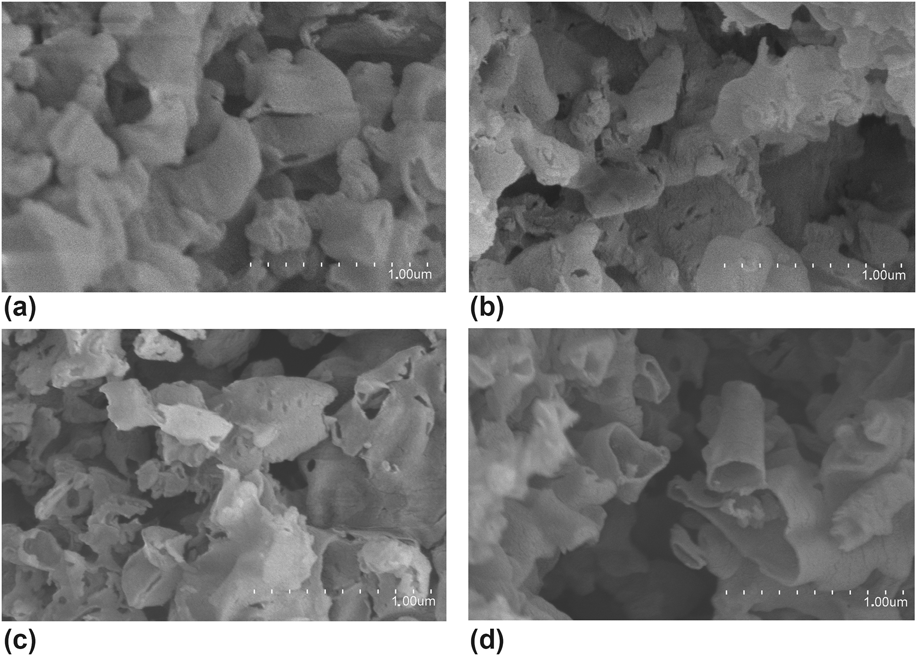
SEM images were also used to investigate the morphologies of CN, BCN, PCN, and FCN samples. Figure 3 exhibits the SEM images of CN, BCN, PCN, and FCN samples. CN shows a typical ultrathin nanosheet structure. The nanosheets are curling to reduce the surface tension. This phenomenon is found to be identical to the construction of exfoliated carbon scrolls by peeling graphite.Reference Lin and Wang36,Reference Xu, Zhang, Cheng and Zhu37 All the nonmetal element-doped g-C3N4 display similar morphologies to pure g-C3N4.
SEM images of (a) CN, (b) BCN, (c) PCN, and (d) FCN samples.

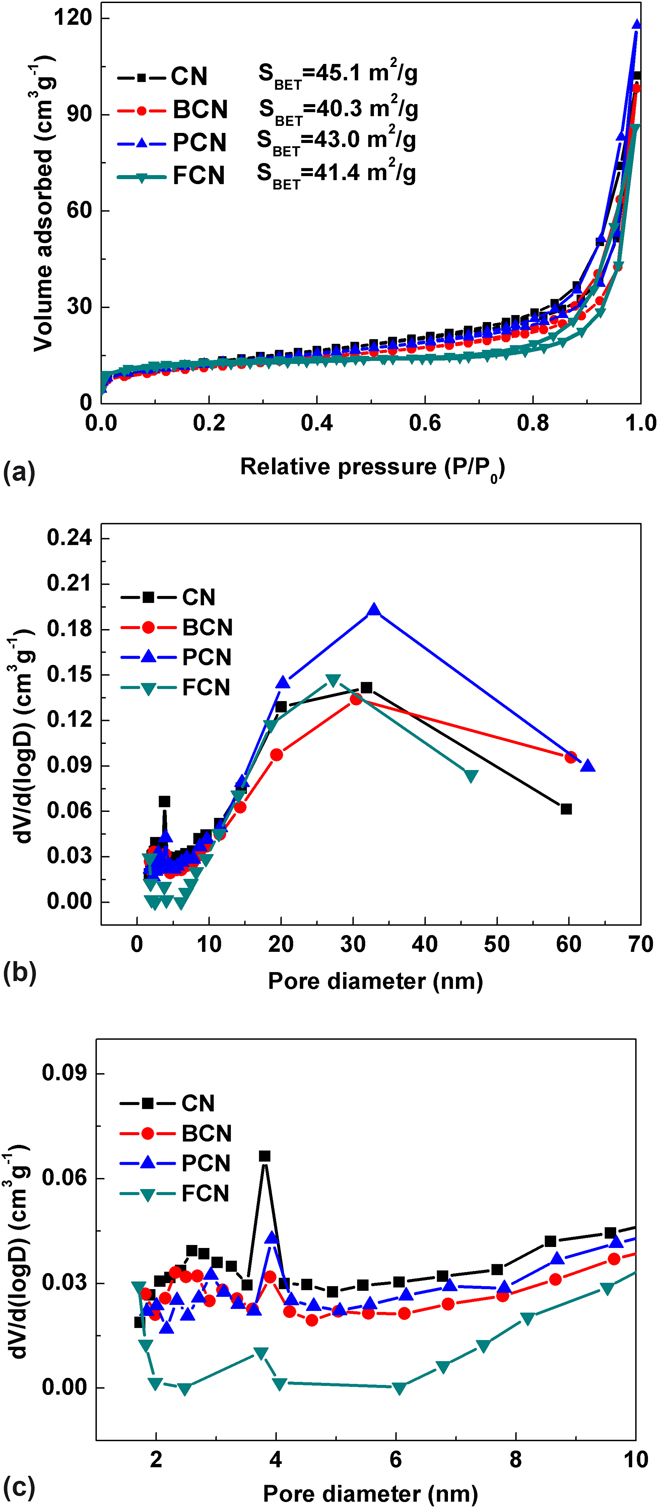
To characterize the specific surface area and pore properties of the as-prepared CN, BCN, PCN, and FCN samples, we carried out the N2 sorption analysis. The nitrogen adsorption–desorption isotherms [Fig. 4(a)], Barrett–Joyner–Halenda (BJH) pore size distribution curves [Fig. 4(b)], and the magnified BJH pore size distribution plots in the region of <10 nm [Fig. 4(c)] of CN, BCN, PCN, and FCN samples reveal that the four samples exhibit type IV isotherms with distinct H3 hysteresis loops, which is a characteristic of mesoporous materials.Reference Hu, Yang, Tian, Wei, Ding, Zhong and Chu38 The type H3 hysteresis loops at 0.70 < P/P 0 < 1.00 in the isotherms of CN, BCN, PCN, and FCN samples, which are often observed on the aggregates of plate-like particles. The BET specific surface areas of CN, BCN, PCN, and FCN samples are calculated to be 45.1, 40.3, 43.0, and 41.4 m2/g, respectively. The BET surface areas of nonmetal element doped g-C3N4 are slightly lower than those of pure g-C3N4. It is inferred that the introduction of nonmetal elements into the urea-condensation reaction may change the texture and the surface morphology, such as collapse of mesopores, and thus the surface area decreased. The pore size distributions of g-C3N4 are centered at 3.9 and 32 nm, which represent that there are two kinds of pore structures in g-C3N4. The pore sizes of nonmetal element doped g-C3N4 are similar to those of pure g-C3N4.
(a) Nitrogen adsorption–desorption isotherms; (b) BJH pore size distribution plots for CN, BCN, PCN, and FCN samples; (c) The magnified BJH pore size distribution plots in the region of <10 nm.

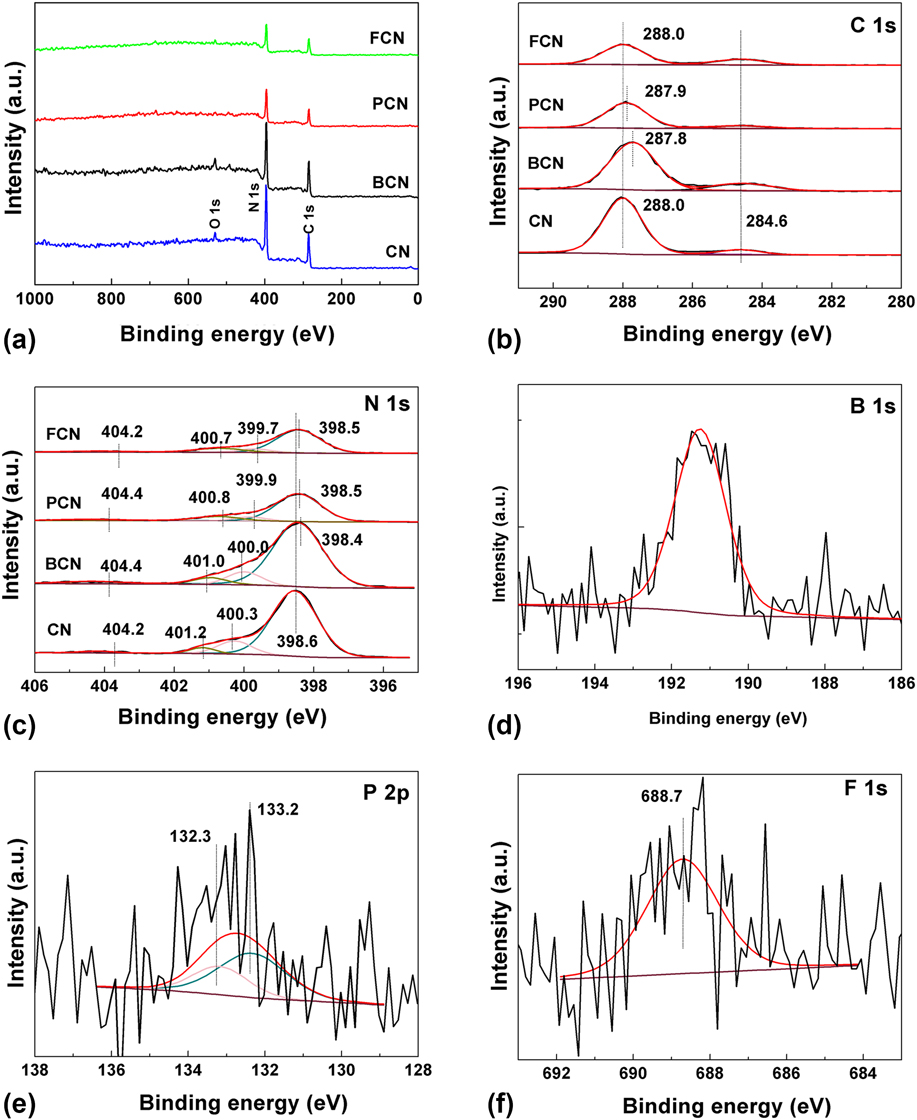
The surface elemental compositions and bonding configurations of CN, BCN, PCN, and FCN were characterized by XPS analysis, and the results are presented. The XPS survey spectra of the as-prepared samples are displayed in Fig. 5(a). The elements C and N are the main constitution in all samples. The oxygen element in CN and BCN is ascribed to the adsorption of oxygen from the atmosphere during the preparation, which is consistent with the reported literature.Reference Ong, Putri, Tan, Chai and Yong39 Because of the low amount of B/P/F, the peaks cannot be detected in the survey spectra, but they can be seen in high-resolution XPS spectra. As shown in Fig. 5(b), the C 1s XPS spectrum of g-C3N4 could be deconvoluted into two main peaks centered at approximately 284.6 and 288.0 eV.Reference Ong, Putri, Tan, Chai and Yong39 The weak peak at 284.6 eV is attributed to the carbon contamination.Reference Lu, Pei, Weng, Feng, Fang, Zheng, Huang and Liu40–Reference Huang, Sun, Lv, Zhang, Li and Li42 The strong peak at 288.0 eV corresponds to sp 2-bonded carbon atoms in the heterocycle (N–C=N) of aromatic g-C3N4, which is related to the major skeleton carbon in the triazine-base heterocycle.Reference Huang, Sun, Lv, Zhang, Li and Li42,Reference Zhao, Zhang, Lin, Nong, Cui, Wu and He43 As for BCN and PCN, the BEs of the N–C=N groups decrease by 0.2 and 0.1 eV, respectively, while the BE of the N–C=N group in FCN is unchanged compared with that of g-C3N4.
(a) XPS survey spectra of the as-prepared samples; high-resolution XPS spectra of CN, BCN, PCN, and FCN: (b) C 1s, (c) N 1s, (d) B 1s, (e) P 2p, and (f) F 1s.

The N 1s XPS spectra for CN, BCN, PCN, and FCN are displayed in Fig. 5(c). The N 1s spectrum of g-C3N4 is deconvoluted into four peaks at 398.6, 400.3, 401.2, and 404.2 eV.Reference Li, Du, Wang, Yin, Tu, Chen, Kraft, Chen and Xu44 The dominant peak at 398.6 eV is assigned to sp 2-hybridized nitrogen (pyridine-N) in triazine rings (C–N=C).Reference Yan, Wu, Chen, Zhang, Zhang and Liu45 The C–N=C serves as the main carbon and nitrogen elements in the skeleton, which is considered as the building block of the conjugated system. The peak at 400.3 eV corresponds to ternary nitrogen bonded to carbon atoms (pyrrolic-N) in the form of N–(C)3.Reference Tian, Zhang, Liu, Yu, Li and Huang46 The pyridine-N and pyrrolic-N together with N–C=N form the heptazine heterocyclic ring units, which are the main substructure of g-C3N4. The peak at 401.2 eV is related to the presence of amino groups (graphitic-N, C–N–H).Reference Dai, Lu, Liang, Zhu, Liu, Geng and He47 The small peak at 404.2 eV is originated from the positive charge effect in heterocycles owing to the protonation of g-C3N4.Reference Li, Du, Wang, Yin, Tu, Chen, Kraft, Chen and Xu44 Interestingly, after the doping of B, P, and F, the pyridine-N shifts to lower BE from 398.6 to 398.4, 398.5, and 398.5 eV, and the pyrrolic-N shifts from 400.3 eV (CN) to 400.0, 399.9, and 399.7 eV for BCN, PCN, and FCN, respectively. The shift to lower BE is also found in the peaks of graphitic-N. Compared with the BE of 401.2 eV of CN, the BCN, PCN, and FCN shift to lower BEs of 401.0, 400.8, and 400.7 eV, respectively. In conclusion, after the B/P/F doping, the BEs of N 1s shift to lower BE, and the pyrrolic-N and graphitic-N shift more compared with pyridine-N. Therefore, the B/P/F doping increases the electron density of pyrrolic-N and graphitic-N.
The B 1s XPS spectrum is shown in Fig. 5(d); the peak centered at 191.3 eV is typical BE for B 1s.Reference Lu, Chen, Wu, Fan, Liu, Le, Jiang and Song26 The P 2p XPS spectrum of PCN is shown in Fig. 5(e), the peak centered at 132.3 eV is assigned to P 2p 3/2, while the peak centered at 133.2 eV is related to P 2p 1/2.Reference Ma, Li, Li and Liu29 Fig. 5(f) presents the F 1s XPS spectrum of FCN. The peak at 688.7 eV is assigned to the typical BE of F 1s.Reference Wang, Di, Antonietti, Li, Chen and Wang48 On the basis of XPS analysis for the corresponding samples, the contents of B in BCN, P in PCN and F in FCN are 1.35, 0.72, and 1.08 atom%, respectively.
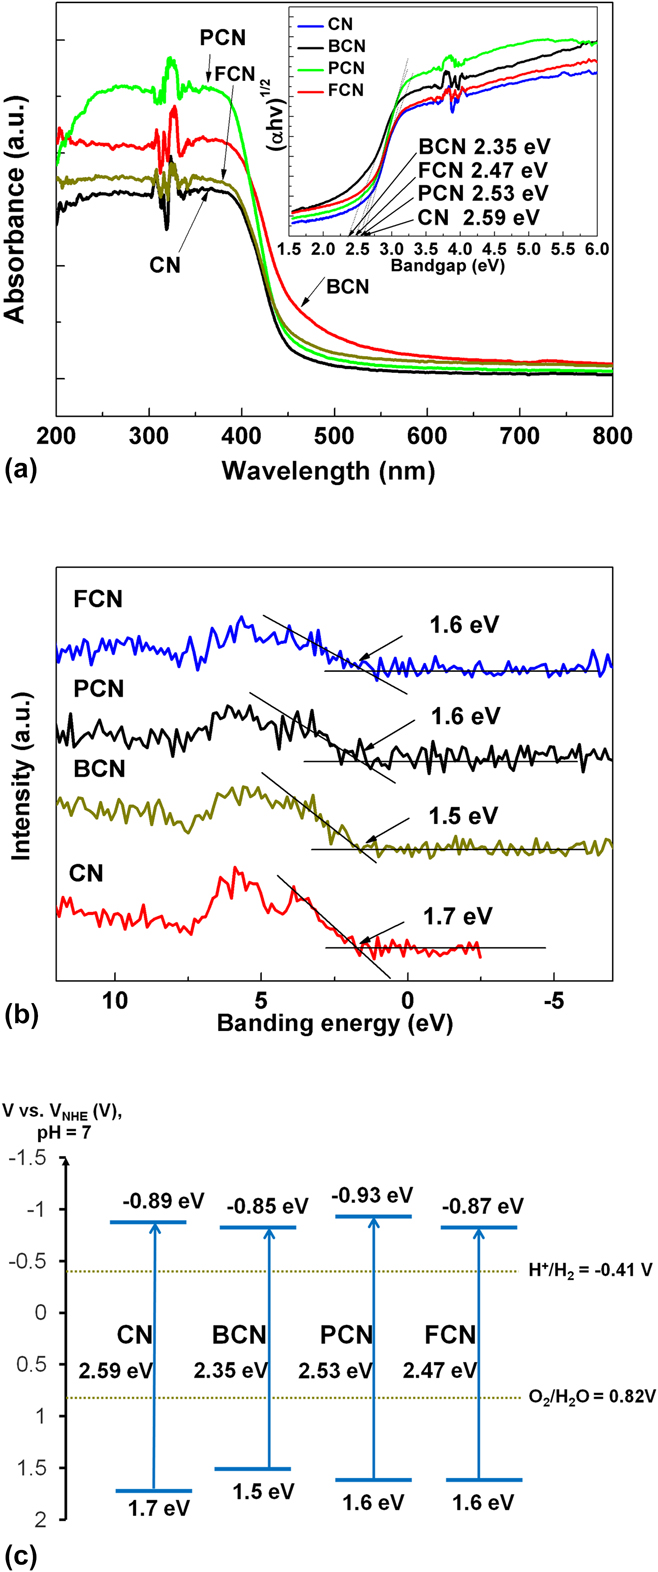
The introduction of nonmetal elements into the graphitic carbon nitride polymeric skeleton changes the structure and electronic aspects and thus the resultant optical properties. To gather more insights on nonmetal element doping effects on the physicochemical properties of graphitic carbon nitride, the optical properties of the samples were investigated in detail. The absorption spectra of CN, BCN, PCN, and FCN samples are demonstrated in Fig. 6(a). All samples show the typical absorption with a sharp light absorption band threshold, which results from the charge transfer from the valence band (VB) to the conduction band (CB) of the semiconductor. Pure g-C3N4 shows a sharp absorption band threshold at about 479 nm. After the doping process, BCN, PCN, and FCN samples show enhanced absorption in visible light region with a perceptible red-shift of the optical absorption edges. This phenomenon is very common for doping modifications of the semiconductors.Reference Li, Shen, Hong, Lin, Gao and Chen49,Reference Lan, Wang, Chen, Au and Yin50 The semiconductor photoexcitation strongly depends on the wave length of excitation light and the band gap of the semiconductor. The calculated band gap energies of CN, BCN, PCN, and FCN samples are in the inset picture of Fig. 6(a). The calculation of band gap energies is based on Eq. (1):
 $$\alpha h\nu = A{\left( {h\nu - {E_{\rm{g}}}} \right)^{\left( {n/2} \right)}}\quad ,$$
where α represents the absorption coefficient, h is the Planck’s constant, ν is the light frequency, and A is the energy-independent constant.Reference Cao, Che and Chen51 It should be noted that the value of n is determined by the type of optical transition of the semiconductor (n = 1 for direct transition and n = 4 for indirect transition).Reference Liang, Zhu, Liu, Luo, Tan, Jin and Zhou52 Because n value of graphitic carbon nitride is 4, the E g of samples can be determined by the tangent lines of (αhν)(1/2) versus (hν).Reference Ma, Tan, Jiang and Yu53 The band gap energy of CN is 2.59 eV, while the band gap energies of BCN, PCN, and FCN samples are 2.35, 2.53, and 2.47 eV, respectively. It’s confirmed that the B/P/F doping process can decrease the band gap energy and increase the light absorption region, which could result in higher photocatalytic activity.
(a) UV-vis absorption spectra of the as-prepared samples. The inset shows the band gap energies of CN, BCN, PCN, and FCN; (b) VB XPS of CN, BCN, PCN, and FCN; (c) Band gap structures of CN, BCN, PCN, and FCN.

The VB XPS of CN, BCN, PCN, and FCN samples are shown in Fig. 6(b). As observed in Fig. 6(b), the obtained VB maxima of CN is 1.7 eV, while the VB maxima of BCN, PCN, and FCN are 1.5, 1.6, 1.6 eV, respectively. Compared with g-C3N4 (1.7 eV), the VB position of BCN (1.5 eV) shifts up 0.2 eV and that of PCN and FCN shift up 0.1 eV. Based on the VB potentials and band gaps, the CB of CN, BCN, PCN, and FCN are estimated to be −0.89, 0.85, −0.93, and −0.87 eV, respectively. As we known, the potentials of VB and CB can determine the oxidizing and reducing ability of semiconductors. The band gap structures are shown in Fig. 6(c), and the negative shift of CB of PCN can make the electron more reductive.
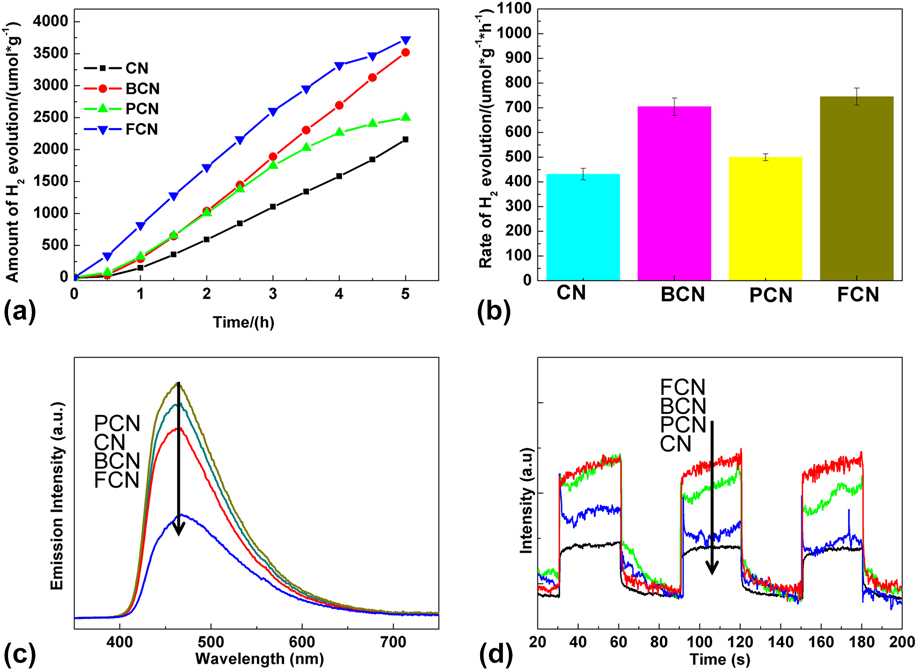
The photocatalytic activities of the as-prepared CN, BCN, PCN, and FCN samples were examined by photocatalytic H2 evolution under visible light irradiation (λ > 420 nm), using 10 vol% triethanolamine as a sacrificial reagent and 3 wt% Pt as a cocatalyst. In Fig. 7(a), there are clear differences in the H2 evolution amount for the as-prepared CN, BCN, PCN, and FCN samples. The H2 evolution amount of CN is determined as 2158 μmol/g in 5 h, while FCN has 3726 μmol/g and 1.72 times higher than pure g-C3N4. The BCN possesses the 3522 μmol/g H2 evolution amount. The H2 evolution amount of PCN (2500 μmol/g) is still higher than that of the pure g-C3N4 (2158 μmol/g). It is noteworthy that the H2 evolution amounts of all the nonmetal doped g-C3N4 are higher than those of the pure g-C3N4, directly certifying the positive improvements of the B/P/F doping in the photocatalytic activities. The order for the amount of photocatalytic H2 evolution is FCN > BCN > PCN > CN. Figure 7(b) shows the photocatalytic H2 evolution rates for the CN, BCN, PCN, and FCN samples under visible light irradiation. The rates for CN, BCN, PCN, and FCN samples are 431.6, 704.5, 500.0, and 745.2 μmol/(g h), respectively.
(a) The amount of H2 evolution of the as-prepared samples under visible light irradiation (λ > 420 nm); (b) Rate of photocatalytic H2 production over the CN, BCN, PCN, and FCN under visible light irradiation (λ > 420 nm); (c) PL spectra of CN, BCN, PCN, and FCN samples; (d) Transient photocurrent density versus the time of CN, BCN, PCN, and FCN samples.

The PL spectroscopy is a well-known technique to study both the interface charge carrier transfer and the electron–hole pair recombination. It was reported that the PL resulted from the following process. Light is absorbed by the photocatalyst and the excess energy is given to electrons, leading to the electrons within the photocatalyst to transfer into permissible excited states. Afterward, electrons return to the equilibrium states, and light is emitted.Reference Xing, Liu, Yu, Zhang, Cao, Yao, Ren, Jiang and Zhao54,Reference Zou, Zhang, Liu, Wang, Sun, Wu, Deng, Tang, Gao and Dong55 Figure 7(c) shows that all photocatalysts have similar emission trends centered at about 460 nm. When F was doped in g-C3N4, the intensity of this emission peak drops significantly. This is ascribed to the promoted electron relocalization on the surface terminal after doping.Reference Zhu, Ren and Yuana24,Reference Wang, Maeda, Chen, Takanabe, Domen, Hou, Fu and Antonietti56 This indicates that the B and F doping lead to an improved separation efficiency of the photoinduced electron–hole pairs under visible-light illumination. The PL peak intensity was in the order of PCN > CN > BCN > FCN, indicating that the order of the electron–hole recombination rate were PCN > CN > BCN > FCN. However, the electron–hole recombination order was not consistent with the photocatalytic activity. It was reported that PL spectra are also sensitive to energy levels of the exciton structures, impurities, and crystalline quality.Reference White, Williams, Porteous and Hilsum57,Reference Yu, Jiang, Wu, Gan, Zhu, Hu and Chu58 According to the above literature, it was considered that the inconsistency of PL intensity and phtocatalytic activity might result from the relative vacancy concentration.
The photocurrent responses of CN, BCN, PCN, and FCN samples under visible light were performed to further identify the interfacial charge transfer and recombination rates occurring in the three-electrode systems. As observed in Fig. 7(d), the doped g-C3N4 photocatalysts exhibit higher photocurrent density than the pure g-C3N4, indicating that the nonmetal element doping can more efficiently increase the interfacial charge transfer. The FCN produces a higher photocurrent than BCN, PCN, and CN samples under the same condition, suggesting that it has lower recombination rate and the superior photocatalytic activity enhancement. The intensity of photocurrent density is in the following order: CN < PCN < BCN < FCN, which is consistent with the photocatalytic H2 evolution activity.
Generally, the photocatalysis process is believed to be of three steps: the photoexcitation of semiconductor, the separation and transfer of photoinduced charge carriers, and the reaction between the charge carriers and reactant molecules. The bandgap structure of the semiconductor is the main factor for photoexcitation. The nonmetal elements (B, P, and F) have an influence on the intrinsic electronic and band structure modulation of g-C3N4. The CB and VB potentials of the BCN are −0.85 and 1.5 eV, respectively, while those of PCN are −0.93 and 1.6 eV and FCN are −0.87 and 1.6 eV [Fig. 6(c)]. The B/P/F doped g-C3N4 with a narrow band gap would harvest more visible-light photons and produce more photogenerated carriers than pure g-C3N4. The negative shift of the CB of PCN can make the electron more reductive.
After photoexcitation, the photocatalytic activity depends on the competition between photogenerated carrier recombination and trapping. The low recombination rate can facilitate the separation of electron–hole pairs. From the transient photocurrent response under visible light of the as-prepared samples, it is observed that the FCN shows the fastest photogenerated electron transfer.
Additionally, it can be known that the large BET specific surface area is important to photocatalytic activity. From Fig. 4(a), it can be found that the specific surface areas of BCN, PCN, and FCN are 40.3, 43.0, and 41.4 m2/g, respectively, which are very close to CN (45.1 m2/g). Thus, specific surface areas are not the critical factor to determine the catalytic performances of the photocatalysts.
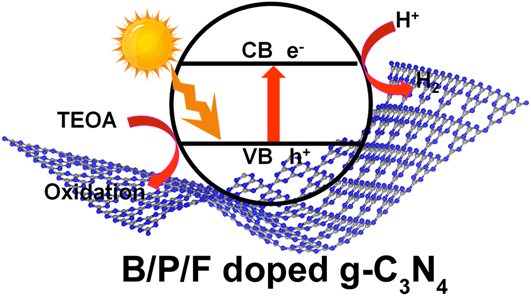
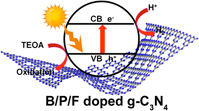
According to the above results, the mechanisms for the photocatalytic H2 production by BCN, PCN, and FCN are proposed in Fig. 8. When BCN, PCN, and FCN are irradiated by light with energy larger than the band gap, the excited charges are generated, separated, and migrated to the surface. Then the photogenerated charge carriers transfer to the catalyst surface. The electrons reduce H2O to generate H2. At the same time, the holes oxidize the TEOA to restrain the charge recombination and thus promote the photocatalytic activities.
Proposed reaction mechanism for photocatalytic H2 evolution on BCN, PCN, and FCN.

IV. CONCLUSIONS
In this contribution, we have successfully fabricated B, P, and F doped g-C3N4 by a facile one-step heating method and investigated the different effects of the dopants on the electronic structures and band gaps. The photocatalytic H2 evolution was in the order of FCN > BCN > PCN > CN. The B/P/F doping decreases the band gap of g-C3N4, enlarges the optical absorption range, and thus produces more photogenerated carriers, which lead to the increase of photocatalytic H2 evolution activity. Compared with the P dopant, the B and F doped g-C3N4 shows the more decreased band gap, faster photogenerated carrier separation, and thus better photocatalytic performance.
ACKNOWLEDGMENTS
This work was financially supported by National 863 plans projects (2015AA03A401), the Natural Science Foundation of Jiangsu Province (BK20161392), and National Natural Science Foundation of China (21670182, 21573105, and 21707066).