1 Introduction
This paper addresses the issue of comparing a defined-benefit (DB) pension scheme with a defined-contribution (DC) pension scheme. Most countries have one or both of these schemes in place which provide employer-sponsored retirement benefits. The key difference between DB and DC is that DB embeds intergeneration solidarity, whereas DC does not. Under DB, retirement benefits in terms of final pension are accumulated, while contribution is a fraction of wage, regardless of age. However, since the present value of the final pension increases with age, the younger workers are indirectly subsidizing the old. Negative shocks to the financial position of the fund are mostly borne by the younger generation, who have the prospect of receiving the same solidarity when they are older. This mechanism is best described as intergenerational solidarity. Under DC, where workers contribute to an individual retirement fund, this mechanism is absent. Given the existence of both systems, in some countries occurring side by side, the subject of this paper is the value of intergenerational solidarity, as measured by the minimum funding ratio under which an individual would still voluntarily join the DB fund.
From existing research, we know that intergenerational solidarity is welfare enhancing for participants, given an initially sound financial position of the DB pension fund. (The financial position of a DB fund is usually expressed as the funding ratio, assets divided by liabilities.) Bodie et al. (Reference Bodie, Marcus and Merton1985), Cui et al. (Reference Cui, de Jong and Ponds2006), and Gollier (Reference Gollier2008) analyze the value of intergenerational transfers and find that the embedded solidarity in funded pension schemes is welfare enhancing. Risk sharing between generations creates a diversification opportunity that is not available elsewhere. Each generation pays relatively more when young, but receives insurance against downside shocks in later life. In this paper, we take the existing insights one step further by computing the minimum nominal funding ratio of a DB pension fund at which a 25-year old would only just join if given the choice between DB and DC. The relevance for policymakers and regulators is that the results provide a baseline result on the funding ratios below which intergenerational solidarity might come under pressure. A DC pension scheme can be seen as a fall back option for societies that do not want to keep the DB funds up and running. As such, the resulting funding ratios provide a relevant benchmark to evaluate DB pension fund attractiveness.
The method of analysis in this paper is Monte Carlo simulation. This has the disadvantage of there being no analytical expressions, but it can incorporate the typical ingredients of a DB pension fund, and allows for evaluation with different utility functions. The simulation approach also mimics the Asset Liability Management (ALM) modeling approach used by most pension funds in the Netherlands (see Boender, Reference Boender1997). Based on a real-life ALM model, Boender et al. (Reference Boender, van Hoogdalem, van Lochem and Jansweijer2000) compare DB and DC in terms of riskiness of retirement benefits, given a specified pension ambition. Our analysis differs in that we compute indifference funding ratios for several utility specifications.
The rest of this paper proceeds as follows. Section 2 presents the model used for simulating the DB pension fund as well as the method used for comparing DB and DC. Section 4 presents the nominal DB funding ratios for which DC and DB have equal utility and also the average contribution level that makes DB and DC participants equally well-off. Section 5 studies a reverse question by computing the fixed level of contribution necessary in a DC scheme to achieve equal utility to a DB scheme. Section 6 concludes.
2 The DB pension fund
The DB pension fund that we consider in this paper is a private, employer-funded pension scheme where participants pay a fraction of wages as contribution, and receive a yearly increase in future pension benefits of 1.75% of their average wage. The accrual of 1.75% is such that, at retirement, the benefits accrue to 70% of final wage.Footnote 1 A level of 70% represents the expectation of current pension plan participants, seen as a target level of pension benefits that allows a continuation of lifestyle beyond retirement. The embedded solidarity in the DB pension contract modeled here is seen in the fact that the contribution level is not age-dependent: older participants are closer to retirement than younger ones, but still pay the same contribution as a fraction of wages. Thus, the younger generation ‘sponsors’ the older. The benefits of this time-diversification effect are the subject of study in this paper. We should note, however, that our comparison of DB and DC does not take into account the added benefits of portability in DC, and default risks in DB. The portability of a DC pension compares favorably to DB, which implictly taxes an employee who leaves the pension plan before the age of 40 (approximately). That has a negative effect on labor mobility. Also, we disregard the effect of DB plans being vulnerable to the default of a sponsoring company. If such a risk materializes, active participants suffer from the lack of new employees that can provide the time-diversifcation that, as we show in this paper, is quite valuable.
To avoid aging effects, we assume that the age of pension fund participants exactly matches that of the latest 1995–2000 survivor table from the Dutch Society of Actuaries. The number of participants in the pension fund is equal to the sum of those aged 25 and over in the survivorship table, divided by 1,000, which gives 544,000 participants, of which 160,000 are retired and 384,000 are active. The wage for an active participant (aged under 65) is equal to the average income per active worker in the Netherlands, as supplied by the Netherlands Bureau of Statistics (CBS). The average wage amounts to € 29,300 in 2007, the latest year for which data are available.Footnote 2 The wage increases with the yearly inflation rate. The initial sum of wages is € 10.96 bn.
Our economy has a constant inflation rate of 2%, a nominal risk-free interest rate of 4%, and normally distributed stock return with a mean return of 7% and standard deviation of 18%. The inflation rate is based on the ceiling of the ECB's inflation target of 2%. The risk-free rate is somewhat lower than for example the US T-bill long-term return of 5% (see Siegel, Reference Siegel2002; Hoevenaars et al., Reference Hoevenaars, Molenaar, Schotman and Steenkamp2008), but such a return is not riskless in the sense of a fixed rate of return. The mean stock return of 7% implies an equity premium of 3%, which is the same as in Van Rooij et al. (Reference Van Rooij, Siegmann and Vlaar2004) and Lucas and Zeldes (Reference Lucas and Zeldes2006). Cui et al. (Reference Cui, de Jong and Ponds2006) use an equity premium of 4% and volatility of 20%. Note that the current setup does not assume mean reversion in stock returns. The baseline investment policy for the DB fund is assumed to be 50% stocks and 50% bonds, which is a representative portfolio composition for pension funds. We analyze the sensitivity of the results to alternative asset mixes. The funding ratio of the DB pension fund is defined as assets divided by the liabilities.
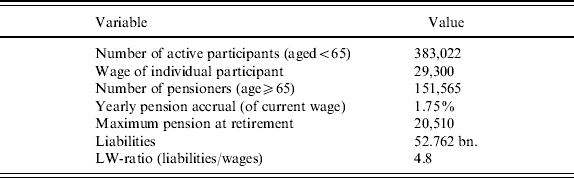
The present value of liabilities is computed using a fixed 4% discount rate. Thus, the resulting funding ratio (assets divided by liabilities) is a nominal funding ratio. This conforms to Dutch and US regulatory practice, where pension funds have to report nominal funding ratios, and are called under- or overfunded in terms of the nominal funding ratio. Sensitivity to market valuation of liabilities and real funding ratios are separately examined in Section 4.3. The initial value for the liabilities in the simulation is € 52.7 bn, computed as the actuarial value of total pension benefits for all members of the pension fund. Given our stationary setup (population equal to mortality table), this is by definition equal to the difference between pension payments and the value of new pension rights, divided by 0.04. Table 1 summarizes the parameter values for our economy and the properties of the DB pension fund.
Pension fund setup
This table shows the values of the financial variables used for the modeled pension fund, using a nominal discount rate of 4%. The survivor table used for the composition of participants per age is the Dutch survivorship table 1995–2000, as published by the Dutch Actuarial Society.

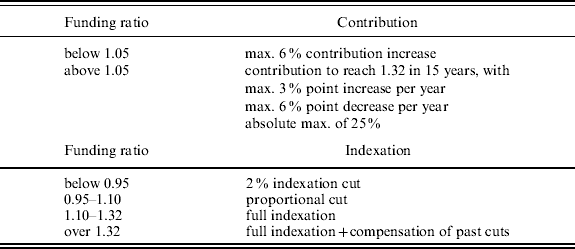
The funding policy prescribes how contribution is set and indexation cuts are applied, given the financial situation of the pension fund. The policies are summarized in Table 2. The DB plan includes a form of conditional indexation, that is the inflation correction (here 2%) is only applied to the pension rights when the funding ratio is high enough.
Funding policy rules
This table shows contribution and indexation rules as a function of the nominal funding ratio.

Note that DB pension plans do not necessarily have constant contribution levels across age cohorts. For example, one can imagine DB plans with cohort-specific accounts, while retaining some form of intergenerational solidarity, see Teulings and De Vries (Reference Teulings and De Vries2006). This is beyond the scope of the current paper, however.
2.1 Simulation setup
The simulation of economic variables is done in the following way. First, we define two asset returns in a vector x t as

where x 1,t is the risk-free rate and x 2,t is the return on stocks. In the simulation, both are drawn independently from a normal distribution, with parameter values as outlined above. These two variables are the only source of uncertainty in the model, since we have stationary demographic dynamics and the inflation rate is assumed fixed. Moreover, in the baseline setup the interest rate is fixed and only the stock return is simulated. Section 4.3 introduces uncertainty into the interest rate, to evaluate the impact on the outcomes of market valuation with stochastic interest rates. The details are discussed in Section 4.3.
With a realization of x t for t=1 to 40, the assets of the pension fund are updated by

where A t are the assets, α is the fraction in stocks, PP t is the pension payments, and C t the contributions in period t. Pension payments are influenced by the indexation level I t, which, together with contributions C t, comprises the funding policy of the DB pension fund. Appendix A contains a complete description of the funding policy rules used in the simulation. The policy rules for indexation and contribution are piecewise linear functions of the nominal funding ratio (total assets, A t, divided by liabilities L t), where specific levels of the funding ratio form the ‘kinks’ where the marginal impact of the funding ratio on policy changes (see also Table 2).
The investment policy of the DB pension fund is simply a fixed fraction, α, of assets. For the individual saver, we consider a linear investment rule in terms of the time to retirement, see Section 3.
Given the initial level of liabilities, described above, liabilities evolve as

where r is the interest rate, I t the indexation cut in year t, NR t the new pension rights, and PP t the pension payments. Equation (3) is almost a definition: new pension rights add to liabilities, while pension payments are paid out of them. We take indexation to impact all participants (active and retired) equally, proportional to their share of pension liabilities, so it multiplies with L t. The same holds for interest income, so that L t grows with the interest rate.
Given the evolution of assets and liabilities, the simulation is easily performed by generating for each period a new stock return x 2,t, computing the new funding ratio and the new values for the policy decisions on contribution and indexation. This is a typical simulation setup for asset/liability management and creates a representative set of scenarios for contribution, acquired pension rights at retirement, and funding ratios.
3 Comparison of DB and DC
To make an even comparison of DB with DC, our primary method of comparison is that of matching contributions. The first method is a one-on-one match of every contribution payment by the DB participant at each period in each scenario. This gives the most direct comparison of how the pay-off between DC and DB compares, since the contribution paths are exactly similar. The second method assumes DC contributions are a fixed percentage of wages, equal to the average fraction paid by the DB participant over all periods and scenarios. Thus, the second method is more typical of how participants in a DC scheme would contribute, namely through a fixed fraction of their wage. We assume that the DB and DC participants live from 25 to at least 65, and that they cannot switch pension plans or change employer. This fits with our aim of giving a clean comparison of what utility the participants can derive from a pension plan. In practice, a participant to a DB scheme will incur a loss when switching employers. At the same time, a typical participant of a DC scheme might lack the discipline to contribute significantly to his pension plan when young, which is automatic in a DB scheme.
With respect to the investment policy, we assume a fixed mix for the pension fund, that is a fixed fraction of wealth is held in stocks. For the DC scheme, we want to take lifecycle considerations into account. For a given utility specification, it is possible to optimize over the investment strategy (see Gollier, Reference Gollier2005; Siegmann, Reference Siegmann2005). However, individual savers do not seem to be good optimizers (e.g. Benartzi and Thaler, Reference Benartzi and Thaler2001). Therefore, in the DC scheme we just allow for a simple parameter that specifies a time-dependent decision rule on the fraction α invested in stocks. Specifically, consider the following linear decision rule for the asset mix with parameter t 0 as

where t is the age of the DC participant and t 0 is the age at which the fraction in stocks starts decreasing. In addition, α(t) is limited to lie between 0 and 1. Equation (4) describes an age-dependent asset mix with an initial fraction of 1, and t 0 the number of years before retirement that the stock investment is decreased by 1/t 0 per year. At retirement (65), the fraction is 0. The decision rule in (4) reflects an investment policy that has a high allocation to stocks when the participant is young and the wage income is a relatively high part of lifetime income. When the participant is older, the allocation to stocks is low, as the pension wealth is high relative to the remaining lifetime wages. This is the most basic representation of lifecycle investing. In the following, we consider values for t 0 of both 10 and 20 years, representing a more (10) and less (20) aggressive investment strategy towards retirement. Note that the linear investment rule in (4) is the same as used in Boender et al. (Reference Boender, van Hoogdalem, van Lochem and Jansweijer2000) and Gollier (Reference Gollier2008) for an individual investor.
A final challenge is to make pension outcomes comparable, as the outcome of a DC plan is typically a sum of money, while a DB participant obtains a pension in terms of the fraction of final wage. We choose to convert the amount built-up by the DC participant to a pension in terms of final wage by dividing by the annuity cost of an indexed pension and then by final salary. For correctly comparing DB and DC outcomes, the annuity costs should reflect (i) the cost of purchasing an indexed pension, and (ii) the expected level of indexation cuts in the DB pension. The first requirement is easily met by computing an annuity cost at the 2% real interest rate. The second requirement is met by looking backwards at the average indexation cuts experienced by the DB participant. If we assume that future indexation cuts will match the historical average, we can multiply the annuity cost by the ratio of the average final DB pension over 0.7, the fully indexed pension level. Thus, an average DB pension of 63%, a 10% shortfall, is matched by a 10% cheaper annuity for the DC participant.Footnote 3 Note that the ultimate annuity cost is not the price of an available pension annuity, but the proxy for the implicit costs of the DB promise.
Differences between DB and DC plans that we do not consider are for example the administration costs (lower for DB) and portability (straightforward under DC, complicated under DB). We also leave out the issue of a sponsoring company of a DB plan going bankrupt, which complicates our analysis and is dependent on the legal treatment of a company pension plan. We assume a strict setup of entry and exit: individuals enter the DB and DC plan aged 25 and retire at 65. The way of computing the ‘final pension’ for DC members at 65 is not completely in accordance with empirically observed behavior, but it does make the pension outcomes comparable numerically, which is the main goal of this paper.
3.1 Measuring utility of pension outcomes
We use a utility function to map the range of pension outcomes from the Monte Carlo simulation to a risk-adjusted outcome. Three types of utility functions that are often used in the financial literature are considered: power utility, mean-shortfall, and mean-downside deviation.
The first utility function is power utility. Given a pay-off x, power utility is defined as

where γ is the coefficient of relative risk aversion. Relative risk aversion is constant since power utility is of the constant relative risk aversion (CRRA) family of utility functions. The power utility function is used abundantly in both theoretical and empirical research because of its attractive properties. Also, as pointed out by Campbell and Viceira (Reference Campbell and Viceira2002), the long-run behavior of the economy suggests that risk aversion cannot depend strongly on wealth. With respect to the level of relative risk aversion, Dalal and Arshanapalli (Reference Dalal and Arshanapalli1993) find a value of 1.3 based on the holdings of risky assets by US households, while Chiappori and Paiella (Reference Chiappori and Paiella2006) find a median value of 3 and average of 4.2 based on financial holdings of Italian households. In the results, we present outcomes for values of γ of 1, 3, and 5.
The second type, mean-shortfall is given by

where r, in this case, is the reference value of the level of final pension. Loss aversion boils down to penalizing realizations of x below r with a penalty of γ. This specification is a linearized version of that originally proposed by Kahneman and Tversky (Reference Kahneman and Tversky1979) and also used as such by Benartzi and Thaler (Reference Benartzi and Thaler1995). Kahneman and Tversky (Reference Kahneman and Tversky1979) estimate γ to be 2.25. In the results, we present outcomes for a value of 2.25 as well as 5.
The third type, mean-downside deviation is comparable to mean-shortfall, but gives more weight to larger shortfalls below the reference point by using a quadratic penalty specification

Downside deviation is proposed by Boender (Reference Boender1997) to use in a pension fund context and actively used in most ALM practices at pension funds in the Netherlands. Its widespread use by DB pension funds suggest that outcomes with downside deviation could be seen as most representative from the perspective of the pension fund sector itself. Also Sortino and Van der Meer (Reference Sortino and Van der Meer1991) give an economic rationale for using downside deviation as a risk measure in an investment context.
4 Results
This section presents the results of the simulation model in terms of the funding ratios that make a DB participant just as well off as a DC participant in terms of achieving equal utility. Hence, the higher the reported funding ratios, the less attractive a DB scheme is for an individual. The lower the reported funding ratio, the more attractive a DB scheme is. For example, a funding ratio below 100% indicates that the intergenerational benefits of the DB scheme are large, that is an individual would voluntarily join an (nominally) underfunded DB scheme.
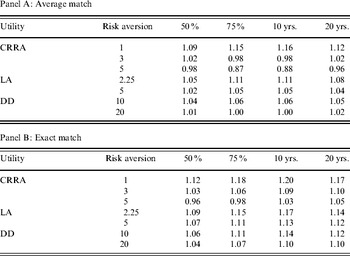
Based on 1,000 simulations, Table 3 shows the results for both exact and average matching of contributions, and four different stock investment choices for the DC saver. The indifference funding ratio (IFR) is computed using an iterative goal seeker procedure.
Nominal indifference funding ratios
This table shows the initial nominal DB funding ratios for which DB and DC have equal expected utility. The funding ratios displayed in the table are the initial funding ratios for the DB pension fund for which the corresponding DC scheme has equal expected utility. Panel A gives the outcomes when the average DB contribution is used as a fixed contribution under DC. Panel B gives the outcomes given an exact match in the DC scheme of DB contributions, at each time-period and scenario. The first column gives the utility function used, CRRA for a power utility function, LA for mean-expected shortfall, and DD for downside deviation. The second column gives the risk aversion parameter. The reference point for LA and DD utility is at the maximum level of pension benefits under the DB plan. Note that CRRA with a risk aversion of 1 is log utility. The third and fourth column give the outcomes for a static mix for DC of 50% and 75% stocks. The stock fraction for DB is 50% stocks everywhere. The last two columns give the outcomes for a stock fraction for DC that is 100% at the start, decreasing to 0 from 10 years and 20 years before retirement, respectively.

Panel A gives the results when the average contribution rate under DB is matched by the DC individual, panel B gives the results for exact matching of DB contributions by the DC participant.
Consider first the results in Panel A of Table 3. The indifference funding ratios vary between 0.87 and 1.16 for power utility, between 1.02 and 1.08 for expected shortfall, and between 1.00 and 1.06 for downside deviation. As the range of outcomes is greatest for power utility maximizers, the rest of the discussion will focus on those outcomes.
For all four investment variants, the funding ratios are decreasing in the level of risk aversion. This is as expected, as the guaranteed DB pension (minus indexation cuts) becomes more attractive at higher levels of risk aversion. In our setup, this translates to a lower funding ratio necessary to arrive at equal utility compared to DC.
In panel A, the best DC investment strategy is the one that gives the highest funding ratio; for example, a high funding ratio of, say, 1.2 means that the DC scheme is preferred for all DB funding ratios below 120%. Hence, we see that there is no clear dominating investment strategy for the DC scheme at all risk aversion levels. For the highest risk averse individual (CRRA 5), a fixed 50% mix is optimal, while for a low risk averse individual (CRRA 1), the 10-year lifecycle strategy gives the highest indifference funding ratio (1.16).
In panel B, the IFRs are all strictly higher than the corresponding values in panel A. This shows that the contribution policy followed by the DB fund, increasing contributions in bad times and decreasing them in good times, is also beneficial for a DC pension scheme. As in panel A, indifference funding ratios vary between 0.96 and 1.20, funding ratios are decreasing in the risk aversion parameters, the lowest funding ratio occurs for CRRA 5, and the highest for CRRA 1. For power utility, the 20-year investment policy dominates all others, a result also found by Boender et al. (Reference Boender, van Hoogdalem, van Lochem and Jansweijer2000). The most risk averse agent with power utility will demand a premium of between 5% and 17% funding ratio to participate in the DB fund. Otherwise, he can get a better deal in expected utility terms by choosing the DC plan.
As noted before, the inherent problem with exact matching of contributions is that it is very difficult, not to say impossible, for an individual worker to commit to a contribution policy comparable with that of a DB plan. In the DB plan, contributions are the highest when funding ratios, and past returns, are low. These are also the states in the economy where paying a high pension contribution is not attractive. Given the lack of self-discipline in pension savers, and the nature of most DC plans in practice, that is funded by a constant contribution percentage, panel B is difficult to regard as attainable, given the demonstrated lack of discipline regarding the way people save for their pension, see van Rooij et al. (Reference Van Rooij, Kool and Prast2007). That said, the funding ratios in panel B can be considered an upper bound to funding ratios that make a DC participant just as well of as a DB participant.
Finally, an important finding in Table 3 is that the average indifference funding ratio is close to 1.0. This strengthens the motivation of current regulatory practice in the Netherlands, where the new policy framework (the FTK) aims to prevent nominal funding ratios dropping below 100%. In the wording of this paper, we can interpret these objectives as ensuring that the DB fund remains attractive for new entrants, relative to a DC alternative. Although participation is mandatory, maintaining individual efficiency for each participant prevents intergenerational tensions within the pension fund. Such tensions might eventually lead to declining support for DB. Although a transition from DB to DC is not necessarily utility-decreasing from the perspective of an individual who is at the start of his career, it does threaten the financial soundness of existing DB funds. Given the existence of DB funds, it is natural to assume that regulators and policy makers are keen to protect the existing pension funds. Our analysis suggests such an interest is well-served by ensuring nominal funding ratios that are at least between 12% and 20% (nominally) overfunded, assuming the least risk averse participants should still prefer DB to DC.
4.1 Sensitivity to the asset mix
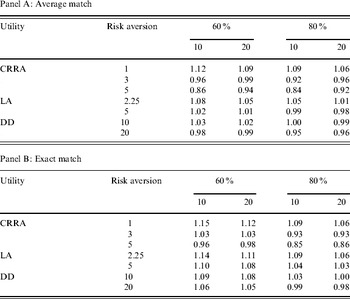
The comparison between DC and DB pension outcomes might be skewed towards DC since we can select ‘the best’ investment strategy for DC, that is we selected the 10- and 20-year periods based on the relative performance of DC. So, for a fair comparison we should also consider whether there is a better performing asset mix for the DB pension fund. This is done in Table 4, by using a 60% and 80% stock fraction for the asset mix of the DB fund.
Effects of a higher stock fraction in DB
This table shows the initial nominal DB funding ratios for which DB and DC have equal expected utility. The funding ratios displayed in the table are the initial funding ratios for the DB pension fund for which the corresponding DC scheme has equal expected utility. Panel A gives the outcomes when the average DB contribution is used as a fixed contribution under DC. Panel B gives the outcomes given an exact match in the DC scheme of DB contributions, at each time-period and scenario. The first column gives the utility function used, CRRA for a power utility function, LA for mean-expected shortfall, and DD for downside deviation. The second column gives the risk aversion parameter. The reference point for LA and DD utility is at the maximum level of pension benefits under the DB plan. Note that CRRA with a risk aversion of 1 is log utility. The third and fourth column give the outcomes for a static mix for DB of 60% stocks and for DC a policy of getting out of stocks 10 years and 20 years before retirement, respectively; also for the the last two columns but with 80% stocks in the DB pension fund.

Table 4 shows that with higher stock investment for DB, indifference funding ratios remain above the 100% nominal level for only the least risk averse agents. For the most risk averse participant (a relative risk aversion coefficient of 5), indifference funding ratios are between 0.85 and 0.98. For the least risk averse participants with log utility (CRRA 1), indifference funding ratios are between 1.06 and 1.15. Observing that the indifference funding ratios are increasingly smaller for the 60% and 80% asset mix, our analysis suggests that having a risky investment strategy has a large value for participants in a DB fund. This is in concordance with the findings of Cui et al. (Reference Cui, de Jong and Ponds2006) and Boender et al. (Reference Boender, van Hoogdalem, van Lochem and Jansweijer2000), who also find that intergenerational transfers are most valuable when the investment mix of the pension funds is the most risky. The diversification benefits provided by the intergenerational solidarity are used to limit the downside risk, while gaining from the upside potential of risky investments. An individual saver as in DC, lacks this diversification opportunity; an effect that is more pronounced in riskier DB investment policies.
A second explanation is the fact that a DB pension fund has an existing pool of assets, while an individual saver starts with an empty fund. Thus, a young participant profits to a greater extent from the higher expected return from the riskier asset mix.
4.2 Sensitivity to the equity premium
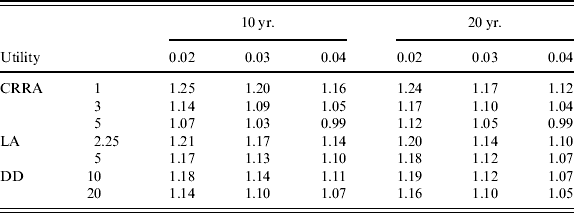
The results might be sensitive to the assumed size of the equity premium. Table 5 presents indifference funding ratios for an equity premium of 2%, 35, and 4%, respectively.
Sensitivity to the equity premium
For three different levels of the equity premium, this table shows the initial DB funding ratios for which DB and DC have equal expected utility. The funding ratios displayed in the table are the initial funding ratios for the DB pension fund for which the corresponding DC scheme has equal expected utility. The default equity premium of 0.03 corresponds to a 7% yearly stock return. Investment policy for the DC scheme is 100% equity, linearly decreasing to 0% at retirement in the last 10 (columns 3–5) or 20 years (columns 6–8) before retirement. Exact matching of DB contribution is used for the contribution policy under DC.

Across the board, the indifference funding ratios in Table 5 are decreasing in the equity premium, suggesting a higher equity premium increases the relative performance of DB, and vice versa. Looking at the 20-year DC investment policy, we see that for the equity premium of 4%, indifference funding ratios are between 0.99 and 1.12. For the 2% equity premium, they are between 1.12 and 1.24.
As in the previous subsection, the sensitivity of the results to the equity premium confirms previous research, that is intergenerational diversification is most valuable in the context of risky investing. The intuition is that the participant of a DB pension fund profits from the equity premium right from the start of his working life, through the existing asset value of the fund. In contrast, the individual saver does not earn the equity premium when young, when his retirement fund has only little asset value. Thus, the value of the intergenerational transfers in a DB pension fund are increasing in the size of the equity premium, as the excess return on existing assets (and buffer) is shared with all generations within the fund.
4.3 Market valuation of liabilities and real funding ratios
Until now we have assumed a fixed risk-free rate, that represents both the bond return as well as the discount rate for the pension liabilities. However, many countries have adopted a fair value approach to value pension liabilities. Market valuation uses market interest rates with matching maturities for discounting future pension payments and providing a ‘market value’ of the current liabilities. To incorporate market valuation into our model, we make the risk-free interest stochastic, having a normal distribution around the mean of 4%, with a standard deviation of 1%. Assuming a duration of the liabilities of D, we model a bond return, y t, as being 4% plus D times the change in the riskfree rate; that is

where x t,1 is the short-term interest rate, as in Equation (1).
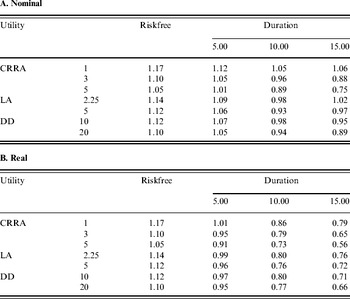
The resulting long-term bond return is then used as the return on the bond portfolio and as the discount rate for the liabilities. This approach is similar to the construction of the liability return series in Hoevenaars et al. (Reference Hoevenaars, Molenaar, Schotman and Steenkamp2008). The resulting minimum funding ratios are shown in Table 6, for durations of 5, 10, and 15 years.
Market valuation of liabilities
This table shows the minimum funding ratios for a DB plan that gives participants equal utility as a DC plan, when the pension liabilities in the DB plan are discounted at a stochastic interest rate. The discount rate is equal to 5, 10, or 15 times the change in the long-term interest rate, itself a normal distribution with mean 4% and standard deviation 1%. It is also equal to the return on the bond portfolio, so that a pension fund with 100% in bonds is fully matched and hedged against interest rate changes. The third column lists the outcomes for the baseline scenario as shown in Table 3, for the 20-year rundown period for DC a 50% stock fraction for DB, and exact matching of contributions. Columns 4 to 6 list the outcomes for different interest rate durations of the liabilities and the bonds. Panel B lists the results in terms of minimum real funding ratios, obtained by dividing the nominal ratios in panel A by 1.02-D, where D is the duration of the liabilities (zero for the riskfree setup).

The table shows that the DB plan becomes more attractive under stochastic interest rates and bond returns. The effect is stronger for longer durations. The intuition is that, although DB funding ratios and contributions become more volatile, it has mostly a large negative impact on the annuity costs for a DC participant. A stochastic interest rate leads to extra risk at retirement, when the monetary outcome of the plan is converted to an annuity.
Panel B in Table 6 lists the minimum funding ratios in real terms, adjusted for 2% inflation. These are obtained by dividing by 1.02D, where D is the duration of the liabilities. Real funding ratios are used in some countries, such as in the UK, and represent the fraction of total liabilities that is covered in real terms. The results show that minimum real funding ratios for a liability duration of 15 years, which is the most common for pension funds, lie between 0.56 and 0.79.
5 Indifference contribution levels
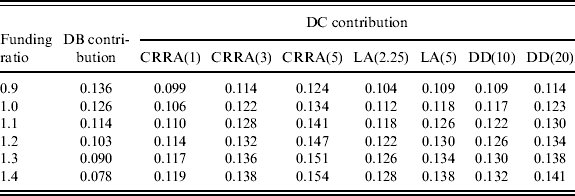
Given an initial funding ratio of a DB pension fund, we now solve for the contribution rate under DC that gives equal utility. We measure the value of the intergenerational solidarity inherent in DB by the difference in average contributions. Table 7 lists the results, where again an iterative goal seek procedure was used to find the contribution level that results in equal utility for DC and DB.
Iso-utility levels of contribution
This table shows the levels of average pension contribution, as a percentage of wages, that give equal utility for DC and DB. The first column gives the initial funding ratio in nominal terms of the DB pension plan. The second column gives contribution in the DB plan for the initial funding ratios in the first column. For three different levels of risk aversion, the third to fifth columns give the average contribution for the DC participants that are necessary to achieve equal utility as in the DB plan. The investment policy in the DC scheme is the 20-year policy.

As expected, the average contribution rate for DB is decreasing in the initial funding ratio of the fund, from 13.6% at a funding ratio of 0.9 to 7.8% at a funding ratio of 1.4. The average contribution in the DB plan roughly decreases by one percentage point for every 10% point increase in the initial funding ratio. In contrast, the average contribution under DC increases markedly with every increase in the initial DB funding ratio. The most risk averse individual, with relative risk aversion of 5, achieves equal utility by paying a 12.4% contribution rate at the lowest DB funding ratio, to 15.4% at a DB funding ratio of 1.4.
Another way of interpreting the results in Table 7 is that for a well-funded DB pension plan with a funding ratio of 1.3, a DC plan with equal expected utility needs to have a contribution rate that is 2.7% to 6.1% points higher, depending on the risk aversion of the participant. For a DB fund that is only barely solvent (funding ratio of 1), the comparable DC contribution rate is between 2% lower and 0.8% higher. Hence, a practical conclusion of this analysis is that for employers who consider switching from DB to DC, retaining equal expected utility for employees, is quite expensive with high funding ratios of the DB fund. At low funding ratios, however, the least risk averse participant could lower their average pension contribution by switching to DC, while still increasing the expected utility their pension.
6 Conclusions and discussion
In this paper, we have simulated a defined benefit (DB) pension fund where the only uncertainty is given by the returns on the equity investment of the fund. Set up in real terms with fixed population dynamics (no aging), the modeled stationary pension fund is the most simple representation of the essence of DB pension funding. The simulated contribution paths for the individual DB participant are matched by the individual contributions to a DC scheme in which contributions are paid and invested in stocks and bonds. Given both matches in the average contribution rate as well as an exact match, the resulting utility of the pension outcome are evaluated using three different utility specifications. The results are cast in the initial DB funding ratios that make the DB and DC participant equally well-off.
Overall, our results are in line with previous research, e.g. Boender et al. (Reference Boender, van Hoogdalem, van Lochem and Jansweijer2000), Cui et al. (Reference Cui, de Jong and Ponds2006), and Gollier (Reference Gollier2008), who find sizable welfare gains stemming from the intergenerational transfer implicit in the DB pension fund. The value of intergenerational risk sharing is increasing in the fraction invested in equities and in the equity premium. Both effects are due to the fact that a participant of the DB fund profits from the equity premium throughout his active working life, while an individual saver starts with an empty retirement fund.
In the base case, we find minimum acceptable funding ratios that lie between 0.96 and 1.20. Above a funding ratio of 1.20, the DB pension fund is attractive for all prospective participants. Below 0.96, even the most risk averse individual would rather not join, if given the choice. Between 0.96 and 1.20, the benefits for an individual to join the DB pension fund depends on his risk aversion, as well as the contribution and investment policy he can commit to in managing a private retirement fund. Given the documented difficulties that laypersons have in managing financial wealth, the present analysis suggests that a minimum acceptable funding ratio for a representative worker would be closer to 0.96 than to 1.20.
An analysis of the required contribution to achieve equal utility reveals that for a funding ratio of 1.3, which is the approximate regulatory target funding ratio for Dutch pension funds, the contribution rate for DC needs to be 2.7% to 6.1% points higher to achieve equal expected utility.
For the US, empirical research by Samwick and Skinner (Reference Samwick and Skinner2004) finds that 401(k) plans, which are of the DC type, have actually outperformed the DB plans in the period 1989–2001, for all but the most risk averse participants. Rather than disprove the present analysis, it clearly shows that the relative performance of DB and DC will ultimately depend on the realizations of wages, inflation, and asset returns. Our analysis suggests a more nuanced picture of how the two systems compare, with a crucial role for the initial funding ratio of the DB pension fund.
Finally, note that our comparison of DB with DC pensions does not take into account the portability of a DC pension versus the negative effect on labor market mobility of a DB plan. Also, participants to a DB plan can suffer badly from the default of a sponsoring company.
Appendix A: Dynamics and policy rules of the defined-benefit pension fund
Wages, pension rights and payments
Throughout the paper we assume a fixed level p of inflation, i.e. 2%. For a given level of inflation, the sum of wages, Wt, evolves as

where W 0 is simply the sum of wages for each employee in each age group.
In a DB pension fund, active employees acquire new pension rights as a fraction of their current wage. For a stable demographic pyramid as we have, the new pension rights in the first year of the simulation, NR 0, are given by

where 0.0175 reflects the build-up of pension rights over 40 years (70%/40), W i0 is the wage for the group of age i in year 0, and the final term is the actuarial cost of one unit of pension at 65 (retirement), for an individual aged i and given an interest rate r.
Pension payments are initially (in year 0 of the simulation) equal to the number of retirees times 70% of the wage at 65. In any year of the simulation, pension payments increase with indexation, which is a funding policy decision, together with the contribution level.
The funding policy
Given the level of pension payments PP t, assets A t, an interest rate of r, inflation of π, and total wages of W t, the level of contributions (as a fraction of wages) that keeps assets constant is given by

Given a target funding ratio of 132%, and a recovery period of 15 years, the unconstrained level of contributions needed to reach the target is given by

where δt denotes the current (nominal) funding ratio, i.e. assets divided by liabilities. To prevent overly large jumps in the contribution level (as a fraction of wages W t), contribution changes are constrained to 3% points upwards and 6% points downwards. Below the minimum funding ratio of 105%, upward jumps of 6% points are allowed. So, formally, we have

A final restriction is that contributions cannot be negative, and cannot exceed 25% of wages, i.e.

which is the level of contributions used in the evolution of pension fund assets, and subsequently matched by the individual in the DC pension plan.
Indexation cuts are a piecewise linear function of the funding ratio: below a threshold level of 95% funding, no indexation according to the inflation rate of π is granted. Between 95% and 110%, indexation is proportional to the funding ratio. Between 110% and 132%, full indexation is granted, but no prior cuts are compensated. Above 132%, prior indexation cuts are compensated for. Formally, this boils down to the following policy rule of indexation I t:

where p is the level of inflation and cumCut t is the cumulative indexation cut at time t, given by