

Introduction
The clay toolbox
Palaeoclimate reconstructions are derived from the interpretation of temporal series of various sedimentary proxies (e.g. fauna, flora, mineralogy, chemistry, isotopic composition). However, most palaeoreconstructions concern the evolution of temperatures, whereas reconstructions of humidity conditions are scarce. Besides pollen assemblages, clay minerals are the only proxy used to derive hydrological conditions (i.e. hydrolysis conditions during pedogenesis and runoff; e.g. Munier et al., Reference Munier, Deconinck, Pellenard, Hesselbo, Riding and Ullmann2021). Hydrolysis represents the principal chemical weathering process, and it consists of the attack of rocks by water of low ion content under medium pH (Chamley, Reference Chamley1989).
Sedimentary clay minerals can be a powerful climate proxy (Fig. 1) if they fulfil two main requirements (Fagel, Reference Fagel, Hillaire-Marcel and de Vernal2007). First, clay minerals must be detrital in origin, representing either primary (inherited clay) or secondary products (Chamley, Reference Chamley1989; Ruffel et al., Reference Ruffell, McKinley and Worden2002). Primary clay minerals are inherited from parental rocks by physical weathering. Most frequently, these clay minerals are represented by illite and chlorite. However, in principle, any clay mineral can be reworked into a rock that may then be eroded and weathered in a new cycle. Secondary clay minerals result from chemical weathering processes, mainly hydrolysis, occurring on the rock surface and in soils, formed by progressive transformation of a mineral precursor (i.e. silicate mineral into smectite) or by a recombination of ions in a confined environment (i.e. kaolinite neoformed from Al-rich rocks). Second, clays must not be significantly altered by burial diagenesis.
The clay toolbox to obtain past climatic information from detrital clay minerals (modified from Fagel, Reference Fagel, Hillaire-Marcel and de Vernal2007). The numbers indicate different steps of the sedimentary cycle. (1) Physical weathering delivers primary clay minerals (typically illite and/or chlorite) by mechanical disaggregation of parental rocks outcropping in the watershed. (2) Chemical weathering produces secondary clay minerals in soils either by transformation of primary minerals (smectite) or neoformation by recombination of cations (kaolinite). Weathering products are eroded and transported by rivers (3), wind (4) or glaciers (5) to the adjacent sedimentary basin (i.e. a lake or an oceanic basin). The weathering products are carried by underwater currents and settle down as a sedimentary deposit (6) at the bottom of the water column when the current velocity decreases. Sedimentation causes partial separation of clay minerals according to particle size. In addition, authigenic clay minerals may be formed by hydrothermal or volcanic activity at the ocean floor (7).

In most cases, the geochemical signature of the clays allows us to distinguish between detrital clay minerals of continental origin and authigenic clays formed by chemical precipitation from a saturated solution under surface conditions (Deocampo et al., Reference Deocampo, Behrensmeyer and Potts2010) or related to hydrothermal circulation (Alt & Jiang, Reference Alt and Jiang1991; Fagel et al., Reference Fagel, André, Chamley, Debrabant and Jolivet1992a; Inoue, Reference Inoue and Velde1995). The influence of diagenesis can be detected through the progressive evolution of clay mineral assemblages over burial depth (Dunoyer de Segonzac, Reference Dunoyer de Segonzac1969; Perry & Hower Reference Perry and Hower1970; Peacor, Reference Peacor and Busek1992; Kemp et al., Reference Kemp, Merriman and Bouch2005), which results in a simplified mineral assemblage dominated by illite and/or chlorite (e.g. Chamley, Reference Chamley1989; Meunier, Reference Meunier2006).
Establishing climate input in detrital sedimentary clays is best done by identifying the source areas and the principal transport agents. The mineralogical and geochemical (trace elements and radiogenic isotopes) composition of the sedimentary clays may be compared with the average composition of clays from the adjacent surroundings to identify the main continental source areas (Fagel et al., Reference Fagel, André and Debrabant1997a, Reference Fagel, Innocent, Gariépy and Hillaire-Marcel2002, Reference Fagel, Hillaire-Marcel, Humblet, Brasseur, Weis and Stevenson2004), which also enables indirect identification of transport agents (e.g. Fagel et al., Reference Fagel, Innocent, Stevenson and Hillaire-Marcel1999). This combined approach was described in Fagel (Reference Fagel, Hillaire-Marcel and de Vernal2007).
Sedimentary material
From the 1960s, down-core variations in marine clay mineral assemblages have been interpreted in terms of changes in the climate conditions prevailing in the continental source areas (Warr et al., Reference Warr2022) and have been widely used to reconstruct palaeoclimates (e.g. Millot, Reference Millot1970; Singer, Reference Singer1984; Chamley, Reference Chamley1989). The clay mineral-derived proxy was set from the latitudinal, climate-driven clay mineral distribution trends observed in deep-seafloor sediments of the Pacific Ocean (Griffin & Goldberg, Reference Griffin, Goldberg and Hill1963), the Atlantic Ocean (Biscaye, Reference Biscaye1965; Petschick et al., Reference Petschick, Kuhn and Gingele1996), the Indian Ocean (Kolla et al., Reference Kolla, Henderson and Biscaye1976) or even worldwide (e.g. Griffin et al., Reference Griffin, Windom and Goldberg1968; Rateev et al., Reference Rateev, Gorbunova, Lisitzyn and Nosov1969; Windom, Reference Windom1976). Later, the relationship between clay minerals and seafloor bathymetry emphasized the impacts of intermediate and/or deep oceanic circulation on the distribution of detrital clay minerals in surface sediments (Petschick et al., Reference Petschick, Kuhn and Gingele1996; see Fagel, Reference Fagel, Hillaire-Marcel and de Vernal2007 for a review).
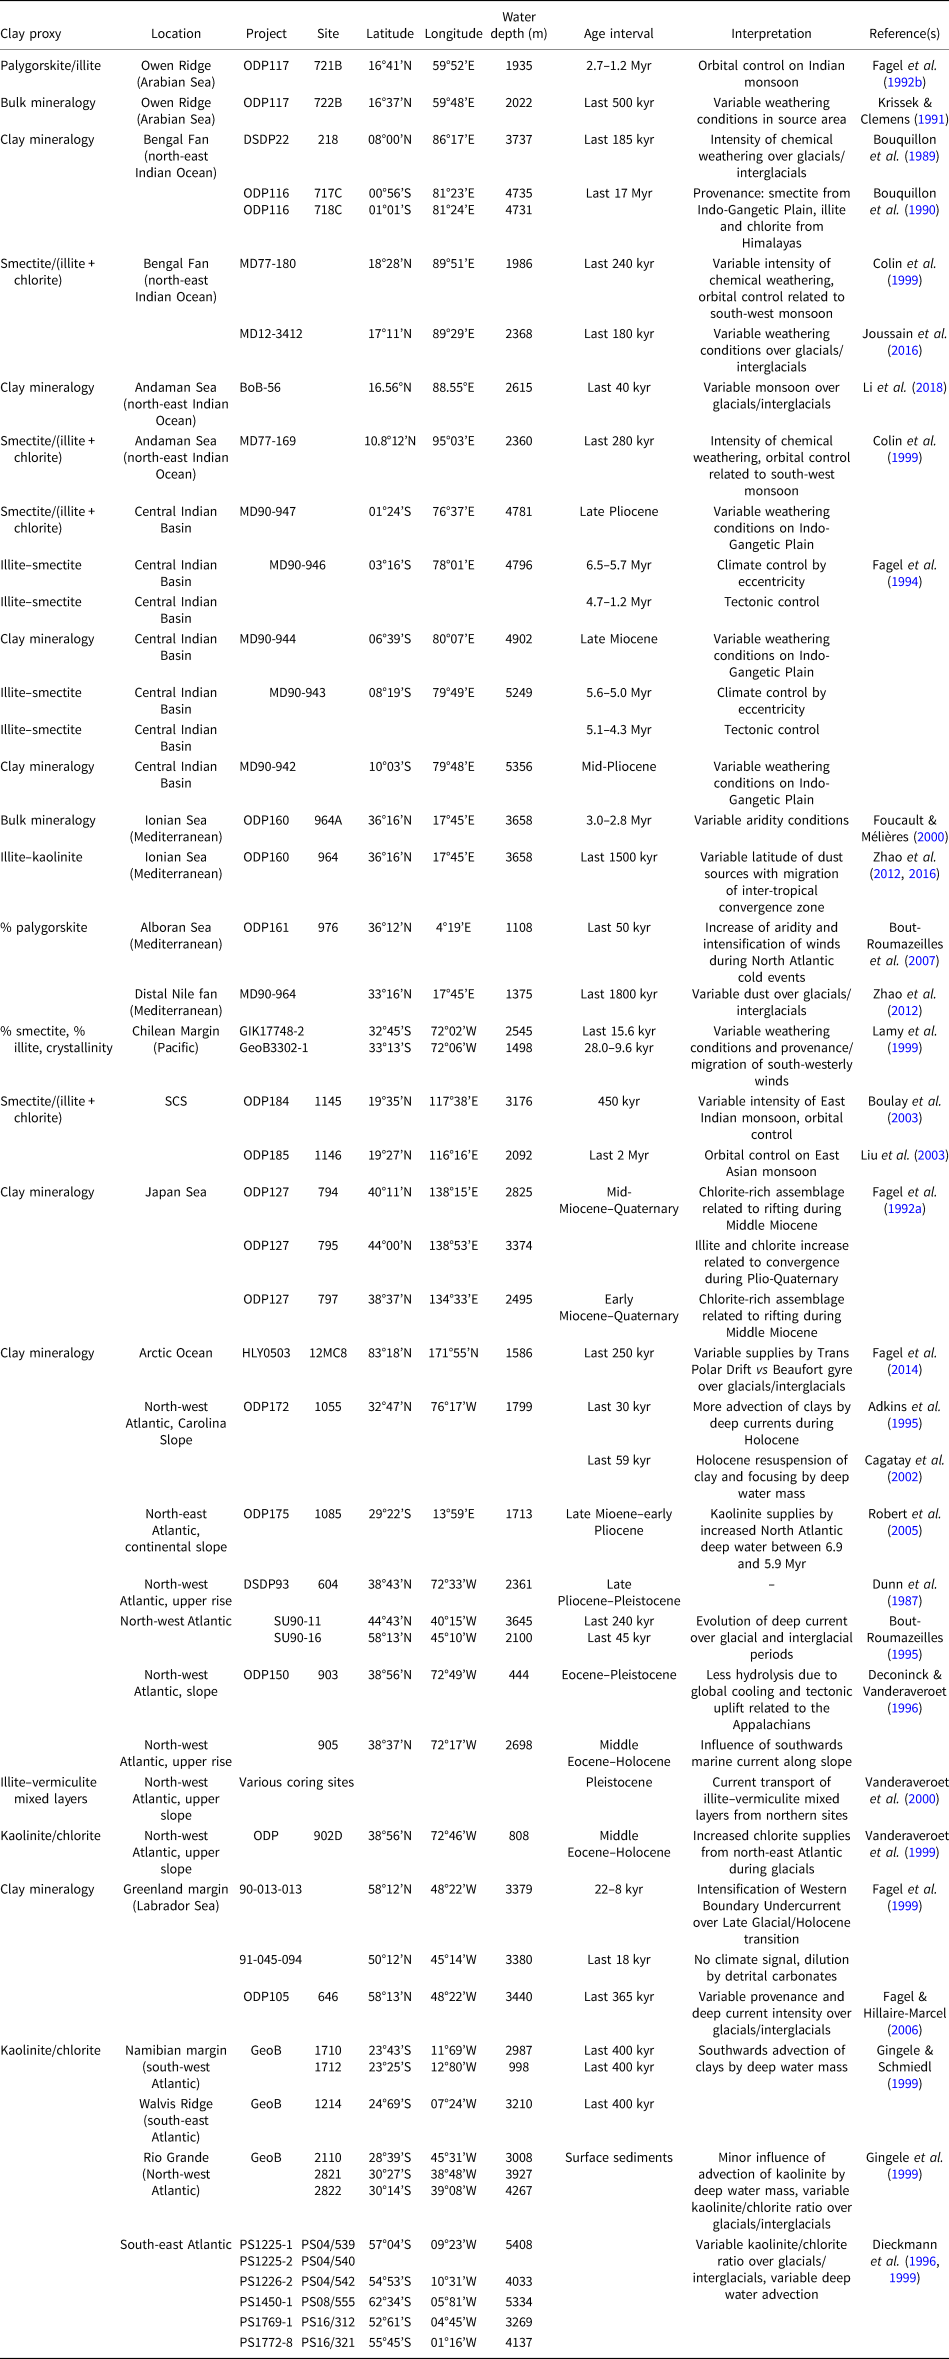
Over the last decade, the significance of climate for the evolution of clay mineral assemblages has been emphasized in many studies of marine sediments. A few studies have also been performed in lake settings. Whatever the environment, the climate interpretation is derived from the evolution of potential clay proxies over core depth or time. The most common proxy corresponds to the ratio between the relative abundance of at least two clay minerals (e.g. kaolinite/chlorite (Biscaye Reference Biscaye1965; Petschick et al., Reference Petschick, Kuhn and Gingele1996) or smectite/illite (e.g. Sakai et al., Reference Sakai, Minoura, Soma, Tani, Tanaka and Nara2005)), although, in some cases, the abundance of one only clay mineral (e.g. palygorskite; Bout-Roumazeilles et al., Reference Bout-Roumazeilles, Combourieu Nebout, Peyron, Cortijo, Landais and Masson-Delmotte2007) was also used. Examples of clay proxies and their interpretation in terms of climate or other factors are reported in Tables 1 & 2 for marine and lacustrine settings, respectively. This manuscript presents an overview of studies using clay mineral assemblages as proxies for climate variability in marine or lacustrine records (Fig. 2). It is emphasized that sedimentary clay minerals may record climate variability at different timescales and therefore may represent suitable proxies for palaeoclimate reconstructions.
Examples of studies using clay mineral-derived proxies from Neogene to Quaternary sedimentary records retrieved by coring in oceanic basins.
Examples of studies using clay mineral-derived proxies from Neogene to Quaternary sedimentary records retrieved in lacustrine settings.


Limitations of the clay mineral proxy
Only the detrital clays that are not affected by burial diagenesis may be used for palaeoclimate reconstructions. Moreover, the use of detrital clay minerals as climate proxies is mainly only valid for Cenozoic sediments. For Palaeozoic series, the palaeoclimate information is in most cases erased by burial diagenesis (e.g. Han et al., Reference Han, Préat, Chamley, Deconinck and Mansy2000; Hillier et al., Reference Hillier, Wilson and Merriman2006) that transformed the diversified clay mineral assemblages in simplified assemblages dominated by illite and chlorite (e.g. Chamley, Reference Chamley1989; Meunier, Reference Meunier2006). The Mesozoic was marked by limited orogenic activity on the continents and warm climatic conditions (i.e. greenhouse period; Chandler et al., Reference Chandler, Rind and Ruedy1992; Fletcher, Reference Fletcher, Brentnall, Anderson, Berner and Beerling2008; Korte et al., Reference Korte, Hesselbo, Ullmann, Dietl, Ruhl, Schweigert and Thibault2015; Landwehrs et al., Reference Landwehrs, Feulner, Petri, Sames and Wagreich2021). Both conditions reduced the detrital supplies and favoured a biogenic sedimentation marked by carbonates and marls (e.g. Hesselbo et al., Reference Hesselbo, Bjerrum, Hinnov, MacNiocaill, Miller and Riding2013; Munier et al., Reference Munier, Deconinck, Pellenard, Hesselbo, Riding and Ullmann2021). Assuming a negligible effect of burial diagenesis, the variations in clay mineral assemblages on outcrops or boreholes were used to reconstruct climate conditions during the early Jurassic (Kemp et al., Reference Kemp, Merriman and Bouch2005; Jeans, Reference Jeans2006; Dera et al., Reference Dera, Pellenard, Neige, Deconinck, Pucéat and Dommergues2009; Hesselbo et al., Reference Hesselbo, Hudson, Huggett, Leng, Riding and Ullmann2020, Munier et al., Reference Munier, Deconinck, Pellenard, Hesselbo, Riding and Ullmann2021), the middle and late Jurassic (e.g. Pellenard & Deconninck, Reference Pellenard and Deconinck2006; Huang et al., Reference Huang, Hesselbo and Hinnov2010) or the Cretaceous (e.g. Schnyder et al., Reference Schnyder, Ruffell, Deconinck and Baudin2006; Godet et al., Reference Godet, Bodin, Adatte and Föllmi2008). Unlike the Mesozoic, the Cenozoic sedimentation is characterized by high detrital fluxes supplied by physical erosion enhanced by tectonic uplift related to the Alpine orogenesis since the Oligocene (e.g. Zachos et al., Reference Zachos, Pagani, Sloan, Thomas and Billups2001; Schlunegger & Norton, Reference Schlunegger and Norton2015). The detrital mineral supplies are also enhanced by climate trends, marked by a global cooling over the Cenozoic (Zachos et al., Reference Zachos, Pagani, Sloan, Thomas and Billups2001). Moreover, some detrital clays may be reworked from past sedimentary outcrops. Such clay minerals may not be useful for climate reconstructions, as the time between the initial formation of the clay mineral (in the previous erosion cycle) may be long and the climate conditions may have changed over time (Thiry, Reference Thiry2000). For instance, the widespread occurrence of kaolinite in Quaternary sediments of the Arctic Ocean was explained by erosion of kaolinite-rich Mesozoic sedimentary rocks and palaeosoils (‘relict soils’) outcropping along the Alaskan and Canadian margins (Darby, Reference Darby1975). Kaolinite is formed by intense chemical weathering leading to the extensive leaching of cations and silica, occurring under warm and humid tropical-like conditions (Millot, Reference Millot1970). Its presence in Arctic sediments under conditions unfavourable to its formation did not provide any climate information. In a similar way, smectite-rich layers observed in glacial sediments of Lake Baikal were interpreted as reworked clay minerals from Jurassic sedimentary rocks present in the watershed (Fagel et al., Reference Fagel, Boski, Likhoshway and Oberhaensli2003). The presence of smectite, which would be incompatible with cold and dry glacial conditions, pointed to a reworked clay mineral with no significance of the climate.
Methodology
Sample preparation and analysis
X-ray diffraction (XRD) is the most common method used to identify clay minerals on oriented or random preparation (Środoń, Reference Bergaya, Theng and Lagaly2003). The identification of clay minerals is usually made on the <2 μm fraction separated by gravitational settling of the bulk sediment in a column of water to reduce the influence of non-clay minerals (Brown & Brindley, Reference Brown, Brindley, Brindley and Brown1980) The <2 μm fraction (referred as the ‘fine fraction’) corresponds to the granulometric definition of a clay fraction. Some pre-treatments may be applied on the bulk sample to remove carbonates, sulfates, Fe- and Al-oxyhydroxides and/or organic matter (e.g. Moore & Reynolds, Reference Moore and Reynolds1997).
The preparation of oriented mounts from the <2 μm fraction is achieved either by sedimentation on a glass slide, centrifugation or filtration on a porcelain plate (see more details in Velde, Reference Velde1992). Three diffractograms are then obtained in sequence from a sample (first: normal or air-dried; second: solvation; third: heating) to distinguish and identify the various clay minerals according to their expandability under ethylene-glycol solvation and their response to heating at 500°C (e.g. Holtzapffel, Reference Holtzapffel1985).
XRD semi-quantitative approach
The abundance of the clay minerals in the clay fraction can be derived from several analytical procedures. The common method of Biscaye (Reference Biscaye1965) estimates the percentages of the clay minerals from the glycolated sample, using the area of the peak at 17 Å for smectite, 10 Å for illite and 7 Å for kaolinite and chlorite, with the proportion of kaolinite and chlorite measured according to their peak heights at 3.57 Å (002 peak of kaolinite) and 3.53 Å (004 peak of chlorite), respectively. Each peak area is calculated by multiplying the peak height by its width at mid-height. Several open-access computer programs such as MACDIFF (Petschick, Reference Petschick1997) or HIGHSCORE (Malvern Panalytical) perform this operation. Other methods, however, use peak heights rather than peak areas (e.g. Thorez, Reference Thorez and Lelotte1976; Holtzapffel, Reference Holtzapffel1985; Boski et al., Reference Boski, Pessoa, Pedro, Thorez, Dias and Hall1998). In any case, all methods apply corrective factors to the measured peak area or height to take into account the intrinsic intensity of the peaks and the crystal order of the clay mineral (Holtzapffel, Reference Holtzapffel1985). Such an approach is frequently semi-quantitative, providing relative abundances of clay minerals and trends of clay mineral composition between samples rather than absolute percentages. Most interpretations are indeed derived from the evolution of the clay mineral ratio rather than abundance of one clay mineral.
XRD quantitative approach
XRD on bulk powder allows for the identification of clay minerals in randomly oriented samples and the quantification of their abundance (e.g. Dietel et al., Reference Dietel, Ufer, Kaufhold and Dohrmann2019). Since the pioneering work of Rietveld (Reference Rietveld1967, Reference Rietveld1969), the quantification is derived from the measurement of intensities of selected reflections and a comparison with reference intensities from internal or external reference phases (Snyder & Bish, Reference Snyder and Bish1989). Mineral identification is performed by comparing the peak positions and their relative intensities to diffraction data from pure phases using databases (e.g. Powder Diffraction File; ICDD, 2016; Gates-Rector & Blanton, Reference Gates-Rector and Blanton2019). Mineral quantification uses peak intensities, assuming that the intensities of diffraction peaks from a given phase are related to its abundance in a mixture (Chipera & Bish, Reference Chipera and Bish2002). Środoń (2002) stressed that the accuracy of the quantification is strongly influenced by sample preparation, data processing and selection of standards. The quantitative XRD approach requires an identical degree of orientation for all of the particles, obtained either by careful loading of the sampler holder (Środoń et al., Reference Środoń, Drits, McCarty, Hsieh and Eberl2001) or preparation of spherical aggregates by spray drying (Hillier, Reference Hillier1999). Although a perfect orientation is not always guaranteed (Kaufhold et al., Reference Kaufhold, Hein, Dohrmann and Ufer2012), computer-based simulation methods have been developed to quantify clay minerals from random preparations (e.g. Egli et al., Reference Egli, Merkli, Sartori, Mirabella and Plötze2008; Casetou-Gustafson et al., Reference Casetou-Gustafson, Hillier, Akselssond, Simonsson, Stendahl and Olsson2018).
The data processing of powder XRD traces can be carried out according to the reference intensity ratio (RIR) method, the full-pattern fitting method or the Rietveld refinement method. The RIR method (Bish & Chipera, Reference Bish and Chipera1988) is based on the measure of the diffraction intensity of a mineral phase relative to that of a standard (e.g. corundum) measured in a 50/50 (w/w) mixture (Hillier, Reference Hillier2000). The full-pattern fitting method (Omotoso et al., Reference Omotoso, McCarty, Hillier and Kleeberg2006; Raven & Self, Reference Raven and Self2017) quantifies mineral abundance in complex mixtures by treating the diffractogram of a given mixture as the sum of contributions from individual mineral components. This approach requires calibration and collection of pure reference mineral patterns (Kaufhold et al., Reference Kaufhold, Hein, Dohrmann and Ufer2012). Several computer programs (e.g. FULLPAT (Chipera & Bish, Reference Chipera and Bish2002); RockJock (Eberl, Reference Eberl2003); powdR package (Butler & Hillier, Reference Butler and Hillier2020, Reference Butler and Hillier2021)) combine the advantages of the RIR method with those of the full-pattern fitting method. The Rietveld method (e.g. Bergmann et al., Reference Bergmann, Friedel and Kleeberg1998; Ufer et al., Reference Ufer, Stanjek, Roth, Dohrmann, Kleeberg and Kaufhold2008, Reference Ufer, Kleeberg, Bergmann and Dohrmann2012; Dietel et al., Reference Dietel, Ufer, Kaufhold and Dohrmann2019) minimizes the differences between an observed XRD trace and one calculated based on crystal structure models by varying mineral composition and several other parameters (e.g. scale factor, unit-cell size, background; Chipera & Bish, Reference Chipera and Bish2002). Specific software using Rietveld refinement have been developed, such as Topas (Bruker) or Profex (open source). However, the application of the Rietveld approach requires knowledge of the crystal structures of all mineral components present in the samples (Chipera & Bish, Reference Chipera and Bish2002). Since 2002, significant improvements in analytical techniques for the quantification of clay-bearing complex mixtures have been stimulated by the biannual round-robin competition called the Reynold's Cup (e.g. McCarty, Reference McCarty2002; Omotoso et al., Reference Omotoso, McCarty, Hillier and Kleeberg2006; Raven & Shelf, Reference Raven and Self2017; Butler & Hillier, Reference Butler and Hillier2021).
Studies from marine sediments
Since 1968, Deep-Sea Drilling Projects (DSDP; 1968–1983), Ocean Drilling Projects (ODP; 1983–2007) and International Ocean Drilling Projects (IODP; until 2004) have improved our understanding of the provenance and transport pathways of marine sediments. The evolution of clay mineral assemblages through core-depth analysis was investigated in many oceanic basins to reconstruct either changes of weathering conditions in the adjacent continental watershed or of atmospheric/oceanic current pathways (Fig. 2 & Table 1).
Arabian Sea: identification of sediment sources, means of transport and climatic controls
Site description
In the Arabian Sea (north-western Indian Ocean; Fig. 3), the climate is controlled by the monsoon regime (Kutzbach, Reference Kutzbach1981; Prell, Reference Prell, Berger, Imbrie, Hayse, Kukla, Saltzman and Reidel1984). The monsoon phenomenon corresponds to a seasonal reversal of wind direction. Driven by the land–sea thermal contrast, monsoons affect the annual weather cycle between 30°N and 30°S. The south-west summer monsoon provides strong and wet winds, whereas the north-east winter monsoon brings weak and dry winds. The Owen Ridge is a key site in the north-west Indian Ocean for observing the onset and behaviour of the monsoonal circulation pattern using clay proxies. Indeed, the site is characterized by two contrasting sources in terms of clay mineralogy. During the summer monsoon, the south-westerly winds sweep the saline desert area of Somalia along the East African coast and Arabian Peninsula, bringing significant amounts of palygorskite (Debrabant et al., Reference Debrabant, Krissek, Bouquillon, Chamley, Prell, Niitsuma, Emeis, Al-Sulaiman, Al-Tobbah and Anderson1991; Krissek & Clemens, Reference Krissek, Clemens, Prell, Niitsuma, Emeis, Al-Sulaiman, Al-Tobbah and Anderson1991). Nair et al. (Reference Nair, Ittekkot, Manganini, Ramaswamy, Haake and Degens1989) estimated that during the summer 80% of detrital fluxes were delivered to the Owen Ridge by the south-western monsoon winds. In winter, the north-east monsoon is weak. However, south-central Asia still receives rainfall draining the Himalayan highlands. Illite released by physical erosion from the Himalayas is transported by the Indus River towards the Owen Ridge (Fagel et al., Reference Fagel, Debrabant, De Menocal and Demoulin1992b). Since the Middle Miocene, the ridge was uplifted above the level of active Indus-derived turbiditic flows (Debrabant et al., Reference Debrabant, Krissek, Bouquillon, Chamley, Prell, Niitsuma, Emeis, Al-Sulaiman, Al-Tobbah and Anderson1991). Following the uplift, the clay minerals are delivered to the Owen Ridge mainly by aeolian transport (from the west and south) and oceanic currents (from the north). The continuous hemipelagic sedimentation (35 m/Myr) on the Owen Ridge was expected to record a climatic influence that was masked in the adjacent deep-sea fans.
Location of coring sites in the Arabian Sea, Bay of Bengal and Central Indian Basin in the Indian Ocean, including DSDP (underlined number), ODP (plain number) and Marion Dufresne (MD) drilling campaigns. The arrows represent the main transport of clay minerals to the adjacent basins. The orange arrows indicate the south-western summer monsoon and associated north-western trade winds that transport palygorskite-rich dust to the Owen Ridge. Illite (and chlorite to a lesser extent) is delivered by fluviatile transport (Indus or Ganges). Smectite, mainly originating from the Indo-Gangetic Plain, is delivered by fluviatile transport to the Bay of Bengal and Central Indian Basin.

Materials and methods
The coring site 721B (16°40.636’N, 59°51.879’E; Fig. 3) recovered 450 m of early Miocene to Pleistocene sediments (Debrabant et al., Reference Debrabant, Krissek, Bouquillon, Chamley, Prell, Niitsuma, Emeis, Al-Sulaiman, Al-Tobbah and Anderson1991). Analysis of the fine fraction was conducted on the Pliocene–Pleistocene sedimentary interval in the upper unit 1A of Site 721B (Leg ODP 117; Debrabant et al., Reference Debrabant, Krissek, Bouquillon, Chamley, Prell, Niitsuma, Emeis, Al-Sulaiman, Al-Tobbah and Anderson1991), between 2.7 and 1.2 Myr, totalling 300 samples (Fagel et al., Reference Fagel, Debrabant, De Menocal and Demoulin1992b). The sediments of unit 1A were composed of nanofossil oozes.
XRD analysis was carried out on oriented mounts after decarbonation and settling to retrieve the <2 μm fraction. The measurements were performed at the University of Lille I (France) using a Philips PW 1730 diffractometer equipped with a copper anticathode. The semi-quantification of the clay minerals (±5%) was conducted according to the method proposed by Holtzapffel (Reference Holtzapffel1985), using diagnostic peak heights multiplied by corrective factors. Peak height ratios were measured on the XRD trace of glycolated mounts as a clay mineral proxy. The chosen proxy P/I (i.e. palygorskite/illite ratio) corresponds to the ratio between the 10.4 Å peak of palygorskite and the 10.0 Å peak of illite. Over the studied interval, the P/I ratio ranged between 0.35 and 1.20 with a standard deviation of 0.03–0.05 measured using 3 samples and 10 preparations of each (Fagel et al., Reference Fagel, Debrabant, De Menocal and Demoulin1992b). The P/I ratio values were reported as a function of time. A constant sedimentation rate was assumed, which allows us to define a time series (Li et al., Reference Li, Liu, Shi, Zhang, Fang and Chen2018; Meyers, Reference Meyers2015) that may be further treated by spectral analysis (Fig. 4). This statistical approach is based on various mathematical transformations (e.g. discrete Fourier transform [DFT], discrete Fourier transform on the autocorrelation [DFTA]; Press et al., Reference Press, Flannery, Teukolsky and Vetterling1986; Beaufort, Reference Beaufort1996) that are applied to the time series to reveal any periodicity (Jenkins & Watts, Reference Jenkins and Watts1968). The results of DFT and DFTA give the intensity of the signal (y-axis) as a function of a spectral index (n, x-axis). In such diagrams, each peak corresponds to a period (Tx) obtained by dividing the duration of the studied interval (I) by the spectral index (x; i.e. I/x = Tx).
Spectral analysis of the palygorskite/illite (P/I) ratio over a 1.5 Myr interval between 2.7 and 1.2 Myr in core 721B retrieved from Owen Ridge (top left, modified from Fagel et al., Reference Fagel, Debrabant, De Menocal and Demoulin1992b). Top right: orbital parameters that modify climate and related events. The lower graphs represent the results of spectral analysis. In the autocorrelation, the period of 95 kyr indicates control by the eccentricity of Earth's orbit. The DFTA demonstrates orbital control by the three orbital parameters (E = eccentricity in blue; O = obliquity in green; P = precession in red). The periods observed at 32 and 75 kyr probably correspond to non-linear combinations between various orbital parameters.

Earth's climate is influenced by periodic changes in Earth's orbital parameters (Hays et al., Reference Hays, Imbrie and Shackleton1976; Berger, Reference Berger, Berger, Mesinger and Sijacki2012). These so-called Milankovitch cycles include precession (~20 kyr), obliquity (41 kyr) and eccentricity (~100 kyr, in turn modulated by a 405 kyr cycle; Fig. 4; Laskar et al., Reference Laskar, Fienga, Gastineau and Manche2011). Palaeoclimate proxies are used to detect orbital forcing in sedimentary series and to establish accurate orbital timescales, notably for the Cenozoic (Lourens et al., Reference Lourens, Hilgen, Laskar, Wilson, Gradstein, Ogg and Smith2005).
Results and interpretation
The studied clay mineral assemblage of core 721B consisted of palygorskite (20–50%), smectite (20–45%), illite and irregular illite–smectite mixed-layer 10–14 (10–30%), chlorite (5–20%) and kaolinite (0–10%). The clay mineralogy displayed a marked negative correlation between the relative abundances of palygorskite and illite over core depth. The average coefficient of correlation between palygorskite and illite was –0.61, although it varied with the age of the sediment (Fagel et al., Reference Fagel, Debrabant, De Menocal and Demoulin1992b). Accordingly, palygorskite and illite have different sources, so that fluctuations in clay mineral assemblages most probably reflect repeated inversions of atmospheric circulation related to the Indian monsoon. Palygorskite-rich intervals indicate intense aeolian supplies by the strong summer monsoon, whereas illite-rich intervals record fluviatile supplies by the Indus during the weak winter monsoon (Fig. 3).
A spectral analysis was performed on the evolution of the P/I ratio between 2.7 and 1.2 Myr to reveal any periodicity in the time series. The result of autocorrelation on the 1.5 Myr-long interval revealed two periods of 95 kyr and of 375 kyr (Fig. 4). Such periods are within the range of the characteristic periods of the eccentricity of Earth's orbit (Fig. 4). Although the spectral analysis revealed numerous peaks, it is only possible to interpret those peaks for which a cause can be established (i.e. those that are probably linked to the three orbital parameters; Berger, Reference Berger1977). In the DFTA, the period of 107 kyr (n = 14) most probably reflects the influence of the eccentricity on clay sedimentation on the Owen Ridge. The period of 43 kyr (n = 35) probably records the influence of the obliquity, whereas the periods comprising between 24 and 20 kyr (62 < n < 75) demonstrate the influence of precession on clay sedimentation. A period of 375 kyr (n = 4) is also observed in the autocorrelation, but the time series is too short to confirm it. The intense peaks observed at 75 and 32 kyr in the DFTA probably correspond to non-linear combination of the orbital parameters (Ruddiman & McIntyre, Reference Ruddiman and McIntyre1981; Clemens & Prell, Reference Clemens, Prell, Prell, Niitsuma, Emeis, Al-Sulaiman, Al-Tobbah and Anderson1991).
In addition, the spectral analysis of the range between 2.7 and 1.2 Myr was performed on successively shorter intervals of 375 kyr to investigate any evolution of the main orbital control through time. Figure 5 compares the results of the autocorrelation and the DFTA analyses on two successive intervals. The oldest interval, between 2.7 and 2.3 Myr (Fig. 5a), presents a strong periodicity between 19 (n = 20) and 23 kyr (n = 16), indicating a dominant precession influence, confirmed by the periodicity of 21 kyr observed in the autocorrelation (Fig. 5a, inset). For the next interval (2.3–2.0 Myr; Fig. 5b), the highest intensity detected in DFTA coincides with a period of 42 kyr (n = 9), indicating control by obliquity, as was also confirmed by the results of autocorrelation (Fig. 5b, inset). The same result was obtained from the magnetic susceptibility profile of core 721B (De Menocal et al., Reference De Menocal, Bloemendal, King, Prell, Niitsuma, Emeis, Al-Sulaiman, Al-Tobbah and Anderson1991). The transition from predominant control by precession to obliquity occurs at 2.4–2.3 Myr, within a time interval corresponding to the extension of the Northern Hemisphere glaciations (Shackleton et al., Reference Shackleton, Backmann, Zimmerman, Kent, Hall and Roberts1984). Supporting this interpretation, De Menocal et al. (Reference De Menocal, Bloemendal, King, Prell, Niitsuma, Emeis, Al-Sulaiman, Al-Tobbah and Anderson1991) proposed that the Indian monsoon, at low latitude, was slightly affected by the expansion of the ice sheets in the high latitudes of the Northern Hemisphere. In summary, the variability observed in the Neogene clay sedimentation on the Owen Ridge is strongly controlled by climate, with different sources involved over seasons and linked to the Indian monsoon.
Spectral analysis of the palygorskite/illite (P/I) ratio at two successive intervals of 375 kyr between 2.7 and 2.0 Myr of core 721B retrieved from Owen Ridge (modified from Fagel et al., Reference Fagel, Debrabant, De Menocal and Demoulin1992b). Large graphs: The dominant periods obtained by DFTA for (a) 2.7–2.3 Myr and (b) 2.3–2.0 Myr. For the colour code, see Fig. 4. The oldest interval (2.7–2.3 Myr) is marked by dominant precession (P) control that evolves towards obliquity (O) control between 2.3 and 2.0 Myr. The insets represent the autocorrelation function. In these graphs, the distance between two peaks indicates the type of orbital control. E = eccentricity.

Bengal Fan, northern Indian Ocean: fluviatile transport and weathering conditions
Site description
Proximal environments on the ocean floor such as fans and deltas have been widely studied to trace the origins of detrital supplies. The clay assemblages of those proximal environments are under the direct control of the adjacent continental landmasses. For instance, the Bengal Fan (Fig. 3), the largest submarine fan in the world (Curray et al., Reference Curray, Emmel and Moore2003), receives both the physical weathering products of Himalayan highlands (i.e. primary minerals illite and chlorite) and the chemical weathering products of the Indo-Gangetic Plain soils (i.e. secondary minerals, mainly smectite; Srivastava et al., Reference Srivastava, Parkash and Pal1998) via fluviatile transport by the Ganges and Brahmaputra rivers (Venkatarathnam & Biscaye, Reference Venkatarathnam and Biscaye1973; Kolla & Rao, Reference Kolla and Rao1990). Since the Bengal Fan sediments are very sensitive to monsoon rainfall, this study allows us to determine the relationships between regional climate and continental erosion (e.g. Joussain et al., Reference Joussain, Colin, Liu, Meynadier, Fournier and Fauquembergue2016).
Clay mineral variability was investigated in several marine cores at both proximal (e.g. MD77-180 (Colin et al., Reference Colin, Turpin, Bertaux, Desprairies and Kissel1999); BoB-56 (Li et al., Reference Li, Liu, Shi, Zhang, Fang and Chen2018)) and distal Bengal Fan sites (e.g. DSDP 218 (Bouquillon et al., Reference Bouquillon, Chamley and Frohlich1989); ODP Leg 116 Site 717C (Bouquillon et al., Reference Bouquillon, France-Lanord, Michard, Tiercelin, Cochran, Stow, Auroux, Amano, Balson and Boulègue1990; Brass & Raman, Reference Brass, Raman, Cochran, Stow, Auroux, Amano, Balson and Boulègue1990; Aoki et al., Reference Aoki, Kohyama and lshizuka1991); Fig. 3). In the <2 μm fraction, the clay mineral assemblages are characterized by changes in the relative abundance of illite and smectite over long timescales, from the early Miocene to Pleistocene. This mineral variability is explained either by changes in relative sedimentary inputs from Himalayan and Indian sources and/or changes in weathering intensity in the Indo-Gangetic Plain (e.g. Bouquillon et al., Reference Bouquillon, France-Lanord, Michard, Tiercelin, Cochran, Stow, Auroux, Amano, Balson and Boulègue1990; Aoki et al., Reference Aoki, Kohyama and lshizuka1991; France-Lanord et al., Reference France-Lanord, Derry and Michard1993; Derry & France-Lanord, Reference Derry and France-Lanord1996).
Materials and methods
Joussain et al. (Reference Joussain, Colin, Liu, Meynadier, Fournier and Fauquembergue2016) analysed the clay mineral assemblages in core MD12-3412 over the last 180 kyr with a millennial resolution. The 32 m-long core MD12-3412 (17°10’94”N, 89°28’92”E) was retrieved in the upper part of the Bengal Fan at a water depth of 2368 m near the continental slope (north-eastern Bay of Bengal; Fig. 3). Its hemipelagic sediments consisted of intercalations of clayey and silty layers interrupted by gravity-flow depositions (i.e. turbidites) related to changes in the regime of Ganges discharges. The δ18O vs depth curve from planktonic foraminifera, combined with seven radiocarbon ages, was correlated with the reference marine oxygen isotope composition vs time curve SPECMAP (Martinson et al., Reference Martinson, Pisias, Hays, Imbrie, Moore and Shackleton1987) to establish an age model for core MD12-3412, which produced an estimate of a high sedimentation rate ranging between 3 and 11 cm kyr–1.
Only the upper 13.5 m of core MD12-3412 (i.e. ~180 kyr) was sampled at 5–10 cm intervals for clay mineralogical analyses (n = 240). Oriented mounts of carbonate-free <2 μm fractions were investigated using XRD (Holtzapffel, Reference Holtzapffel1985). The analysis was performed using a PANalytical X'Pert Pro Diffractometer equipped with a copper anticathode (Cu-Kα) and a Ni filter, under a voltage of 40 kV and a current intensity of 25 mA. The samples were measured with a counting time of 1 s/step in the range 3–30°2θ. The relative abundance of the main clay minerals was derived from the measurement of peak areas of the basal reflection (10 Å for illite, 7 Å for chlorite and kaolinite, 15–17 Å for smectite) on glycolated mounts using MacDiff software (Petschick, Reference Petschick1997). The relative proportions of kaolinite and chlorite were estimated using the (002) peak of kaolinite and the (004) peak of chlorite (i.e. 3.57 Å/3.54 Å; Biscaye, Reference Biscaye1965).
Results and interpretation
According to the age model, the upper 13.5 m of core MD12-3412 covered Marine Isotopic Stages (MISs) 6 to 1 (Martinson et al., Reference Martinson, Pisias, Hays, Imbrie, Moore and Shackleton1987), encompassing several glacial (MISs 6 and 2) and interglacial (MISs 5 and 1) periods. Over the studied interval, smectite (11–64%) and illite (18–49%) were the predominant clay minerals, followed by chlorite (10–39%) and kaolinite (5–12%). The fluctuations of smectite over glacial and interglacial periods were negatively correlated with illite and chlorite variations. The upper sediments of core MD12-3142 were expressed as [Sm/I + C], the clay mineral abundance ratio between smectites and the sum of illite and chlorite. The ratio [Sm/I + C] is a proxy for weathering conditions in the adjacent continental area. More physical erosion during glacial periods leads to an enrichment of primary minerals, illite and chlorite and a low [Sm/I + C]. By contrast, warmer interglacial intervals enhance chemical weathering with more production of secondary clays, mainly smectite, in the soils of the Indo-Gangetic Plain, resulting in high [Sm/I + C] values. On average, the [Sm/I + C] ratio is <0.5 during glacial periods, whereas it reaches up to 1 and, more rarely, 2 in interglacial intervals. Therefore, interglacial periods were marked by a significant increase in the proportion of smectite (high [Sm/I + C] ratios), whereas glacial periods were characterized by an increase in illite and chlorite (low [Sm/I + C] ratios). In particular, Joussain et al. (Reference Joussain, Colin, Liu, Meynadier, Fournier and Fauquembergue2016) explained the observed [Sm/I + C] maxima during interglacial MIS 5 either by an intensification of summer monsoon rainfall or by a reinforced summer surface oceanic current, both processes leading to greater delivery of smectite to the Bay of Bengal.
The glacial–interglacial variations also had an influence on sea level. During the higher sea level of the last interglacial, turbidity currents were focused on the active submarine channel located in the eastern part of the Bay of Bengal (Weber et al., Reference Weber, Wiedicke, Kudrass, Hübscher and Erlenkeuser1997; Curray et al., Reference Curray, Emmel and Moore2003), leading to greater proportions of detrital material from the Ganges–Brahmaputra river system in core MD12-3412 (Fig. 3). During glacial periods, the rivers were confined to the main channels in response of the lower sea level, resulting in more efficient delivery of detrital minerals from the Indo-Burman ranges (Fig. 3) to the north-eastern Bengal Fan.
Central Indian Basin, Indian Ocean: fluviatile transport and weathering conditions
Site description
Major tectonic, climatic and oceanic current changes have occurred in the Indian Ocean since the early Cenozoic in relation to the Alpine orogenesis (e.g. Kennett, Reference Kennett1982). Such changes were expected to be recorded in the Indian Ocean sediments.
Materials and methods
Five long cores (i.e. MD90-947 to MD90-942, 33–49 m long) were recovered along a north–south (1–10°S) transect at ~80°E in the Central Indian Basin (Fig. 3) during the MD90/SHIVA cruise (Fagel et al., Reference Fagel, Debrabant and André1994). Two main lithologies were observed: a lower sedimentary unit made of reduced silty to sandy mud and an upper unit composed of oxidized siliceous clayey mud. According to radiolarian-derived biostratigraphy, the age of the sediments ranged from the Late Miocene to the Late Pliocene (<3.5/3.7 to >6.3 Myr).
The clay mineralogy was studied by XRD of the <2 μm carbonate-free fraction (Holtzapffel, Reference Holtzapffel1985), with a sampling interval of 30–40 cm (i.e. ~600 samples). A Philips PW 1730 diffractometer equipped with a copper anticathode and Ni filter was used with a voltage of 40 kV and an intensity of 25 mA. Analytical uncertainties are estimated as ±5% for clay mineral abundances >20% (Holtzapffel, Reference Holtzapffel1985).
In addition, the clay mineral variability was studied at high resolution in the cores MD90-946 (3°S) and MD90-943 (8°S) over three biostratigraphy-constrained intervals: specifically, between 5.7/5.8 and 6.3/6.5 Myr (Late Miocene) and between 1.2/1.5 and 4.3/4.7 Myr (Late Pliocene) for MD90-946 and between 5.0 and 5.6 Myr (Early Pliocene) for MD90-943. A total of 400 supplementary samples were analyzed by XRD to reach a resolution of 1 sample per 10 cm. The chosen clay proxy was the smectite/illite peak height ratio (S/I), which was measured on the glycolated diffractograms (Fagel et al., Reference Fagel, Debrabant and André1994). The fluctuations of S/I ratios through core depth were reported as a function of time by applying a mass accumulation rate estimated from stratigraphic information. Then, the time series were further studied by spectral analysis to detect any periodicity in the clay mineralogy.
Results and interpretation
The clay mineralogy of the southern sites (MD90-942, MD90-943 and MD90-944; Fig. 3) is dominated by smectite (35–90%) associated with illite (5–45%), kaolinite (5–25%), chlorite (0–10%) and irregular mixed-layer minerals (0–10%). Illite (5–35%) and chlorite (0–15%) are more abundant in northern sites (MD90-946 and MD90-947; Fig. 3) than in the southern ones (3% < illite < 22%, chlorite <10%). The main supplies of illite, chlorite and irregular mixed-layer minerals were attributed to the physical erosion of the Himalayan reliefs and their river drainage systems (Nath et al., Reference Nath, Rao and Becker1989). In the marine environment, illite and chlorite settled rapidly due to their coarser size, whereas smectite travelled further south, leading to an enrichment of smectite in the distal environment (differential settling process; Debrabant et al., Reference Debrabant, Fagel, Chamley, Bout and Coulet1993).
The clay variability, expressed by the S/I ratio, was further studied at higher resolution on three intervals of cores MD90-946 and MD90-943 (Fagel et al., Reference Fagel, Debrabant and André1994). Only the periodical cycles that were revealed in several independent mathematical functions (autocorrelation, DFT and DFTA) were considered as significant (Blackman-Tuckey, Reference Blackman and Tuckey1958). The most prominent periodical cycle was of 100 kyr (i.e. eccentricity; Fig. 4) observed in the S/I fluctuations over the Late Miocene interval (5.7/5.8 to 6.3/6.5 Myr) in core MD90-946. Therefore, Late Miocene smectite/illite variations are controlled by a periodic Earth orbital control linked to its eccentricity (Fagel et al., Reference Fagel, Debrabant and André1994). The spectral analysis on the Early Pliocene interval (5.0–5.6 Myr) of core MD90-943 also showed control of a 100 kyr cycle in the different spectral treatments (Fagel et al., Reference Fagel, Debrabant and André1994).
By contrast, no cyclicity was observed in spectral analysis over the Late Pliocene interval (1.2/1.5 to 4.3/4.7 Myr), suggesting non-periodic, most probably tectonic-related control over the S/I ratios in the upper part of the MD90-946 core (Fagel et al., Reference Fagel, Debrabant and André1994). The Central Indian Basin, located in a north–south compressive stress regime, has been affected by intraplate deformation (Stein & Okal, Reference Stein and Okal1978) since the late Miocene. Seismic instabilities on the Chaggos–Laccadive Ridge located at the western side of the MD90-946 core could favour some turbiditic supplies. Tectonic rejuvenation most probably explains the absence of periodic control of the sedimentation.
South China Sea, Pacific Ocean: provenance of detrital fluxes and interaction between monsoon winds and surface current transport
Site description
The South China Sea (SCS; Fig. 6) is the largest marginal sea in the Pacific Ocean. Its sedimentation reflects the complex interactions between surface oceanic current patterns, East Asian monsoon winds and subsurface and deep currents from the adjacent Pacific Ocean intruding from the south (Wang et al., Reference Wang, Clemens and Liu2003). The East Asian monsoon, a major component of the global climate system, results from differential heating of the Asian continent and the western Pacific Ocean, which causes large seasonal contrasts in wind, precipitation and surface currents (Webster, Reference Webster, Fein and Stephens1987). In the summer, heating of the Asian continent generates a low-atmospheric pressure cell over central China, which induces wind to blow from south-west to north-east, bringing heavy monsoon rainfall over the south-eastern Asian continent (Webster, Reference Webster, Fein and Stephens1987). Conversely, in winter, a high-pressure cell over northern Asia related to the low temperatures over the Asian continent is responsible for dry and cold winds blowing from continental Asia to SCS in the south-west direction (Fig. 6a). In addition to local monsoon-related climatic changes, the SCS also records global glacial/interglacial oscillations (Boulay et al., Reference Boulay, Colin, Trentesaux, Frank and Liu2005). During glacial period, the SCS became a semi-enclosed marginal sea due to the significant sea-level drop (≥100 m; Fig. 6b). The modified glacial coastline was characterized by a clockwise surface circulation gyre in the summer and an anticlockwise gyre in the winter (Wang & Wang, Reference Wang and Wang1990).
Location of ODP coring sites 1145 and 1146 in the SCS (modified from Liu et al., Reference Liu, Trentesaux, Clemens, Colin, Wang, Huang and Boulay2003). The small coloured arrows indicate the provenance of clay minerals, with smectite-rich supplies in blue, illite in green, chlorite in grey and kaolinite in red. The lengths of the arrows indicate the relative importance of the clay mineral contributions from the various sources. (a) Main sources of clay minerals during interglacial periods. The winter north-eastern winds mainly brought illite and chlorite that were delivered by the Yangtze River (large green–grey arrow). The summer south-western winds transport smectite produced by weathering of volcanic material (large blue arrow). The surface oceanic currents then distribute the clay minerals across the SCS (black arrows). (b) Modifications occurring during glacial periods when the SCS became a semi-enclosed basin.

The delivery of clay minerals in the surface sediments of the SCS (Fig. 6) was controlled by the river discharge of weathering products from the adjacent Asian continent (Chen, Reference Chen1978). Approximately 570 Mt yr–1 of suspended sediment (2.8% of global discharge to the world oceans; Milliman & Syvitski, Reference Milliman and Syvitski1992) are delivered to the SCS from three main sources (the Mekong River, the Pearl River and the Red River) and small rivers in south-western Taiwan (Liu et al., Reference Liu, Colin, Li, Zhao, Tuo and Chen2010). The north-eastern SCS receives 46% of this discharge (260 Mt yr–1) from the Pearl River, south-western Taiwan and the Luzon arc system (Liu et al., Reference Liu, Colin, Li, Zhao, Tuo and Chen2010).
The distribution of clay minerals at the surface sediments of the SCS is mainly controlled by mineral provenance, with six mineralogical provinces being differentiated (Chen, Reference Chen1978):
(1) Illite and chlorite are the dominant minerals in the northern shelf of the SCS, the Taiwan Strait and the East China Sea. They are delivered by deep-water currents to the northern SCS by mountainous rivers draining the island of Taiwan and by the Yangtze River through the Taiwan Strait, with minor aeolian contributions from northern Asia due to north-eastern winter monsoon winds.
(2) Smectite and kaolinite are somewhat greater in content (~7%) relative to illite and chlorite in the central part of the SCS and north-east Luzon Strait.
(3) Smectite is >20% around the volcanic arc of the island of Luzon. Smectite-rich supplies are further transported to the northern SCS by surface currents influenced by the Kuroshio current originating from the adjacent Pacific Ocean.
(4) Smectite reaches ~30% in the southern SCS along Malaysia and Borneo. They are supplied by the south-western summer monsoon winds and transported by the surface oceanic currents to the northern end of the SCS and to the East China Sea through the Taiwan Strait (Fig. 6a; Liu et al., Reference Liu, Trentesaux, Clemens, Colin, Wang, Huang and Boulay2003, Reference Liu, Colin, Li, Zhao, Tuo and Chen2010).
(5) Kaolinite represents 50% of the clay mineral assemblage in the estuary of the Pearl River, then decreases downslope, probably due to rapid settling of coarse particles.
(6) Illite and chlorite are abundant in the estuary of the Mekong River (47% and 23%, respectively).
The relative contributions of clay minerals in the SCS sedimentary record were affected by the modified morphology of the SCS during glacial periods due to a sea-level drop of ~100 m (Fig. 6b). The SCS became a semi-enclosed basin characterized by an anticlockwise surface circulation driven by the winter monsoon winds (Wang et al., Reference Wang, Wang, Bian and Jian1995). More supplies of kaolinite were delivered to the coring site by the Palaeo-Pearl River due to the significant south-eastern shift of its estuary. Illite was mainly supplied from the island of Taiwan, whereas smectite was delivered to the south SCS by the Palaeo-Sanda River and to the north-eastern SCS from the island of Luzon. The distribution of clay minerals in SCS sediments may be used to trace the provenance and to identify the main transport agents supplying the detrital clay minerals to the marginal oceanic basins (Lui et al., Reference Liu, Trentesaux, Clemens, Colin, Wang, Huang and Boulay2003, Reference Liu, Colin, Li, Zhao, Tuo and Chen2010).
Materials and methods
ODP site 1146 (19°27.40’N, 116°16.37’E) was drilled on the continental slope of the northern SCS, at a water depth of 2092 m and near to the Pearl River estuary (Fig. 6). The sediments consisted of nannofossil-containing clays. The samples (n = 515) were retrieved from the upper 190 m of holes 1146A, B and C. The oxygen isotope record measured using foraminifera Globigerinoides ruber (surface-dwelling planktonic species) of ODP Site 1146 was correlated to the reference δ18O curve of ODP Site 677 in the east Atlantic (1°12’N, 83°44’W, 3461 m water depth; Shackleton et al., Reference Shackleton, Berger and Peltier1990). The studied interval covered the last 2 Myr. According to the age-depth model, derived from a combination of oxygen isotope stratigraphy, biostratigraphy and palaeomagnetism, the sampling interval of ~40 cm provided an average temporal resolution of 4 kyr (Liu et al., Reference Liu, Trentesaux, Clemens, Colin, Wang, Huang and Boulay2003).
Clay minerals were identified by XRD on oriented mounts of carbonate-free, clay-sized particles (<2 μm) according to the methodology of Holtzapffel (Reference Holtzapffel1985). The analysis was performed using a Philips PW 1710 diffractometer with Cu-Kα radiation and Ni filter, with a voltage of 40 kV and a current intensity of 25 mA (Trentesaux et al., Reference Trentesaux, Liu, Colin, Boulay, Wang, Prell, Wang, Blum, Rea and Clemens2003). Three analyses were performed per sample for air-dried and glycolated conditions in the 2.5–32.5°2θ range and from 2.5 to 14.5°2θ for heated samples (2 h at 490°C). Semi-quantitative estimates were derived from measurements of the glycolated mounts using the peak areas of the following peaks: smectite at 17 Å, mixed-layer illite–smectite at 15 Å, illite at 10 Å and kaolinite/chlorite at 7 Å, using the MacDiff software (Petschick, Reference Petschick1997). The clay mineral ratio (smectite + illite–smectite)/(illite + chlorite) was calculated from the peak areas to evaluate the controls over clay mineral variations over the last 2 Myr (Liu et al., Reference Liu, Trentesaux, Clemens, Colin, Wang, Huang and Boulay2003). A spectral analysis was performed on the evolution of the clay mineral ratio (smectite + illite–smectite)/(illite + chlorite) to reveal any periodicity in the time series covering the last 2 Myr.
Results and interpretation
The clay minerals in ODP site 1146 (Fig. 6) are dominated by illite (22–43%) and smectite (12–48%), associated with chlorite (10–30%), kaolinite (2–18%) and illite–smectite and chlorite–smectite (5–22%; Liu et al., Reference Liu, Trentesaux, Clemens, Colin, Wang, Huang and Boulay2003; Trentesaux et al., Reference Trentesaux, Liu, Colin, Boulay, Wang, Prell, Wang, Blum, Rea and Clemens2003). Over the last 2 Myr, the clay mineral assemblages display opposing trends for (illite + chlorite) and smectite. Illite and chlorite display similar variations, with higher values during glacial intervals (35% < illite < 43%, 20% < chlorite < 30%; Liu et al., Reference Liu, Trentesaux, Clemens, Colin, Wang, Huang and Boulay2003). Higher values of smectite (>30%) occur during interglacial periods. Kaolinite averages 12%, with greater values occurring during glacials. Because the irregular mixed-layer minerals evolve in parallel with smectite, both minerals were merged into ‘smectite’. The clay variability was represented by the evolution of the ratio smectite/(illite + chlorite) over the last 2 Myr (Liu et al., Reference Liu, Trentesaux, Clemens, Colin, Wang, Huang and Boulay2003). The ratio [S/(I + C)] displays a range of variation between 0.3 and 1.8 (average value 0.9), with higher [S/(I + C)] ratios systematically reported during interglacials. This variation is correlated with the oxygen isotope record, particularly before 1 Myr. The correlation is moderate from 1000 to 400 kyr then poor in the upper 400 kyr of the record. Because this [(S/(I + C)] ratio was shown to be related to climatic conditions, it was chosen as a proxy for East Asian monsoon variability (Liu et al., Reference Liu, Trentesaux, Clemens, Colin, Wang, Huang and Boulay2003). A lower ratio indicates a stronger winter monsoon during glacials, whereas a higher ratio indicates stronger summer monsoon winds during interglacials. Such clay mineral variability over glacial/interglacial periods is related to the provenance of clay minerals and their transport by surface marine currents and seasonal monsoon winds through the SCS (Liu et al., Reference Liu, Colin, Li, Zhao, Tuo and Chen2010).
Spectral analysis of the chosen clay mineral ratio at ODP Site 1146 revealed a strong peak at 41 kyr, suggesting a dominant orbital control by obliquity over the past 1.8 Myr (Liu et al., Reference Liu, Trentesaux, Clemens, Colin, Wang, Huang and Boulay2003). Among the orbital parameters, obliquity exerts its main influence at low latitudes (Nesje & Dahl, Reference Nesje and Dahl2000), with a significant influence on the monsoon. However, the three orbital parameters play a role in the strength of the seasonal monsoon system (Lupien et al., Reference Lupien, Uno, Rose, deRoberts, Hazan, de Menocal and Polissar2023): precession influences the monsoon strength over 21 kyr cycles by modulating the pressure and temperature contrasts between oceans and continents; eccentricity modulates the amplitude of precession variability at a given latitude; and obliquity controls the latitudinal and seasonal distribution of insolation.
In addition to the analysis of the whole interval, Liu et al. (Reference Liu, Trentesaux, Clemens, Colin, Wang, Huang and Boulay2003) also performed a spectral analysis on 10 successive 200 kyr-long intervals to determine whether there had been any evolution of the main orbital control over time (Liu et al., Reference Liu, Trentesaux, Clemens, Colin, Wang, Huang and Boulay2003). The results revealed the strongest obliquity influence in the interval between 1.6 and 1.2 Myr, suggesting a major influence of monsoon-related transport processes. Between 1.2 and 0.6 Myr, two periods at 41 and 100 kyr were observed. Their common occurrence probably recorded the combined influence of monsoon (controlled by 41 kyr cycles) and glacial/interglacial sea-level changes (controlled by 100 kyr cycles). For the last 600 kyr, there was a peak at 100 kyr, suggesting a main contribution of glacial/interglacial sea-level changes in the clay variability. In summary, Liu et al. (Reference Liu, Trentesaux, Clemens, Colin, Wang, Huang and Boulay2003) found a change in the main orbital control affecting the clay mineral assemblage, with a major shift at 1.2 Myr attributed to the extension of the glaciations in the Northern Hemisphere. However, it is important to remember that the resolution that can be reached in this analysis depends on the length of the time series (Martinez et al., Reference Martinez, Pellenard, Deconinck, Monna, Riquier and Boulila2012). In practice, at least 5–10 repetitions along the studied time series are required to interpret a period with confidence (Weedon, Reference Weedon2003). Here, the studied intervals are quite short (200 kyr) relative to the revealed periodicity, especially for eccentricity (100 kyr) and, to a lesser extent, for obliquity (41 kyr; Fig. 4).
A similar approach but with a higher temporal resolution (1 kyr) was conducted on the clay mineral record of the nearby ODP Site 1145 (location on Fig. 6; Boulay et al., Reference Boulay, Colin, Trentesaux, Frank and Liu2005). The [S/(I + C)] ratio displayed a similar range of variation (0.30–1.55) to that for ODP Site 1146 (Liu et al., Reference Liu, Trentesaux, Clemens, Colin, Wang, Huang and Boulay2003). A major influence of precession was shown by Blackman–Tukey spectral analysis. Precession is a major forcing factor of the summer monsoon intensity (Prell & Van Campo, Reference Prell and Van Campo1986; Prell & Kutzbach, Reference Prell and Kutzbach1987), as observed in the Indian Ocean (e.g. in the Arabian Sea (Clemens et al., Reference Clemens, Prell, Murray, Shimmield and Weedon1991) or the Andaman Sea (Colin et al., Reference Colin, Turpin, Bertaux, Desprairies and Kissel1999)). Moreover, a strong relationship was found between the clay mineralogy and the solar insolation curve calculated at a latitude of 20°N (Boulay et al., Reference Boulay, Colin, Trentesaux, Frank and Liu2005). Each maximum of the insolation curve corresponds to an increase in the [S/(I + C)] ratio, indicating direct control of the monsoon over the clay mineral composition of sediments. By contrast, no link was found with glacial/interglacial cycles. In their work, Boulay et al. (Reference Boulay, Colin, Trentesaux, Frank and Liu2005) confirmed that the [S/(I + C)] ratio can be used as proxy to reconstruct variations in Southeast Asian monsoon intensity in the northern part of the SCS.
North Atlantic Ocean: deep oceanic currents and glacial/interglacial variability
Site description
The northern North Atlantic basins play a key role in the formation of the North Atlantic Deep Water (NADW; Fig. 7), an essential component of the global thermohaline circulation that controls interhemispheric heat exchanges (Broecker & Denton, Reference Broecker and Denton1989). The NADW results from a combination of three components: the Northeast Atlantic Deep Water (NEADW), the Denmark Strait Overflow Water (DSOW) and the Davis Strait Overflow (DSO; Dickson & Brown, Reference Dickson and Brown1994; Lucotte & Hillaire-Marcel, Reference Lucotte and Hillaire-Marcel1994). The NEADW and DSOW are driven in an anticlockwise gyre from the southern tip of Greenland to the outlet of the Labrador Sea by the Western Boundary Undercurrent (WBUC; McCartney, Reference McCartney1992). The NADW, produced offshore from Newfoundland, first flows southwards, then mixes with Circumpolar Deep Water in the Southern Hemisphere and returns back to northern latitudes through the Indian and Pacific oceans (Broecker, Reference Broecker1991). Numerous studies have shown variable intensity of the NADW over glacial and interglacial cycles (e.g. Ledbetter & Balsam, Reference Ledbetter and Balsam1985; Boyle, Reference Boyle1995; Barker et al., Reference Barker, Knorr, Vautravers, Diz and Skinner2010), but also over shorter (millennial) timescales (e.g. Bond et al., Reference Bond, Kromer, Beer, Muscheler, Evans and Showers2001; Oppo et al., Reference Oppo, McManus and Cullen2003).
Locations of studied coring sites in the Labrador Sea. The deep circulation patterns in the northern North Atlantic basin are adapted from Dickson & Brown (Reference Dickson and Brown1994) and Lucotte & Hillaire-Marcel (Reference Lucotte and Hillaire-Marcel1994). The light grey lines indicate water depth. DSO = Davis Strait Overflow; DSOW = Denmark Strait Overflow Water; ISOW = Iceland Sea Overflow Water; NADW = North Atlantic Deep Water; NAMOC = North-West Atlantic Mid-Ocean Channel; NEADW = North-East Atlantic Deep Water; NWADW = North-West Atlantic Deep Water; WBUC = Western Boundary Undercurrent.

In the deep North Atlantic basins, clay minerals are mainly detrital, derived from the weathering of adjacent continental masses (Biscaye, Reference Biscaye1965; Piper & Slatt, Reference Piper and Slatt1977; Zimmermann, Reference Zimmerman1982). The clay mineral assemblages in surface sediments of northern North Atlantic basins display a clear spatial distribution (Fagel et al., Reference Fagel, Robert and Hillaire-Marcel1996). The greatest abundances of smectite were observed in the Iceland (>60%; Fig. 7) and Irminger (57%; Fig. 7) basins. In the Labrador Sea, illite and chlorite were the most common clay minerals on the Canadian margin (29–39% and 21–29% respectively). They were associated with up to 30% vermiculite at shallow depths (≤530 m) but only traces of vermiculite at greater depths (>2650 m). Smectite, which was absent in the shallowest sites of the Canadian margins, occurred at greater depths (>2650 m) along both Labrador Sea margins. The greatest smectite abundance was measured on the continental rise of both Labrador Sea margins, within a water depth of 2800–3400 m, a depth interval consistent with the axis of maximum velocity of the WBUC. As a supply from the adjacent Greenland and Canadian margins is improbable, the WBUC is most probably responsible for the transport of smectite-rich material from the eastern Iceland and Irminger basins and for their sedimentation in the Labrador Sea (Fagel et al., Reference Fagel, Robert and Hillaire-Marcel1996). This observation shows that clay minerals may be used as proxies for deep circulation. The clay mineral variability in Labrador Sea sediments was therefore used as a proxy for deep-water sediment transport over glacial/interglacial cycles (Fagel et al., Reference Fagel, Hillaire-Marcel and Robert1997b; Fagel & Hillaire-Marcel, Reference Fagel and Hillaire-Marcel2006).
Materials and methods
Three cores drilled in the Labrador Sea were analysed. ODP Site 646 (58012.26’N, 48°22.15’W) was located off Greenland, on the upper flank of the Eirik Ridge sediment drift, below the axis of maximum velocity of the WBUC (Fig. 7; Fagel & Hillaire-Marcel, Reference Fagel and Hillaire-Marcel2006). Two cores – 646A (water depth of 3462 m) and 646B (water depth of 3459 m) – were combined into a composite section using magnetic and lithostratigraphic correlations (Srivastava et al., Reference Srivastava, Arthur, Clement, Aksu, Baldauf and Bohrmann1987). The upper 150 cm of sediments are only made of biogenic carbonates. At greater depth, the sediments are made of clayey and silty muds with a variable abundance of detrital carbonate-rich sandy layers, interpreted as turbiditic deposits. Oxygen isotope ratios measured from planktonic foraminifers were combined using biostratigraphy and magnetostratigraphy to define an age-depth model. The upper 32 m of core 646 were subsampled at 20 cm intervals (173 samples) for clay mineralogical analyses. This interval covered several glacial and interglacial periods, corresponding to the last 365 kyr (MISs 1–10). The sampling resolution was of 2500 years.
A second core (HU90-013-013; 58°12.59’N, 48°22.40’W) was collected on the south-west of Greenland Rise, north of the Eirik Ridge, at a water depth of 3380 m (Fig. 7). The site is bathed by DSOW overlain by NEADW (Lucotte & Hillaire-Marcel, Reference Lucotte and Hillaire-Marcel1994). The upper 530 cm of the core were composed of clayey silts and silty clays. Two sandy layers at 440–450 and 505–510 cm were interpreted as ice-rafted debris. Samples were retrieved between 240 and 530 cm, an interval covering the Last Glacial/Holocene transition (~8–26 kyr) according to the age model (Fagel et al., Reference Fagel, Hillaire-Marcel and Robert1997b). Sampling every centimetre provided a resolution between 10 and 160 years according to the sedimentation rate. The glacial interval (MIS2) was characterized by lower sedimentation rates (10 cm kyr–1) than those of the Holocene interval (MIS1, > 30 cm kyr–1; Hillaire-Marcel et al., Reference Hillaire-Marcel, de Vernal, Bilodeau and Wu1994).
A third core (HU91-045-094; 50°12.26’N, 45°41.14W) was retrieved from the southern Labrador Sea, in a deep channel on the Orphan Knoll at a water depth of 3448 m (Fig. 7). The bottom water mass is DSOW-like for core HU90-013-013. The 400 cm-long sediment core consisted of clays interlayered with abundant 10–40 cm-thick sandy layers. These layers displayed ice-rafted debris and a great detrital carbonate content, suggesting that ice surges on the Hudson Strait shelf (Andrews et al., Reference Andrews, MacLean, Kerwin, Manley, Jennings and Hall1995) triggered turbidites to flow down the North Atlantic Mid-Ocean Channel corresponding to these sediment layers (see location in Fig. 7; Hillaire-Marcel et al., Reference Hillaire-Marcel, de Vernal, Bilodeau and Wu1994). Such events were interpreted as the final collapse of the Laurentide ice sheet (Andrews et al., Reference Andrews, MacLean, Kerwin, Manley, Jennings and Hall1995). The core was subsampled at a lower resolution than core HU90-013-013 due to the presence of turbidite layers. A total of 68 samples were selected from 13 sediment intervals separating the turbidite layers.
For the three cores, the clay mineralogy was determined by XRD on the carbonate-free <2 μm fraction. Oriented mounts, prepared according to the glass slide method (Moore & Reynolds, Reference Moore and Reynolds1997), were analysed on a Siemens diffractometer with Co-Kα radiation. Semi-quantitative estimation of clay minerals was derived from the peak areas of smectite (17 Å), illite (10 Å) and chlorite + kaolinite (7 Å) on the traces from the glycolated XRD mounts, determined by multiplying peak heights by widths at mid-height (Fagel et al., Reference Fagel, Hillaire-Marcel and Robert1997b). The peak heights of kaolinite at 3.57 Å and chlorite at 3.54 Å were measured to estimate their relative proportions (Biscaye, Reference Biscaye1965). For the two cores located on the Greenland Rise (ODP646 and HU90-013-013), the clay mineral variation was expressed by the relative abundance of smectite and illite defined as their peak area ratio (S/I). In addition, the accumulation rates of smectite and illite (i.e. clay fluxes) were also evaluated by using Equation 1 (Fagel et al., Reference Fagel, Hillaire-Marcel and Robert1997b):

where δ is the mean clay mineral density (g cm–3), SAR is the sediment accumulation rate (cm kyr–1), % clay mineral is the abundance of the clay mineral in the fine <2 μm fraction determined by XRD and % clay-sized fraction is the proportion of the <2 μm fraction in the bulk sediment.
Results and interpretation
At ODP Site 646, the clay mineral assemblage comprises on average ~60% smectite, ~20% illite and similar proportions of chlorite and kaolinite (each ~10%; Fig. 7). According to the distribution of smectite in the surface sediments of the Iceland, Irminger and Labrador Sea basins, smectite was interpreted as being of distal origin, supplied by deep current from the eastern Irminger and Iceland basins, whereas illite and chlorite were proximal, delivered to the Labrador Sea from the erosion of the Greenland margin (Fagel et al., Reference Fagel, Robert and Hillaire-Marcel1996). Systematic changes were observed between glacial and interglacial intervals in core 646, where interglacials displayed greater abundance of smectite, except for the Holocene (40%), whereas glacial intervals showed a marked drop in smectite (≤40%) and a corresponding increase in illite and chlorite. Such variability indicated changes of mineral provenance over glacials/interglacials, with increased distal supplies of smectite by the deep WBUC from the smectite-rich Irminger and Iceland basins into the Labrador Sea (Fagel et al., Reference Fagel, Robert and Hillaire-Marcel1996). The relative clay mineral abundances were converted into clay fluxes (Fagel et al., Reference Fagel, Hillaire-Marcel and Robert1997b). The illite fluxes were systematically greater (×2) during glacial intervals than interglacial ones, recording greater contributions from the proximal Greenland margin. By contrast, the smectite fluxes remained stable over the last 365 kyr, indicating a constant supply by the deep currents from the more distal Irminger and Iceland basins. The surface sediments, however, displayed a marked increase in clay flux, which is probably due to the peculiar modern deep circulation conditions.
In core HU90-013-013 (Fig. 7), the smectite abundance averages 55% ± 10%, with a broad range of variation (20–75%). The illite abundance ranges between 10% and 45%, averaging 21% ± 6%. Smectite gradually increases over the Glacial/Holocene transition (14 kyr), whereas illite decreases. The S/I ratio increased by a factor of 4 between the Last Glacial Maximum (20 kyr) and the early Holocene, reaching a maximum at 9 kyr. The smectite flux increased by a factor of 7 above the Late Glacial/Holocene transition, reaching 28 g cm–2 kyr–1 in the uppermost studied sample (240 cm, early Holocene). By contrast, the range of variation for illite flux is narrow (2–9 g cm–2 kyr–1). The observed increased supply of smectite at and above the Late Glacial/Holocene transition is consistent with increased distal smectite-rich sediment supplies from the eastern basins into the Labrador Sea. The maximum S/I ratio value at ~9 kyr probably reflects the rapid velocity of the WBUC.
At the outlet of the Labrador Sea, no modification of clay mineralogical composition occurred through depth/time in core HU91-045-014 (Fig. 7). Smectite ranged between 18% and 60% (average 38% ± 10%), with alternation occurring between smectite-rich and smectite-poor layers. The other clay minerals had a narrower range of variation (averages: illite 28% ± 5%, chlorite 19% ± 4%, kaolinite 15% ± 3%), with greater abundance than in core HU90-013-013 (Fagel et al., Reference Fagel, Hillaire-Marcel and Robert1997b). The smectite-rich layers had no carbonate sands, whereas the smectite-poor layers were carbonate-rich. Therefore, the generally lower abundance of smectite in core HU91-045-014 than in core HU90-013-13 is mainly due to dilution by detrital carbonate inputs originating from Hudson Bay (Andrews et al., Reference Andrews, MacLean, Kerwin, Manley, Jennings and Hall1995). Therefore, in this case, low smectite abundance cannot be said to indicate a slower WBUC because the palaeocurrent information was erased by the carbonate deposits.
Clay variability in lacustrine sediments
Lake sediments (Table 2) represent valuable archives of past environmental changes on the continents, providing a continuous and sensitive record of changing conditions and processes occurring within lakes and in their surrounding catchments (Anselmetti et al., Reference Anselmetti, Ariztegui, Hodell, Hillesheim, Brenner and Gilli2006). Three types of minerals are present in lake sediments (Last, Reference Last, Last and Smol2004). Detrital or allogenic minerals are brought into the lake via lake margin erosion, surface streams, landslides, slumping and/or aeolian dust. Endogenic minerals are formed in the water column by biologically induced or abiotic chemical precipitation. Authigenic minerals result from early diagenesis of sediment deposited at the lake bottom by chemical reactions in the interstitial waters of the sediments. In lakes, the geology of the watershed and the soil composition have greater influence on the detrital supplies than in marine environments (Boyle, Reference Boyle, Last and Smol2004). Detrital minerals reflect the interaction between provenance, nature and intensity of weathering processes within the watersheds, tectonic settings and transport agents into the lake, and they are useful for tracking climate changes in the watersheds. The endogenic minerals probably indicate the chemical and limnological conditions of the water column at the time of mineral formation (Last, Reference Last, Last and Smol2004). The interpretation of authigenic minerals, although more complex, may supply information on palaeoenvironmental conditions (Last, Reference Last, Last and Smol2004). Moreover, water-level variations in lakes reflect the balance between precipitation and evaporation, recording climate changes (Last, Reference Last, Last and Smol2004), especially in closed lakes (with inlets but without outlets). As for oceanic basins, an International Continental Scientific Drilling Program (ICDP) was launched in 1996, and, to date, ~60 drilling projects have been developed (Harms et al., Reference Harms, Koeberl and Zoback2007).
Lake Baikal: glacial/interglacial variability and fluviatile supplies
Site description
The Baikal Drilling Program (BDP) was the first initiative, begun in 1993, of long coring in continental settings, and it was developed with the aim to provide a continental archive ‘with the same scientific and chronostratigraphic integrity as marine records’ (Williams et al., Reference Kuzmin, Karabanov, Kawai and Williams2001). Located in south-central Siberia, Lake Baikal (Fig. 8) is the largest (636 km long × 79 km wide, 31.722 km2) and deepest (1642 m) lake in the world. It is located in an active tectonic rift zone, unaffected by continental ice sheets and out of direct oceanic influence (Hutchinson et al., Reference Hutchinson, Golmshtok, Zonenshain, Moore, Scholz and Klitgord1992). Its thick sedimentary cover (up to 5000 m) records tectonic and climatic changes over the last 20–40 Myr (Williams et al., Reference Williams, Peck, Karabanov, Prokopenko, Kravchinsky, King and Kuzmin1997). Lake Baikal sediments constitute powerful archives of past climate over Plio-Pleistocene glacial/interglacial cycles for south-central Siberia over the past 5 Ma (Williams et al., Reference Williams, Peck, Karabanov, Prokopenko, Kravchinsky, King and Kuzmin1997; Grachev et al., Reference Grachev, Vorobieva and Likoshway1998; Kuzmin et al., Reference Kuzmin, Karabanov, Kawai and Williams2001). Coring sites in the southern (BDP-93; BDP-93 End-Members, 1995) and northern basins (BDP-96, BDP-98; Fig. 8; Grachev et al., Reference Grachev, Vorobieva and Likoshway1998; Karabanov et al., Reference Karabanov, Prokopenko, Williams and Khursevich2000; Prokopenko et al., Reference Prokopenko, Karabanov, Williams and Khursevich2002) showed that Lake Baikal sediments were sensitive to climate fluctuations because there was greater diatom abundance during interglacial intervals and lower diatom abundance during glacial intervals. Lake Baikal provided an interesting opportunity to test the use of clay minerals for palaeoclimatic interpretation in a continental environment (e.g. Yuretich et al., Reference Yuretich, Melles, Sarata and Grobe1999; Sakai et al., Reference Sakai, Minoura, Soma, Tani, Tanaka and Nara2005). At present, Lake Baikal is fed by 90% river supplies, 8% atmospheric supplies and 2% groundwater discharges (Lomonosov et al., Reference Lomonosov, Khaustov, Gvozdkov and Shpeizer1995). Lake Baikal is mainly supplied by three rivers: the Selenga River (2172 kT yr–1) in the southern sector of the lake, the Barguzin River (178 kT yr–1) on the eastern side of the lake and the Upper Angara River (430 kT yr–1) in the northern sector of the lake (Fig. 8), supplying 94% of annual particulate input. The types of source rocks in the Lake Baikal watershed were characterized and quantified using spatial analyses of Geographic Information System datasets (Fagel et al., Reference Fagel, Thamó-Bózsó and Heim2007). Palaeozoic granitoids dominate the watershed of the Selenga River (56%) with Cenozoic volcanic rocks (16%), mainly basalts, Tertiary and Quaternary sedimentary rocks (11%) and metamorphic Precambrian schists (7%). Archaean and Proterozoic intrusive rocks dominate in the Barguzin (50%) and Upper Angara (40%) watersheds. In terms of mineralogy, illite is the predominant mineral, derived from the micas of Proterozoic and Archaean granites outcropping on the south-east margin of the lake (Galasy, Reference Galasy1993). Chlorite, the second detrital clay mineral in the catchment of Lake Baikal, is mainly sourced from the Proterozoic metamorphic belt (schists, quartzites) along the western flank of the lake, south of the Siberian platform. The composition of secondary minerals varies according to the rate of weathering, which is controlled by the composition of parental rocks, topography and climate (Chamley, Reference Chamley1989). Therefore, the lacustrine sediments are expected to present a variable mineralogy through time.
Coring locations in Lake Baikal from various drilling campaigns: BDP (black circles; Yuretich et al., Reference Yuretich, Melles, Sarata and Grobe1999; Williams et al., Reference Kuzmin, Karabanov, Kawai and Williams2001); VER (abbreviation derived from the name of the Russian vessel RV Vereshagin; grey circles; Horiuchi et al., Reference Horiuchi, Minoura, Hoshino, Oda, Nakamura and Kawai2000; Fagel et al., Reference Fagel, Boski, Likhoshway and Oberhaensli2003); CON (Continent European proposal EVK2-CT-2000-00057; white circles; Fagel & Boës, Reference Fagel and Boës2008; Fagel & Mackay, Reference Fagel and Mackay2008).

The long-term evolution of clay mineral assemblages over a few hundred thousand years was investigated at a few coring stations on Buguldeika Saddle (Melles et al., Reference Melles, Grobe, Hubberten and Horie1995; Yuretich et al., Reference Yuretich, Melles, Sarata and Grobe1999) and Academician Ridge (Fagel et al., Reference Fagel, Boski, Likhoshway and Oberhaensli2003). Clay mineral data from BDP-93 cores from the Southern Central Basin (Yuretich et al., Reference Yuretich, Melles, Sarata and Grobe1999) showed that during the last 350 kyr there was a systematic increase of smectite in diatom-bearing sediments, indicating that a climate signature could be recorded in the clay-size fraction, which prompted further studies. Similarly to diatom productivity, the changes in smectite abundance were explained by temperature. Assuming all smectite is derived from soils, the observed trend by which smectite increased in warmer periods would reflect increased hydrolysis within the watershed during interglacials (Yuretich et al., Reference Yuretich, Melles, Sarata and Grobe1999). Subsequent studies are described here.
Materials and methods
Core VER98-1-3 was drilled on the northern part of Academician Ridge (53°44’56”N, 108°19’02”E) at a water depth of 373 m (Fig. 8). Academician Ridge is an intra-rift accommodation zone separating the central and north Baikal basins (Mats et al., Reference Mats, Khlystov, De Batist, Ceramicola, Lomonosova and Klimansky2000). The total length of the core was 1092 cm, but its lower part (835–1092 cm) was disturbed during the coring and therefore not investigated further (Fagel et al., Reference Fagel, Boski, Likhoshway and Oberhaensli2003). The sediment was made of clayey silty layers interbedded with several decimetre-thick massive or faintly laminated diatom-rich layers. The diatom-rich intervals were attributed to warm (interglacial) intervals characterized by enhanced biological productivity. The clay-rich intervals that are either massive, coarsely to finely laminated or bioturbated (Fagel et al., Reference Fagel, Boski, Likhoshway and Oberhaensli2003) were associated with colder (glacial) intervals. In core VER98-1-3, the abundance of diatoms followed a pattern similar to the standard marine oxygen isotope curve (SPECMAP) that records glacial/interglacial fluctuations. In sediments from Lake Baikal, the correlation between the diatom content and SPECMAP, the latter calibrated with radiocarbon dates for the latest Quaternary and Holocene, was indeed used as a stratigraphic tool (Grachev et al., Reference Grachev, Vorobieva and Likoshway1998) to extrapolate further back in time (before 35 kyr). In this study, the age model was based on the correlation between the depths at which diatom assemblages VII–XV were found in reference sections from Academician Ridge (Likhoshway, Reference Likhoshway, Manami, Idei and Koizumi1998) and in core VER98-1-3. Assuming a constant sediment accumulation rate, the biostratigraphic correlation suggested that the last 54 kyr, corresponding to the uppermost 2.8 m of the sediments, are missing. The upper 8 m of core VER 98-1-3 probably recovered a time interval from 55 to 250 kyr, covering four interglacial/glacial intervals, labelled oxygen isotope stages (OISs) 4 to 8.
Core CON01-603-2a (53°96’N, 108°91’E, water depth of 386 m) was drilled in the northern basin of Lake Baikal on an extension of Academician Ridge called Continent Ridge (Fagel & Boës, Reference Fagel, Hillaire-Marcel and de Vernal2007). The sediment from bottom to top was composed of silty clays with a few layers of diatoms (128–141 cm, unit 3), finely to coarsely laminated clayey silts to silty clays with abundant diatoms (9.5–128 cm, unit 2) and diffuse to finely laminated diatom-rich mud (0–9.5 cm, unit 1). The age model was derived from magnetic susceptibility and anhysteresis remanent magnetization measurements (Demory et al., Reference Demory, Nowaczyk, Witt and Oberhänsli2005) by correlation with the ODP 984 reference site (Noth Atlantic; Channell, Reference Channell1999) using seven correlation points between 10.5 and 141.8 cm (Fagel & Boës, Reference Fagel and Boës2008). In core CON01-603-2a, the sedimentation rate averaged 10 cm kyr–1 in the middle unit (unit 2). The lowest sedimentation rates (~3.8 cm kyr–1) were observed in unit 3 and at between 66 and 89 cm in unit 2. The entire core covered the last 22 kyr, with the Late Glacial/Holocene transition happening at 76 cm. The age of the surface sediments was estimated at 2.8 kyr BP by extrapolation of the youngest measured sedimentation rate.
Core CON01-604-2a (52.08°N, 105.86°E) was retrieved on Posolsky Bank (Fig. 8) in the vicinity of the Selenga River delta at a water depth of 133 m (Fagel & Boes, Reference Fagel, Hillaire-Marcel and de Vernal2007). Posolsky Bank is a tilted fault block within the Selenga Delta Accommodation Zone (Hutchinson et al., Reference Hutchinson, Golmshtok, Zonenshain, Moore, Scholz and Klitgord1992). The sediments consisted of homogeneous silty clays at the bottom (105–110 cm, unit 3), coarsely to finely laminated silt (25–105 cm, unit 2) and homogeneous mud at the top unit (0–25 cm, unit 1). The palaeomagnetically derived age models for core CON01-604-2a (Demory et al., Reference Demory, Nowaczyk, Witt and Oberhänsli2005) were constrained by seven correlation points between 9 and 130 cm with the ODP984 reference site (Channell, Reference Channell1999). In core CON01-604-2a, the sedimentation rates ranged between 6.5 and 9.2 cm kyr–1 in unit 2 and increased in both the upper and lower lithological units (11 cm kyr–1 in unit 1, 16 cm kyr–1 in unit 3). The entire core represented an interval ranging between 2.4 and 14 kyr, with the Late Glacial/Holocene transition occurring at 75–76 cm (Fagel & Boës, Reference Fagel and Boës2008).
The mineralogy of core VER98-1-3 was studied with XRD at low resolution (1 sample per 10 cm), whereas XRD analyses were performed at every centimetre in cores CON01-603-2a and CON01-604-2a, corresponding to an average temporal resolution of ~100 years. Qualitative and semi-quantitative estimations of clay mineral assemblages were based on XRD peak intensity measurements made on oriented, glycolated aggregates (Fagel et al., Reference Fagel, Boski, Likhoshway and Oberhaensli2003), and these analyses were also accompanied by those of air-dried and heated samples for comparison. XRD analysis was carried out on a Philips PW 1390 diffractometer using Cu-Kα radiation. Smectite presence was indicated in two ways. First, illite–smectite was indicated by a shoulder of the low-angle side of a peak at 14 Å (Thorez, Reference Thorez and Lelotte1976). The abundance of this illite–smectite phase was estimated by the difference between the intensity of the 10 Å peak before and after heating (Boski et al., Reference Boski, Pessoa, Pedro, Thorez, Dias and Hall1998). Second, a peak was observed at ~17 Å on both the air-dried and glycolated samples. This behaviour is common in soils and was interpreted as being due to the presence of Al-hydroxides within the interlayers, called here Al-smectite (Thorez, Reference Thorez2000). The 10 Å peak indicated illite, while those at ~14 Å and ~7 Å indicated chlorite and kaolinite.
For clay mineral quantification, the intensity of the 10 Å peak was used as a reference and the peaks of the other minerals were divided by a weight factor (2.5 for 10–14 Å and chlorites, 1.4 for kaolinite, 5 for Al-smectite) and all identified clay species were normalized to 100%. These corrective factors were determined empirically at the University of Liège (J. Thorez, pers. comm. 2001). An S/I ratio was estimated on the glycolated diffractograms, reflected the abundance of illite–smectite and Al-smectite relative to illite. Assuming all smectites formed by transformation processes, the S/I ratio may be used as a proxy for hydrolysing conditions in the lake watershed (Fagel & Boës, Reference Fagel and Boës2008).
In addition, Li saturation was performed on samples from core VER98-1-3 to investigate the composition of smectite. The abundances of montmorillonite and beidellite were estimated by comparing the intensities of the 10 Å peak on the XRD runs of three Li-saturated samples (Thorez, Reference Thorez1998) as follows: montmorillonite = I(Li-300GL) – I(LiN); beidellite = I(Li-300) – I(Li-300GL), where GL is glycerol solvation. The relative contribution of Al-smectite was based on the intensity of the 17 Å peak in the Li-300 trace, which was then reported on the glycolated trace (Fagel & Boës, Reference Fagel, Hillaire-Marcel and de Vernal2007).
Results and interpretation
The mean clay mineral composition of core VER98-1-3 was 40% illite, 25% illite–smectite, ~3% Al-smectite, 16% kaolinite, 11% chlorite and 5% irregular mixed-layer illite–chlorite (Fagel et al., Reference Fagel, Boski, Likhoshway and Oberhaensli2003). The S/I ratio fluctuates by a factor of 4 throughout the core (Fig. 9a), with the highest values occurring during or near the termination of the diatom-rich intervals (reported as grey intervals in Fig. 9). The diatom-rich intervals, which indicated periods of greater productivity during warmer conditions (interglacial period), were usually characterized by greater abundance of beidellite (up to 14% in OIS 5e; Fig. 9c), with the warmer conditions favouring the transformation of mica/illite into beidellite (Fig. 9c). In most interglacial intervals, the greater abundance of beidellite is associated with a slight increase in Al-smectite (Fig. 9c). Such hydroxy-interlayered minerals are common in soils with low levels of organic matter and that are stable in oxidizing and moderately acidic conditions (Rich, Reference Rich1968; Meunier, Reference Meunier2007). By contrast, during glacial oxygen isotope stage 6, the relatively high S/I ratios record a greater contribution of montmorillonite (Fig. 9b). This could be explained by additional supplies of sedimentary smectites reworked by erosion from the watershed during glacial intervals. Those smectites were most probably derived from the erosion of Jurassic and/or Cretaceous sandstones and claystones outcropping in the Selenga River watershed (Fagel et al., Reference Fagel, Boski, Likhoshway and Oberhaensli2003). Therefore, only a part of the lacustrine clay assemblage appeared to record weathering conditions in the watershed. Generally, the climate significance of the proxy S/I ratio must be interpreted cautiously if reworked clay minerals are suspected.
(a) Evolution of the smectite/illite ratio (17 ÅEG/10 ÅEG) with depth in core VER98-1-3. The grey bands indicate the interglacial intervals, and in white are the glacial periods, labelled according to the SPECMAP oxygen isotope stages. (b) Relative abundance of montmorillonite in the <2 μm size fraction. (c) Relative abundance of beidellite (continuous curve) and Al-smectite (dashed curve). The numbers in the right margin represent the cumulated contribution of beidellite and Al-smectite (in %) within the total clay fractions of interglacial intervals.

The clay mineralogy in core CON01-604-2a (Fagel & Boes, Reference Fagel, Hillaire-Marcel and de Vernal2007) consists of illite (mean 47% ± 6%), smectite (27% ± 6%), chlorite (14% ± 3%), kaolinite (8% ± 2%) and traces of illite–smectite (2% ± 1%). Its mean clay assemblage is close to the representative signature of Selenga River surface sediments, characterized by a 54% illite, 20% smectite, 13% chlorite, 7% kaolinite, 3% illite–smectite and 2% Al-smectite (Fagel et al., Reference Fagel, Thamó-Bózsó and Heim2007). Most of the clay mineralogy changes in core CON01-604-2a correspond to the opposing trends between smectite and illite (Fig. 10a). The S/I ratio ranges between 0.10 and 1.15, with a low mean value (0.4 ± 0.4) for the studied interval (Fig. 10b). After the Late Glacial/Holocene transition (~12.2 kyr), the S/I ratio curve has a minimum during the Boreal period (10.3–8.0 kyr) and then increases, reaching a maximum during the Subboreal period (5.7–2.6 kyr; Fig. 10b).
(a) Evolution of smectite and illite abundance in core CON01-604-2a. Each line represents a four-point running average of the sample data. (b) Evolution of the smectite/illite (S/I) ratio (17 ÅEG/10 ÅEG) in core CON01-604-2a. (c) Evolution of the S/I ratio in core CON01-603-2a. The bold line represents a four-point running average of the S/I value of the cores. The S/I increases (marked by a grey intervals) are not related to palaeoclimate but correspond to changes in the sediment lithology, most probably related to a change of source. The chronostratigraphy columns in (c) and (d) (Khotinsky, Reference Khotinsky and Velichko1984) show the Late Glacial/Holocene transition, and in (a) and (b) they show the Younger Dryas/Preboreal transition (YD/PB; ~12.2 kyr BP; dashed line), the Preboreal/Boreal transition (PB/BO; ~10.3 kyr BP), the Boreal/Atlantic transition (BO/AT; ~8 kyr BP), the Atlantic/Subboreal transition (AT/SB; ~5.7 kyr BP) and the Subboreal/Subatlantic transition (SB/SA; ~2.6 kyr BP). (d) Evolution of the S/I ratio in core VER94/st.16 from the Academician Ridge (data from Horiuchi et al., Reference Horiuchi, Minoura, Hoshino, Oda, Nakamura and Kawai2000).

The clay record of core CON01-603-2a is composed of 37% ± 7% illite, 33% ± 8% smectite and 18% ± 5% chlorite (Fagel & Boes, Reference Fagel, Hillaire-Marcel and de Vernal2007). There is no obvious change in the clay assemblage composition at the Late Glacial/Holocene transition (Fig. 10c). Moreover, the variation in smectite does not perfectly mirror that of illite (not shown), because chlorite in this core is a significant clay mineral, especially in the Holocene. The S/I ratio ranges between 0.1 and 2.7 (mean 0.8; Fig. 10c). The S/I ratio remains low (mean 0.6) in the Late Glacial period, except in a silty layer observed at 18–19 kyr, where it reaches 1.8. After a minimum at the Preboreal/Boreal transition (10.3 kyr), the S/I ratio curve increases, although it is punctuated by several negative excursions. The maximum S/I ratio is reached during the Subboreal (~4.6 kyr) at 19 cm (Fig. 10c).
At both sites, S/I ratio values increase by a factor of 4 through the Holocene, reaching their maxima in the Subboreal (5.7–2.6 kyr). The S/I ratio followed a gradual but irregular increase throughout the Holocene. The slow warming over the Holocene period probably favoured the formation of smectite in Siberian soils. The highest S/I ratio values were also measured during the same Subboreal period in core VER94-16a recovered on Academician Ridge (Fig. 10d; Horiuchi et al., Reference Horiuchi, Minoura, Hoshino, Oda, Nakamura and Kawai2000). Therefore, in the three cores (CON01-603-2, CON01-604-2 and VER94-16), the highest S/I ratios observed at ~5 kyr lag by ~2 kyr behind the optimal Siberian Atlantic climatic period (AT in Fig. 10a), which was identified in soils from the Lake Baikal area (Vorobyova, Reference Vorobyova1994) and in sedimentary palynological assemblages in Siberia (Schirrmeister et al., Reference Schirrmeister, Siegert and Kuznetsova2002). This lag is probably due to the response time for soil re-equilibration.
To summarize, in Lake Baikal, the climate significance of clay assemblages at the scale of glacial/interglacial variability is mainly attested by a bimodal distribution between smectite (or illite–smectite) and illite caused by different clay sources and/or formation processes between cold glacial and warm interglacial periods. However, the variability at the millennial scale is less clear, possibly being affected by supplies of reworked sedimentary clays related to local tectonic events.
East African lakes: the palaeolake Chew Bahir – hydrological fluctuations related to arid and humid climate conditions
Site description
Since ~1970 CE, the East African Rift has been the subject of many palaeoanthropological and palaeoclimate studies searching for causal relationships between hominin evolution and climate changes (see Campisano et al., Reference Campisano, Cohen, Arrowsmith and Asrat1997 for a review). Ethiopia in particular is characterized by an impressive accumulation of Pliocene fossil hominins (e.g. Johanson et al., Reference Johanson, Taieb and Coppens1982) and late Pliocene flora and mammalian fauna (e.g. Bonnefille et al., Reference Bonnefille, Potts, Chalie, Jolly and Peyron2004; Reed, Reference Reed2008).
Within this framework, an ICDP project (the Hominin Sites and Paleolakes Drilling Project; HSPDP) was launched to collect palaeoenvironmental data from lacustrine sediments close to key palaeoanthropological sites in Kenya and Ethiopia (Cohen et al., Reference Cohen, Arrowsmith, Behrensmeyer, Campisano, Feibel and Fisseha2009, Reference Cohen, Campisano, Arrowsmith and Asrat2016; Campisano et al., Reference Campisano, Cohen, Arrowsmith, Asrat, Behrensmeyer and Brown2017, Foerstner et al., Reference Foerster, Asrat, Bronk Ramsey, Brown, Chapot and Deion2022). Among others, the Chew Bahir basin in south-west Ethiopia was analysed by Foerster et al. (Reference Foerster, Junginger, Langkamp, Gebru, Asrat and Umer2012) to reconstruct past environmental conditions and improve our understanding of the relationship between climate, environment and human dispersion in Africa. The Chew Bahir basin today is a dried-out saline mudflat laying in a transition zone between the Ethiopian Rift and the Omo-Turkana basin. This palaeolake was a closed basin (without any water outlet) receiving the totality of the weathering products from its catchment (Foertsner et al., Reference Foerster, Vogelsang, Junginger, Asrat, Lamb, Schaebitz and Trauth2015). The western margin of the Chew Bahir basin is the Hammar range, which consists of Precambrian gneissic rocks. On the eastern margin, the Teltelee-Konso range contains Miocene basalts and trachytes. Oligocene basalts outcrop at the northern margin of the lake. The basin was infilled by ~5 km of sediments since the Miocene rifting. The fluviatile supplies are limited to the northern part of the basin, whereas the western and eastern margins are drained by rain. No sediments are supplied from the south lake margin. Sediment influx is seasonal, related to rainfall events during the wet season and to wind during the dry season, when it may become dominant.
Materials and methods
The core CB-01-2009 was recovered from the western margin of the Chew Bahir basin (04°50.6’N, 36°46.8’E) near an alluvial fan extending eastwards from the Hammar range (Foerster et al., Reference Foerster, Junginger, Langkamp, Gebru, Asrat and Umer2012). The sediment core covers the uppermost 18.86 m of the deposits, corresponding to ~45 kyr according to six radiocarbon age measurements (mean sedimentation rate 0.7 mm yr–1). The lithology consists of silty clays intercalated with sandy layers and gravels. CB-01 records climate history spanning from 44 to 1.0 kyr, which includes the Last Glacial Maximum (18–23 kyr) and the African Humid Period (5–15 kyr) and ends at the onset of the Medieval Warm Period (700–1000 BP/950–1250 CE). The mineral content was determined by XRD analysis of bulk samples, using a Siemens D5000 diffractometer and the software EVA (Bruker) for qualitative phase identification. Elementary composition of the sediment core was determined by X-ray fluorescence with an Itrax core scanner (CS-XRF) equipped with a molybdenum tube. The core was scanned at 0.5 cm resolution with a voltage of 30 kV and a current intensity of 30 mA, with a scanning time per step of 20 s. The clay fraction was separated according to the protocol of Moore & Reynolds (Reference Moore and Reynolds1997) and analysed on an EMPYREAN PANalytical XRD device using Cu-Kα radiation. Three diffractograms were measured on oriented mounts for each sample (air-dried, ethylene glycol-solvated and heated at 550°C for 2 h). The phase identification was performed using HighScore Plus version 4.0 software.
Results and interpretation
The bulk mineralogy of core CB-01 consists mainly of illite associated with K-feldspars (orthoclase and sanidine). A mineralogical study of the clay fraction was performed for the last 20 kyr recorded on core CB-01 (Fig. 11). Its clay mineralogy varied between illite-rich and smectite-rich intervals including mixed-layer illite–smectite (Fig. 11; Foerster et al., Reference Foerster, Deocampo, Asrat and Günter2018). The different mineral compositions were interpreted to correspond to dry or wet climate. Groups corresponding to each of these two climates were established by CS-XRF of the cores, corresponding to high and low K content, respectively (Foerstner et al., Reference Foerster, Junginger, Langkamp, Gebru, Asrat and Umer2012). High K content would mean arid, unfavourable living conditions for humans, whereas low K content would indicate more favourable, humid conditions (Foerster et al., Reference Foerster, Vogelsang, Junginger, Asrat, Lamb, Schaebitz and Trauth2015). Such an interpretation is based on the transformation of smectite into authigenic illite during low lake levels. With more evaporation, the lake became more saline, favouring the formation of authigenic illite (Deocampo et al., Reference Deocampo, Behrensmeyer and Potts2010) by smectite illitization. Such a process was confirmed by the migration of the 060 XRD reflection from 1.517 Å (dioctahedral Al-smectite) to 1.533 Å (trioctahedral Mg-illite) indicating higher water salinity, as well as the higher proportion of illite in the corresponding samples (Foerstner et al., Reference Foerster, Deocampo, Asrat and Günter2018). The mineralogical results for the Chew Bawir basin confirmed marked climatic phases, such as the African Humid Period (15–5 kyr; cf. samples CB01-7a-544 and CB01-7b-616 in Fig. 11; Foerster et al., Reference Foerster, Deocampo, Asrat and Günter2018).
Comparison of XRD traces of air-dried (black curves) and ethylene glycol-solvated (blue curves) samples from oriented mounts of the fine fraction of CB-01 samples. The sample names are reported on the right. The last number in the labels corresponds to the core depth in centimetres. Three climate groups are assigned according to CS-XRF data: dry, wet and transition. The samples display a greater smectite proportion (best observed in the 16.9 Å peaks of ethylene glycol-solvated samples) in the wet climate phase. Modified from Foerstner et al. (Reference Foerster, Deocampo, Asrat and Günter2018).

East African lake: the palaeolake Lukeino in the Gregory Rift, Kenya – drainage intensity related to arid and humid conditions
Site description
The East African Rift valley is an active tectonic area with a particularly intense phase of rifting from the Cretaceous to the Miocene, leading to the formation of numerous graben lakes (Tiercelin & Lezzar, Reference Tiercelin, Lezzar, Odada and Olgado2002; Pickford et al., Reference Pickford, Senut and Cheboi2009) filled with lacustrine and fluviatile sedimentary deposits and later with Middle Miocene to recent volcanic rocks. Fault reactivation in the Tugen Hill area was responsible for the formation of the Lukeino depression in which the palaeolake Lukeino developed (Pickford, Reference Pickford1974). The base of the formation is made by the Kabernet trachyte of 6.09 ± 0.14 Myr. The Lukeino Formation is sealed by the Kaparaina basalts (5.68 ± 0.18 Myr) that filled the depression and obliterated the palaeolake (Pickford, Reference Pickford and Bishop1978; Sawada et al., Reference Sawada, Pickford, Senut, Itaya, Hyodo and Miura2002).
The Lukeino Formation outcrops along the central part of the East African Rift, east of the Tugen Hills in Kenya, over an area 44 km wide × 13 km long (Bamford et al., Reference Bamford, Brigitte Senut and Pickford2013). Sawada et al. (Reference Sawada, Pickford, Senut, Itaya, Hyodo and Miura2002) proposed a simplified lithological column of the Lukeino Formation, divided into three members from bottom to top: (1) the Kapgoywa Member between the Kabernet trachyte and the Kapsomin basalt; (2) the Kapsomin Member; and (3) the Kapcheberek Member located between the Rormuch Sill and the Kaparaina basalt (Fig. 12). The Lukeino Formation was interpreted as a fluvio-lacustrine sedimentary sequence made by clayey and sandy clayey deposits intercalated by the Kapsomin basalts and the injection of the Rormuch Sill (Fig. 12; Pickford, Reference Pickford1975, Reference Pickford and Bishop1978). This formation has yielded numerous floral, faunal and hominid remains (Bamford et al., Reference Bamford, Brigitte Senut and Pickford2013) and it is known for revealing the oldest East African bipedal hominid, called Orrorin tugenensis (Senut et al., Reference Senut, Pickford, Gommery, Mein, Cheboi and Coppens2001). This formation was investigated in detail to better constrain the environment in which the hominids lived (e.g. Pickford et al., Reference Pickford, Senut and Cheboi2009; Bamford et al., Reference Bamford, Brigitte Senut and Pickford2013).
(Left) Evolution of the mineralogical assemblages of the Lukeino Formation derived from bulk XRD. The stratigraphic positions of the three Kapgoywa, Kapsomin and Kapcheberek members were based on lithological observation, magnetic susceptibility measurements and positions of the volcanic rocks. (Right) Palaeoenvironmental interpretation of the Lukeino sedimentary deposits derived from the peak area ratio between smectite and kaolinite (modified from Dericquebourg, Reference Dericquebourg2016). The units correspond to sections 1, 2 and 3 on the left. K = kaolinite; S = smectite.

Materials and methods
Sedimentary samples were collected in 2004, 2010 and 2011 within the framework of the ‘Kenya Paleontological expedition’ lead by B. Senut and M. Pickford from the National Natural History Museum of Paris in France. In total, 14 geological sections from six sites (Aragai, Cheboit, Kapgoywa, Kapsomin, Kapcheberek and Sunbarua) were investigated to cover the whole sequence of the Lukeino Formation (Dericquebourg, Reference Dericquebourg2016). The sampling interval ranged between 0.1 and 1.0 m. The bulk mineralogy was studied on 480 horizons using a Bruker AXS D2-phaser equipped with Cu-Kα radiation and a rapid LynxEye detector (ISTeP, Université Pierre et Marie Curie, Paris). The analyses were carried out between 2 and 75°2θ, with a step of 0.02°2θ and a counting time of 0.1 s per step, using a voltage of 30 kV and a current intensity of 10 mA. XRD traces were analysed using MacDiff software (Petschick, Reference Petschick1997). The semi-quantitative abundance of the minerals was derived from the measurement of peak surface, with an uncertainty of ±5% (Moore & Reynolds, Reference Moore and Reynolds1997). Concerning the clay minerals, a kaolinite/smectite ratio was calculated from the surface ratios of the 001 peaks of kaolinite (7 Å) and smectite (15 Å) observed on the bulk XRD trace. This ratio was used to identify well-drained periods characterized by greater abundance of kaolinite over smectite (K/S > 1) and dry periods marked by the greater presence of smectite (K/S < 1), following a mineralogical study of Late Miocene fluvio-lacustrine deposits on the Ethiopian Plateau (Yemane et al., Reference Yemane, Robert and Bonnefile1987). In this study, the formation of both kaolinite and smectite was related to pedogenetic processes, as their distribution was not correlated with the presence of volcanic materials. In soils, kaolinite is abundant in high-relief areas and/or in warm and humid environments formed under efficient drainage increasing the removal of cations and a portion of the dissolved silica (Millot, Reference Millot1970; Chamley, Reference Chamley1989). Smectite is generally abundant in low-relief areas, where poor drainage prevents the removal of cations and silica. Its formation in soils is favoured by alternating wet and dry periods (Millot, Reference Millot1970; Chamley, Reference Chamley1989). Therefore, for the Ethiopian sedimentary sequence, Yemane et al. (Reference Yemane, Robert and Bonnefile1987) emphasized that intense rainfall favoured the formation and the subsequent erosion of kaolinitic soils, whereas smectite-rich soils are instead developed during drier periods. The same interpretation was applied for the Lukeino Formation, as presented below.
Results and interpretation
The evolution of the mineralogical assemblages of the Lukeino Formation and, in particular, the evolution of the K/S ratios indicated several changes in the palaeoenvironmental conditions of the catchment of the palaeolake Lukeino (Fig. 12; modified from Dericquebourg, Reference Dericquebourg2016). Three periods were identified:
(1) The first period (unit 1 in Fig. 12), was characterized by the absence or very low abundance of kaolinite (5%). Kaolinite was only present (up to 40%) as a major phase at the top of the Kapsomin Member (Fig. 12). Smectite was abundant (up to 60%) in the clay and silty clay layers across the sequence, with an average abundance of 45%. The K/S ratio was close to 0 in the greatest part of the sequence, except in the upper part, where the proportion of kaolinite is greater than smectite in several horizons (1.9 < K/S < 4.4). The low K/S ratio in unit 1 suggested a generally dry environment, with one peculiar stratigraphic interval characterized by intense evaporation (i.e. evaporitic layer in unit 1 in Fig. 12).
(2) The second period (unit 2 in Fig. 12) contained a high proportion of smectite (mean 60%) in the clay to silty clay layers. The kaolinite varied in the opposite way to smectite, with more kaolinite (30%) in the coarsest layers and less kaolinite (5%) in the finest layers. The K/S ratio displayed higher values than in unit 1, with a mean of 3.0 and a maximum of 11.5. The high proportion of kaolinite, associated with a greater content of quartz, suggested intense runoff with significant detrital supplies. This second interval coincided most probably with a well-drained phase. Moreover, the occurrence of phosphorite layers (Fig. 12), which were only observed in this period, emphasized the presence of dense vegetation in the watershed of the palaeolake (Dericquebourg et al., Reference Dericquebourg, Person, Segalen, Pickford, Senut and Fagel2015).
(3) The K/S ratio progressively decreased in unit 3 (Fig 12), ranging between 0.9 and 0 (mean 0.3). The decrease in kaolinite was interpreted as a return to drier conditions, leading to a drop in the lake level. Among the other non-clay minerals, this unit was marked by an increase in sanidine, a K-feldspar of volcanic origin. Its occurrence must be related to the pyroclastic deposits. The bulk mineralogy was also characterized by a lower abundance of quartz than in the other units, suggesting limited runoff during unit 2. Finally, the drier conditions (indicated by the low K/S ratio and low quartz abundance) and the volcanic activity (indicated by the presence of sanidine), related to the eruption of lavas of the Kaparaina basalts, were responsible for the sealing of the palaeolake Lukeino (Dericquebourg et al., Reference Dericquebourg, Person, Segalen, Pickford, Senut and Fagel2015; Dericquebourg, Reference Dericquebourg2016).
The clay mineralogical study in palaeolake Lukeino provides complementary information regarding the Miocene palaeoenvironments where hominids lived. Dericquebourg (Reference Dericquebourg2016) showed that the lower part of the Lukeino Formation, encompassing the Kapgoywa and the Kapsomin members, was characterized by rather dry conditions, in agreement with the interpretations of the carbon and oxygen isotopic compositions of the teeth of herbivores contemporary with Orrorin tugenesis (Roche et al., Reference Roche, Ségalen, Senut and Pickford2013). However, divergent conclusions were proposed for the Kapcheberek Member: more humid according to Roche et al. (Reference Roche, Ségalen, Senut and Pickford2013), but drier according to Dericquebourg (Reference Dericquebourg2016).
Synthesis
Here are reported some points to consider in clay mineral analysis:
• The use of clay minerals as a climate proxy is mainly valid for Cenozoic sediments for two main reasons: (1) Cenozoic sedimentation is less affected by burial diagenesis; and (2) the Cenozoic active tectonic and cold climate conditions favoured physical erosion, supplying greater detrital fluxes.
• Climate information may be derived either from clay mineral abundance in bulk or <2 μm fractions, the height or surface peak ratio between two clay minerals or the abundance ratio between two or three clay minerals. Among those approaches, the measurement on XRD traces of peak height or surface ratio between two minerals is the most objective, as it is not influenced by the method of quantification of the clay minerals. It is therefore difficult to compare the clay mineralogical results from different studies. The relative abundance of clay minerals is more robust than absolute values for comparison.
• The abundance of clay minerals is dependent on the analysed grain size. In most studies, the clay mineral assemblage is identified on the fine <2 μm fraction that usually concentrates the clay minerals. However, some clay minerals may belong to the fine silt fraction. The XRD analysis of the bulk sediment is an alternative approach that would account for all clay minerals, whatever their particle size. Mineralogical quantitative XRD bulk powder methods have been significantly improved over the last decade.
• Clay assemblages may contain clay minerals reworked from sedimentary outcrops rather than being formed during the studied periods. These clays must be identified, as they may provide misleading information regarding the climate. However, as clay minerals may be transformed under new climate and basin conditions, they may still prove of value.
• Climate control of clay mineral sedimentation has been demonstrated through the detection of changes in clay composition over periods in the range of the Earth's orbital parameters (eccentricity, obliquity and precession). However, linking clay sediments to orbital parameters requires accurate knowledge of their deposition ages. Moreover, the duration of the studied interval must be at least five times longer than the supposed time cycles to enable their robust interpretation.
• The interpretation of sedimentary clay minerals is made easier if the source areas and transport agents are known. Clay minerals are significantly controlled by the watershed conditions in proximal deposition environments, such as deltas. These controls are easiest to decipher in sediment basins where two source areas are characterized by two distinct clay mineralogies and different transport agents operate from each source. When several sources are involved, the use of isotopic tracers usually allows us to identify their potential sources.
• The numerous marine and lacustrine drilling projects conducted worldwide represent an impressive and interesting database from which to conduct further clay mineralogical studies on Cenozoic sediments.
Dedication
This manuscript is dedicated to the professors and researchers who initiated me into the world of clay minerals. In particular, I would like to thank professors Hervé Chamley and Pierre Debrabant from the University of Lille 1 (France), as well as Luc André, professor at the Université Libre of Brussels and researcher at the Royal Museum for Central Africa (Belgium). I completed my complementary master's degree (DEA) under the supervision of H. Chamley (1989–1990), then I joined his research team to perform my PhD thesis with P. Debrabant as promotor (1990–1993). L. André, who was already associated with my master's thesis at Université Libre of Brussels (1988–1989), was always present to give me advice on difficult career choices.
Acknowledgements
I thank all of the collaborators – professors, scientists, technicians and students – who have helped me over the years to deepen my understanding of the clay toolbox and its applications. This research was supported by both national (e.g. University of Liege, FNRS, WBI, BELSPO) and international (e.g. MRT France, CRSNG Canada, EU) funding agencies. Marttiina Rantala and Valentine Piroton are warmly thanked for their significant support in the preparation of the figures. I also acknowledge the two anonymous reviewers, the associate editor, Javier Cuadros, and the principal editor of Clay Minerals, George Christidis, for their positive comments and suggestions that allowed me to improve the text.
Conflicts of interest
The author declares none.



