

Introduction
The global coronavirus disease 2019 (COVID-19) pandemic affected all sectors of life, from health to economics. Soon after the onset of the pandemic, research into the treatment and prevention of SARS-CoV-2, the virus that causes COVID-19, accelerated rapidly, with 500 treatment and prevention efficacy trials registered on ClinicalTrials.gov between January 2020 and June 2020 [Reference Hutchinson, Klas, Carlisle, Kimmelman and Waligora1]. Although most of the world’s population was affected by COVID-19, not all demographic groups were affected equally. In the United States (US), people who were older [Reference Luck, Elo, Preston, Paglino, Hempstead and Stokes2], socioeconomically disadvantaged, and/or members of racial/ethnic minority groups [Reference Pathak, Menard, Garcia and Salemi3,Reference Magesh, John and Li4] bore a disproportionate burden of mortality and morbidity of the pandemic. For example, counties with higher proportions of Black residents had higher mortality rates due to COVID-19 [Reference Glance, Thirukumaran and Dick5], and members of minoritized groups (e.g., Black, Asian, Hispanic) in Illinois experienced a larger burden of COVID-19 morbidity and mortality at younger ages, due mainly to differences in exposure risk [Reference Holden, Simon, Arnold, Halloway and Gerardin6]. Pre-existing social conditions, such as structural racism, un- or under-insurance, low socioeconomic status, crowded living, and inflexible work conditions, led to higher risk of infection for members of minoritized groups [Reference Webber-Ritchey and Lane-Cordova7]. These social conditions, coupled with pre-existing barriers to research participation, contributed to an underrepresentation of persons from minoritized groups in COVID-19 research, relative to their COVID-19 burden [Reference Borno, Zhang and Gomez8–Reference Unger, Liu, Vaidya, Chang, Xia and Xiao10].
Underrepresentation of members from minoritized groups in research, including clinical trials, has been problematic for decades [Reference Grant, Lin and Miller11–Reference Bibbins-Domingo and Helman13]. Barriers such as limited time and resources, lower awareness of clinical trials, lack of trust, and fewer invitations from clinicians contribute to persistent barriers in participation [Reference Webber-Ritchey and Lane-Cordova7,Reference Clark, Watkins and Piña14–Reference Byrne, Tannenbaum, Glück, Hurley and Antoni16]. Recent research that examines disparities in drug trial enrollment relative to the burden of disease has shown marked underrepresentation of Black and Hispanic/Latino participants both overall and by therapeutic areas [Reference Peña, Smith and Getz17]. Efforts by US federal agencies to promote diversity in trials have yielded slow progress. Insufficient representation limits generalizability of results and obscures the efficacy of interventions in populations disproportionately affected by conditions such as cardiovascular diseases, diabetes, kidney disease, pulmonary disease, and COVID-19. Early in the pandemic, there were explicit calls to ensure that populations most affected by COVID-19 were represented in studies [Reference Hooper, Nápoles and Pérez-Stable18]. However, evidence shows continued underrepresentation of Black, Hispanic, and Asian persons in early and later COVID-19 therapeutic, observational, and vaccine trials [Reference Xiao, Vaidya, Liu, Chang, Xia and Unger19]. Even with targeted recruitment of minoritized persons, COVID-19 vaccine trials in the US enrolled minoritized individuals at well below their representation both in the general population and in terms of COVID-19 morbidity and mortality [Reference Khalil, Leary, Rouphael, Ofotokun, Rebolledo and Wiley20].
Narrative communication, particularly storytelling, has emerged as a promising approach to improve engagement with health information and address barriers to research participation. Storytelling and narrative health education use an “entertainment-education” approach and can be used in multiple formats such as videos, booklets, and comics [Reference Moran, Frank, Chatterjee, Murphy and Baezconde-Garbanati21]. Narrative health education materials are as effective or more effective than traditional non-narrative formats in increasing knowledge and prompting behavioral change [Reference Moran, Murphy, Frank and Baezconde-Garbanati22]. Storytelling draws on rich oral traditions common in many Black and Hispanic/Latino communities [Reference Saha, Beach and Cooper23,Reference Banks-Wallace24], making it culturally resonant and well-suited for addressing stigma and distrust by presenting information through emotionally and culturally resonant experiences [Reference Green and Brock25,Reference Green26]. Storytelling is especially effective when trying to reach persons of underrepresented racial and ethnic backgrounds if the stories are grounded in shared experiences [Reference Houston, Allison and Sussman27,Reference Allison, Nguyen and Ha28]. Storytelling is effective in changing attitudes and behavior by breaking down cognitive resistance through transportation and identification with characters in the narrative [Reference Slater and Rouner29]. Narrative communication has value for those who have a strong group identity, who experience substantial stigma, and who have low trust in the medical system (e.g., Black and Hispanic persons). Storytelling interventions have been shown to promote healthy lifestyle changes, including improvements in diet, exercise, and blood pressure control, and are particularly effective in communities with strong oral traditions, such as Black and Hispanic/Latino communities [Reference Houston, Allison and Sussman27,Reference Hargraves, Bonollo, Person and Ferguson30]. Digital storytelling, a combination of technology and community voices, is also emerging as a valuable method in health research [Reference West, Rieger and Kenny31]. Evidence shows that culturally relevant storytelling [Reference Briant, Halter, Marchello, Escareño and Thompson32] can help patients understand their conditions better and contribute to shared decision making [Reference Park, Forhan and Jones33] and positively influence health behavior change through health promotion [Reference Lohr, Raygoza Tapia and Valdez34].
The aim of our study was to test whether viewing short digital narratives told by community members who shared racial/ethnic and cultural identities as participants (Storytelling arm), as opposed to solely educational videos (Learn More arm), influenced whether participants were interested in and chose to enroll in a COVID-19 research study and donate blood samples when offered. Our main hypothesis was that when participants were exposed to culturally tailored digital narratives (COVIDStory) in addition to educational videos (Storytelling arm), they would be interested in and enroll in a COVID-19 serosurvey (i.e., antibody study) at higher rates compared to participants who were only exposed to the standard educational videos (Learn More arm).
Materials and methods
The institutional review Board at the University of Massachusetts Chan Medical School (H00023082 and H00023083) approved the study.
Study design and setting
This parallel randomized controlled trial was conducted in Worcester, Massachusetts, and surrounding towns in Worcester County between September 2021 and December 2022. Worcester is the second largest city in New England, along with Worcester County, which constitutes a diverse urban and suburban region. The racial and ethnic diversity in this region has increased substantially between 2018 to 2022, with growth among Hispanic/Latino populations increased by 43% and Black populations by 38%. In the city of Worcester, around 19% of residents live below the poverty line, while at the county level, the poverty rate is 10% [35]. During the study period, both Worcester and Worcester County experienced substantial COVID-19 burden, with case rates that consistently exceeded state averages. All aspects of the study, from consent to intervention, were delivered through Qualtrics, an online survey tool to create and analyze surveys that is available on devices that can access the internet (e.g., mobile phones, tablets, laptops).
Participant eligibility
Eligibility criteria were (1) at least 18 years of age; (2) resided in Worcester or surrounding communities; (3) identified as Black/African American or Hispanic/Latino; (4) able to read in English or Spanish. Potential participants were asked eligibility criteria questions at the beginning of the survey, prior to consent. If any of the eligibility questions were answered “No,” participants were taken to a screen that expressed thanks for their interest and informed them that they were not eligible for the survey. If eligible, participants moved on to provide consent to participate. Within the consent form, participants were reminded of the study purpose, duration, and informed of incentive to participate (see consent form in Supplementary Material 1). If participants consented, they were then able to complete the survey, view the intervention or educational material, and then complete a post-intervention survey. Individuals who met all eligibility criteria and provided consent were enrolled. No further exclusion criteria were applied beyond the initial eligibility requirements.
Study recruitment and randomization
This study used respondent-driven sampling and convenience sampling to recruit participants. Respondent-driven sampling is an adaptation of chain referral, which begins with a set of “seeds” who do not participate in the intervention. The “seeds” refer eligible persons in their network to participate, and those participants then refer eligible persons in their network, and so on until the desired sample size is reached. For this study, our “seeds” were our community advisory board members and individuals in the community who were recommended by our community advisory board members. Our community advisory board was made up of 10 community members representing various organizations that serve Black and Hispanic communities in Worcester. Due to slow enrollment and to combat COVID-19 research fatigue, we also used active recruitment methods such as in-person convenience sampling through tables at community events (e.g., food drives, cultural fairs, and community concerts). Participants could complete the survey on-site using study iPads, scan the study QR code on their personal device or take a flyer with the QR code home to complete the study later (Supplementary Material 2). Participants who completed the survey were also asked to provide the names and contact information for up to three people who might also be interested in participating in this study. Study staff called participant referrals, explained the study and who referred them, and offered enrollment through a personalized link via email.
Experimental group (storytelling intervention)
We developed a series of short storytelling video interventions guided by the Slater Model of Narrative Communication [Reference Slater and Rouner29]. The Slater Model emphasizes the ability of narrative communication to break down cognitive resistance by absorption in the storyline and identification with characters in the narrative. Because our target populations were Black/African American and/or Hispanic/Latino residents of Worcester and surrounding areas, we recruited storytellers with racial and ethnic backgrounds similar to our intended population. The storytelling video intervention included 8 videos of 3–5 minutes in length on topics related to COVID-19 and research that were identified as important through our community advisory board. Each video was compiled of multiple community members talking about the overall topic of the video. The titles of each video were: “Aftermath of Having COVID-19,” “COVID-19 Health Inequities,” “Emotional and Mental Health Implications of COVID-19,” “Historical Context of Research,” “Research,” “Keeping Informed,” “Messages to Others,” and “Vaccine Perspectives” (links to videos provided in Supplementary Material 1). Participants were instructed to watch at least 3 of the stories on topics that interested them and advised that they could watch them all if they wished. The stories were combined with informational, non-narrative videos – “Learn More” – on each of the same topics. The Learn More videos were informational videos from public sites (e.g., CDC.gov, Mass.gov) that provided scientific information on each topic in non-narrative video format. The informational videos were entitled: “COVID-19 Managing Anxiety and Stress,” “Monitoring Your COVID-19 Long-Term Effects,” “Preventing COVID-19 and Long-Term Effects,” “COVID-19 Mythbusters,” “COVID-19 Vaccines: 4 Facts,” “COVID-19 Vaccines: Safety and Diversity,” and “What is Clinical Research.” Participants were instructed to watch at least 3 Learn More videos that they were interested in and advised that they could watch them all if they wished.
Comparison group (non-narrative, information-based intervention)
Comparison Group participants were provided with only the non-narrative, informational Learn More videos that the experimental group received. Participants were instructed to watch at least 3 Learn More videos before they could move on to the rest of the survey and advised that they could watch them all if they wished.
Randomization procedure
Participants were assigned to either the experimental group (storytelling plus educational videos) or the comparison group (“Learn More” non-narrative educational videos only) by simple randomization using the Qualtrics survey tool after being determined eligible and consenting to join the study. Participants completed the 20-minute survey and then were randomized to see either narrative videos and then educational videos or only educational videos through embedded randomization in the Qualtrics software. Randomization was set to evenly randomize.
Data collection and intervention delivery
Participants were first able to select if they wanted to complete the survey in English or Spanish. Following randomization and confirmation of eligibility, participants were directed to complete the online informed consent before they could move on to the survey. Upon providing informed consent, participants took a 20-minute baseline survey in which participants answered questions regarding sociodemographics, economic security, discrimination, medical history, COVID-19 experiences, and vaccine perspectives. Participants were then able to view either the storytelling and then educational videos or only the educational videos depending on their intervention group assignment. After viewing the videos participants were directed to a post-intervention survey. The final question, measuring the primary outcome, explained what antibodies are and asked if the participant wanted to hear more about antibody research. If the participant indicated “yes” they were redirected to a RedCap survey where they were introduced to the antibody study and could choose to enroll if they wished [Reference Karger, Brien and Christen36,Reference Binder, Matta and Forconi37]. The antibody study was conducted by members of the study team and was a community-based antibody study designed to assess SARS-CoV-2 infection and vaccination history through blood and saliva antibody testing using point-of-care testing and bead-based multiplex assays. The antibody study ran concurrently with the current study up until July 2022. Participants were eligible for a $25 gift card if they completed the study and could have an additional $10 for providing up to 3 names and phone numbers of potential participants for the snowball-based enrollment. Participants were told that they were eligible for a gift card in the e-Consent and on the recruitment flyers.
Measures
All measures except the vigilance [Reference Clark, Benkert and Flack38] scale and the post-intervention survey came from the PhenX Toolkit COVID-19 Research Collections [Reference Hamilton, Strader and Pratt39]. The surveys were designed to be understandable at a 5th grade reading level.
Pre-intervention survey measures (surveys provided in Supplementary material 1)
Sociodemographic
Sociodemographic questions included self-identified race and ethnicity (based on the US Census Bureau categories), age in years, gender, sexual orientation, highest level of education, and marital status.
Economic
Economic questions included household income (combined annual income) and crowding (number of adults in the home, number of children in the home, number of bedrooms, number of persons employed in the home) and the economic impact of COVID-19.
Discrimination
Discrimination related to COVID-19 was measured using the Coronavirus Racial Bias Scale (CRBS) [Reference Fisher, Tao and Yip40] (α = 0.89). Participants were asked to rate their agreement from “strongly disagree” to “strongly agree” on a set of statements regarding racial and ethnic treatment during the pandemic.
Medical history
The medical history survey asked participants about conditions that they may have had prior to the COVID-19 pandemic, such as diabetes, asthma, chronic kidney disease, alcoholism, and coronary artery disease.
Vaccine perceptions
This section included questions regarding whether the respondent had been vaccinated for COVID-19, which one they received and when, whether they were part of a vaccine trial, and, if they didn’t get vaccinated, the reason. Similar questions were asked regarding the flu vaccine.
Post-exposure survey
The post-exposure survey was the standard post-storytelling survey used by our group in other storytelling intervention studies [Reference Kim, Lee and Kiang41,Reference Nguyen, Allison and Ha42]. It asks respondents what videos they watched, which was their favorite, and then various questions about the videos, such as how they would rate the language use, reliability, images, story content, and length. The same questions were asked about the Learn More videos for both those in the intervention group and those in the comparison group. See Supplementary Material 1 for post-intervention survey for both groups.
Outcome
The main outcome of the study was based on a question that told the participant that we were also conducting a COVID-19 serosurvey antibody study (hereafter “antibody study”) [Reference Karger, Brien and Christen36,Reference Binder, Matta and Forconi37] and asked if the respondent would like to hear more about the research study we were conducting and how much the videos influenced their decision. Starting in September 2021, if the participants said “yes,” then they were directed to click on a link where they could learn more about the antibody study and sign up for it. Between July 27, 2022, and December 31, 2022, the main outcome question probed the respondent’s willingness to join the antibody study, but without the actual opportunity to join due to the closure of the enrollment period. The outcome question after July 27, 2022, was “Having completed this survey, would you be interested in joining a COVID-19 study if asked?” and the question about the impact of the videos on the decision remained the same. We had two secondary outcomes. The first was whether participants joined (e.g., gave consent to participate) in the antibody study, and the second was whether participants provided a blood sample as part of the antibody study. To facilitate participation, multiple methods for blood collection were implemented. Community-based blood collection sites were established, and participants were also offered the option to use Tasso SST devices, which allowed self-collection of a small blood sample that could be returned via postage-paid US mail. Methods for measuring SARS-CoV-2 antibodies are described in detail in our companion publications [Reference Binder, Matta and Forconi37,Reference Binder, Fujimori and Forconi43].
Sample size
An a priori power calculation indicated that a total sample of 588 participants (294 per group) would provide 80% power to detect a 10% difference in interest in joining a study between the Storytelling and Learn More groups at a two-sided α = 0.05.
Statistical analysis
Baseline characteristics, by intervention assignment, were compared using t-tests for continuous variables and Chi-square tests for categorical variables. We used a two-sample test of proportions to test our primary and secondary outcomes. We completed additional analyses using logistic regression with interaction terms to determine if COVID-19-related factors (previous COVID-19, COVID-19 vaccination, lingering COVID-19 symptoms) research-related factors (participation in prior research, participation in COVID-19 vaccination trial), and sociodemographic factors (age, gender, income, education) moderated the association between the intervention and the primary outcome. Interaction terms were selected a priori based on theoretical relevance and prior evidence suggesting that COVID-19-related, research-related, and sociodemographic factors may modify the association between intervention and outcome. All variables listed above were included as interaction terms in logistic regression models. We also completed an additional analysis using data from the storytelling arm, only using logistic regression, to test whether intervention engagement affected the secondary outcomes. All analyses were completed based on intention-to-treat. We controlled for potential biases through randomization and intention-to-treat analyses. We also ran sensitivity analyses where we adjusted for potential confounders when we completed post hoc analyses where randomization may not have held due to selection bias (e.g., gender, racial identity, socioeconomic status).
Results
Recruitment
Between September 2021 and December 2022, 583 community members were screened for eligibility, of which 193 were either not eligible or consented to join but dropped out before randomization (Figure 1). Three hundred and ninety participants were randomized (200 in the Storytelling Intervention, 190 in Learn More), after which 44 dropped out after randomization but before completing the study and 3 (2 in Storytelling and 1 in Learn More) were excluded from analysis due to most of survey questions being left blank. Our analytical sample was 343 in total (173 in Storytelling and 170 in Learn More) with 173 enrolled prior to July 2022 (87 in Storytelling and 86 in Learn More) and 170 enrolled after July 2022. Our pre-determined stop point was approximately one year after enrollment began. However, once reaching the predetermined stop point, we were short of planned enrollment, so we extended study enrollment by three months. No participants were missing the outcome. The secondary analyses were complete case analyses, so those who were missing explanatory variables, such as questions about previous research, COVID infection, score on the CRBS, etc., were excluded from secondary analyses.
CONSORT flow diagram.

Baseline participant characteristics
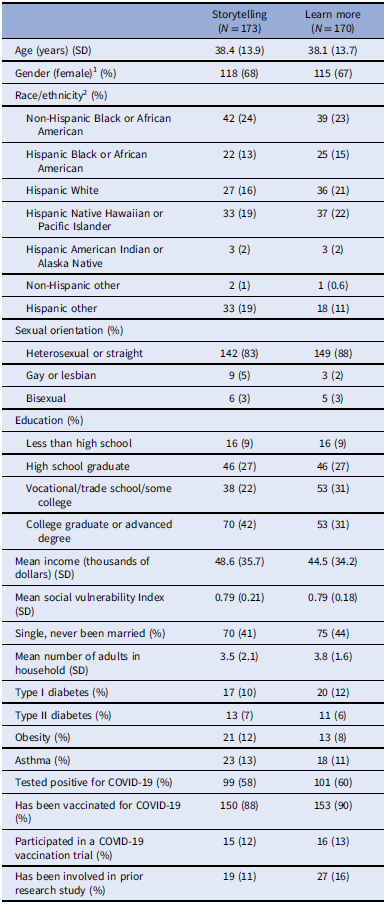
Descriptions of study participants at baseline are provided in Table 1. Mean age was 38 years (range 18 to 52 years) and 68% were women. There were slightly more participants who identified as “Other” race in the Storytelling group and slightly more participants who identified as “Hispanic” and “White” in the Learn More group, but these differences were not statistically significant. There were no significant differences in baseline characteristics between the Storytelling and Learn More groups.
Baseline sociodemographic and health characteristics: COVIDstory: 2021–2022

Table 1. Long description
A table comparing baseline sociodemographic and health characteristics between two groups: Storytelling and Learn More. The table has 22 rows and 10 columns. Column headers include Age, Gender, Race/ethnicity, Sexual orientation, Education, Mean income, Mean social vulnerability Index, Single, never been married, Mean number of adults in household, Type 1 diabetes, Type 2 diabetes, Obesity, Asthma, Tested positive for COVID-19, Has been vaccinated for COVID-19, Participated in a COVID-19 vaccination trial, Has been involved in prior research study. Row 1: Age (years) (SD), Storytelling (N = 173), Learn More (N = 170). Row 2: 38.4 (13.9), 38.1 (13.7). Row 3: Gender (female) (%), 118 (68), 115 (67). Row 4: Race/ethnicity (%), Non-Hispanic Black or African American, 42 (24), 39 (23). Row 5: Hispanic Black or African American, 22 (13), 25 (15). Row 6: Hispanic White, 27 (16), 36 (21). Row 7: Hispanic Native Hawaiian or Pacific Islander, 33 (19), 37 (22). Row 8: Hispanic American Indian or Alaska Native, 3 (2), 3 (2). Row 9: Non-Hispanic other, 2 (1), 1 (0.6). Row 10: Hispanic other, 33 (19), 18 (11). Row 11: Sexual orientation (%), Heterosexual or straight, 142 (83), 149 (88). Row 12: Gay or lesbian, 9 (5), 3 (2). Row 13: Bisexual, 6 (3), 5 (3). Row 14: Education (%), Less than high school, 16 (9), 16 (9). Row 15: High school graduate, 46 (27), 46 (27). Row 16: Vocational/trade school/some college, 38 (22), 53 (31). Row 17: College graduate or advanced degree, 70 (42), 53 (31). Row 18: Mean income (thousands of dollars) (SD), 48.6 (35.7), 44.5 (34.2). Row 19: Mean social vulnerability Index (SD), 0.79 (0.21), 0.79 (0.18). Row 20: Single, never been married (%), 70 (41), 75 (44). Row 21: Mean number of adults in household (SD), 3.5 (2.1), 3.8 (1.6). Row 22: Type 1 diabetes (%), 17 (10), 20 (12). Row 23: Type 2 diabetes (%), 13 (7), 11 (6). Row 24: Obesity (%), 21 (12), 13 (8). Row 25: Asthma (%), 23 (13), 18 (11). Row 26: Tested positive for COVID-19 (%), 99 (58), 101 (60). Row 27: Has been vaccinated for COVID-19 (%), 150 (88), 153 (90). Row 28: Participated in a COVID-19 vaccination trial (%), 15 (12), 16 (13). Row 29: Has been involved in prior research study (%), 19 (11), 27 (16).
SD standard deviation.
1 Two participants in the storytelling arm (0.58%) identified as non-binary/third gender.
2 Asian or Asian American was also an option for ethnicity on the survey but is not included in the table because no one selected it.
Intervention acceptability and engagement
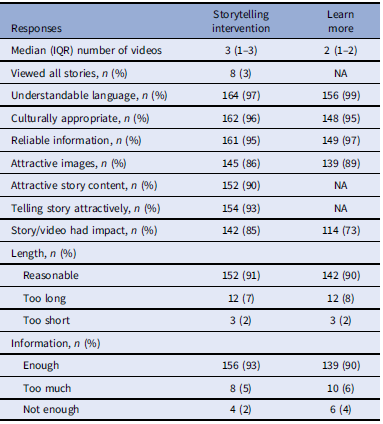
Participants were asked questions, through the post-exposure survey, about the videos after viewing them. In the Storytelling group, the median number of stories watched was 3 (IQR 1–3) (Table 2). Fifty-eight percent of those randomized to the Storytelling group watched at least the recommended 3 videos. Most participants reported that the language was easy to understand (97%), the culture in the story was appropriate (96%), the story information was reliable (95%), that the images (86%), story content (90%), and the way the community members tell their story (93%) was attractive, the story length was reasonable (91%), and there was enough information in the story (93%). Eighty-five percent of participants said that the story had an impact on them. For the Learn More group, the median number of videos watched was 2 (IQR 1–2). Twenty-two percent of those randomized to the Learn More group viewed at least the 3 recommended videos. Most Learn More participants reported that the language was easy to understand (99%), the culture was appropriate (95%), the information was reliable (97%), the images were attractive (89%), the video length was reasonable (90%), and that there was enough information in the videos (90%). Only 73% of participants in the Learn More group stated that the videos had an impact on them.
Post-video viewing survey by intervention group: COVIDstory: 2021–2022

Table 2. Long description
A table comparing participant responses to storytelling and learn more interventions. The table has 15 rows and 3 columns. The columns are labeled Responses, Storytelling intervention, and Learn more. The rows list various responses and their corresponding data for both interventions. Row 1: Median (IQR) number of videos, 3 (1-3), 2 (1-2). Row 2: Viewed all stories, n (%), 8 (3), NA. Row 3: Understandable language, n (%), 164 (97), 156 (99). Row 4: Culturally appropriate, n (%), 162 (96), 148 (95). Row 5: Reliable information, n (%), 161 (95), 149 (97). Row 6: Attractive images, n (%), 145 (86), 139 (89). Row 7: Attractive story content, n (%), 152 (90), NA. Row 8: Telling story attractively, n (%), 154 (93), NA. Row 9: Story/video had impact, n (%), 142 (85), 114 (73). Row 10: Length, Reasonable, 152 (91), 142 (90). Row 11: Length, Too long, 12 (7), 12 (8). Row 12: Length, Too short, 3 (2), 3 (2). Row 13: Information, Enough, 156 (93), 139 (90). Row 14: Information, Too much, 8 (5), 10 (6). Row 15: Information, Not enough, 4 (2), 6 (4).
NA = not applicable; IQR = interquartile range.
Primary and secondary outcomes
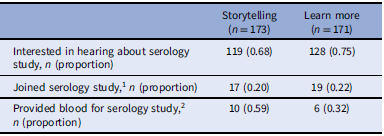
The primary and secondary outcomes are presented in Table 3. Compared to the Learn More group, a slightly smaller proportion of those in the Storytelling group (0.68 compared to 0.75) indicated that they would be interested in hearing about the antibody study, but the difference was not significant (proportion difference = 0.07, 95% CI: −0.02, 0.16). Of those who indicated they would be interested in hearing about the antibody study when it was available (n = 173) 36 participants followed through and joined (Storytelling = 17, Learn More = 19). A slightly higher proportion of participants in the Learn More group (0.22) compared to the Storytelling group (0.20) joined the antibody study (proportion difference = 0.02, 95% CI: −0.09, 0.15). Of those who joined the antibody study, only 16 participants provided a blood sample (Storytelling = 10, Learn More = 6). Among participants who joined the serology study and provided a blood sample for analysis, a higher proportion of those who were in the Storytelling group (0.59) gave blood compared to those in the Learn More group (0.31) (proportion difference = −0.27, 95% CI: −0.059, 0.04).
Primary and secondary study outcomes for participants assigned to storytelling and learn more interventions: COVIDstory: 2021–2022

Table 3. Long description
A table comparing serology study outcomes for storytelling and learn more interventions. The table has three rows and four columns. Column headers are Interested in hearing about serology study, Joined serology study, and Provided blood for serology study. Row labels are Storytelling (n = 173) and Learn more (n = 171). Row 1: Interested in hearing about serology study, n (proportion): Storytelling 119 (0.68), Learn more 128 (0.75). Row 2: Joined serology study, n (proportion): Storytelling 17 (0.20), Learn more 19 (0.22). Row 3: Provided blood for serology study, n (proportion): Storytelling 10 (0.59), Learn more 6 (0.32).
1 Due to the antibody study ending before the randomized trial the total sample size for the secondary outcomes was 173 (Storytelling = 87; Learn More = 86). Proportions were calculated using this sample size (e.g., 17/87).
2 The proportion who provided blood in the antibody study was calculated as the number who gave blood/number who joined the antibody study (e.g., 10/17).
Additional analyses
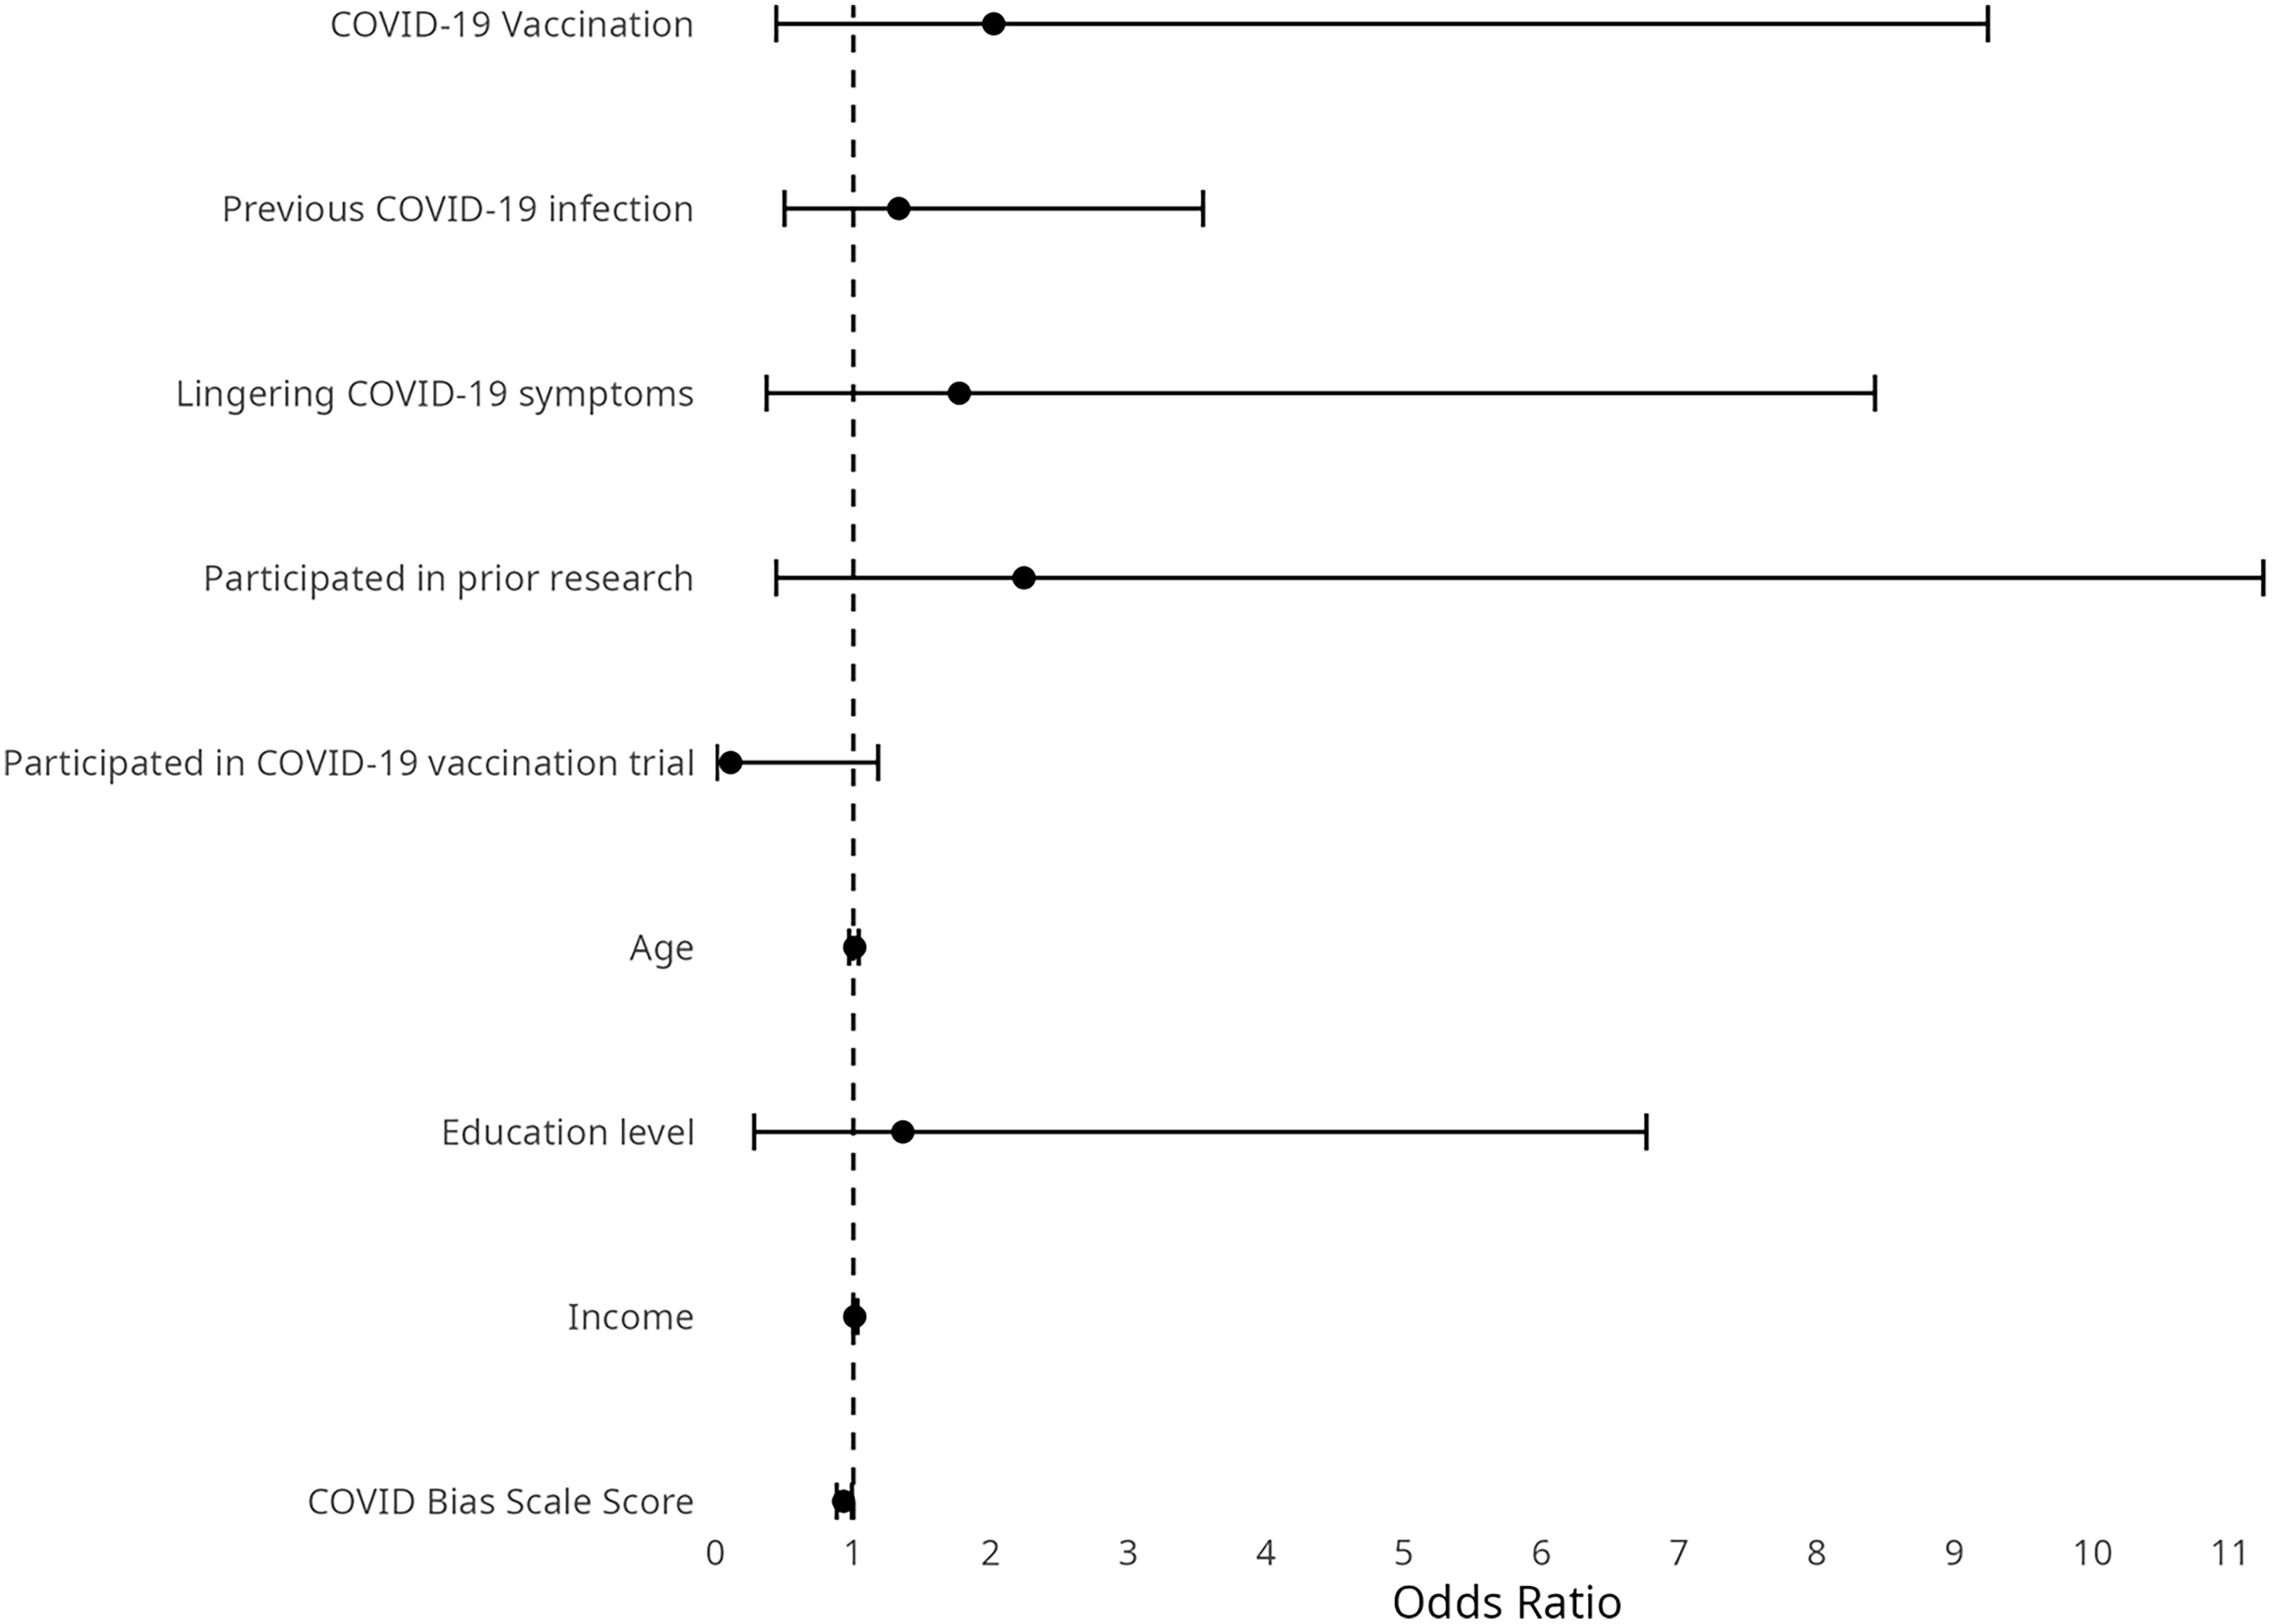
Figure 2 shows the results of our additional analysis of logistic regression with interaction terms. None of the COVID-19-related factors, participating in prior research or a COVID-19 vaccination trial, age, or income indicated significant effect modification of the interaction and primary outcome. A higher score on the CRBS was associated with lower odds of joining the antibody study among participants in the storytelling group compared to the Learn More group (OR = 0.93, 95% CI: 0.87–0.99). Table 4 shows the odds ratios and 95% confidence intervals for the effects of various storytelling-related factors on joining the serosurvey antibody study and on providing blood as part of the antibody study. Most intervention engagement variables did not have a significant effect on the decision to join the study or give blood; however, participants who indicated that their favorite story was relevant to their life were significantly more likely to have joined the serology study (OR = 1.29, 95% CI: 1.03–1.60). The sensitivity analyses did not show substantial differences and is not included for space purposes.
Forest plot displaying odds ratios and 95% confidence intervals for interaction terms between group assignment and selected demographic and COVID-19–related factors, for the primary outcome (interest in COVID-19 antibody study enrollment).

Odds ratios and 95 % confidence intervals of joining the serosurvey antibody study and providing a blood sample as part of the serosurvey antibody study by intervention engagement: COVIDstory: 2021–2022

Table 4. Long description
A table with four rows and three columns comparing the influence of various factors on joining a serosurvey antibody study and providing a blood sample. The columns are labeled ‘Join serosurvey antibody study’ with sub-columns ‘Odds ratio’ and ‘95% CI’, and ‘Provide a blood sample as part of the serosurvey antibody study’ with sub-columns ‘Odds Ratio’ and ‘95% CI’. The rows are labeled ‘Influence of videos’, ‘Number of stories watched’, ‘Rating of Stories watched’, and ‘Favorite story relevant to life’. Row 1: Influence of videos, Odds ratio 1.04, 95% CI 0.84-1.29, Odds Ratio 0.48, 95% CI 0.24-0.95. Row 2: Number of stories watched, Odds ratio 1.10, 95% CI 0.92-1.31, Odds Ratio 0.87, 95% CI 0.51-1.48. Row 3: Rating of Stories watched, Odds ratio 0.88, 95% CI 0.67-1.15, Odds Ratio 0.62, 95% CI 0.13-2.84. Row 4: Favorite story relevant to life, Odds ratio 1.29, 95% CI 1.03-1.60, Odds Ratio 1.34, 95% CI 0.80-2.25.
Bold indicates p < 0.05.
Odds ratios are from single predictor models.
Discussion
In this randomized study, a narrative storytelling intervention did not increase overall interest in, enrollment in, or blood sample provision for a SARS-CoV-2 antibody study compared with an educational control group. However, among participants randomized to the storytelling intervention, those who perceived the stories as relevant to their own lives were significantly more likely to enroll in the antibody study. These findings suggest that narrative interventions alone may not be sufficient to change research participation behaviors, but that perceived personal relevance and engagement may play a role in translation of stories into action.
Sixty-eight percent and 75% of participants in the Storytelling and Learn More groups, respectively, indicated that they would be interested in hearing about the antibody study. Despite high self-reported interest in both groups this interest did not translate into enrollment in the antibody study, highlighting a well-described gap between stated willingness and actual participation in biomedical research. Research is mixed on estimates of willingness to participate in biomedical research among Black or Hispanic community members with an older study indicating about 28% for Black participants and 31% for Hispanic participants [Reference Katz, Claudio, Kressin, Green, Wang and Russell44] but newer studies indicate a higher proportion of definite interest in being in a research study for Black (51%) and Hispanic (60%) community members [Reference Milani, Swain, Otufowora, Cottler and Striley45]. A study of adults 50 years and older in Florida showed that more than 75% of participants would volunteer for many study types, including studies where only questions were asked, blood was drawn, genetic samples were collected, and an overnight stay in the hospital or clinic was involved [Reference Milani, Swain, Otufowora, Cottler and Striley45]. When a study required medication use, the percent interested dropped considerably for Black (67%) and Hispanic (56%) participants. One study explored how location (rural vs. urban), race/ethnicity (African American or Latinx), and who conducts the study affects likelihood of participation and found higher willingness to join among all groups (75%–82% for African American participants and 72%–81% for Latinx participants) if their own doctor was conducting the research and slightly lower percentages if a university hospital was conducting the research [Reference Thetford, Gillespie, Y-i, Hansen and Scarinci46].
Our finding from the post hoc analysis that those who were in the storytelling group, had the opportunity to join the antibody study, and found that at least one of the stories was relevant to their lives, were significantly more likely to join the antibody study, may indicate that engagement with the stories has the potential to influence research participation. Thus, identifying with the story content and considering it to be relevant rather than simply viewing a certain number of stories may be necessary for the stories to have an effect, indicating that the technique of storytelling has potential; thus, further exploration of how to ensure that stories are relevant to the viewers’ lives may improve the value of the stories. Those who indicated that their favorite story was the emotional and mental health implications of COVID-19 had the highest average score on relevance to life (n = 28). These findings provide themes to build on in future storytelling interventions and specifically indicate that hearing about the effect of disease on the individual may engender a deeper connection to the story.
Our goal with the stories was to address known barriers and facilitators to research participation in Black and Hispanic populations, such as lack of knowledge of research opportunities, mistrust of research, research literacy, and altruism [Reference Sheridan, Martin-Kerry, Hudson, Parker, Bower and Knapp47,Reference George, Duran and Norris48], and we examined how well we did that through measuring the moderation of the intervention effect by sociodemographic, research, and COVID-19-related factors. While research factors (e.g., prior participation, being part of a COVID-19 vaccine trial), COVID-19 related factors (e.g., prior COVID-19 infection, lingering symptoms of COVID-19) and most sociodemographic factors (e.g., age, gender, education, income) did not moderate the intervention effect we found that higher score on the COVID Bias Scale, which indicates that a participant feels that their racial/ethnic group is more discriminated against due to COVID-19, was associated with a lower likelihood of wanting to hear more about the antibody study among those in the storytelling group. Feeling that one’s racial/ethnic group is discriminated against or otherwise treated more poorly than other groups is a demonstrated barrier to research participation in that it affects trust, which is a major barrier among members of minoritized racial/ethnic groups [Reference George, Duran and Norris48,Reference Barre, Cunningham-Erves, Moss, Parham, Alexander and Davis49]. One recent study examined motivators and barriers specific to COVID-19 research participation in Black communities and found that although most participants acknowledged the importance of science and research to improve health, mistrust is still an important barrier; specifically, past research abuses of Black communities, such as Tuskegee, Henrietta Lacks, and gynecological research abuses by J. Marion Sims [Reference Barre, Cunningham-Erves, Moss, Parham, Alexander and Davis49]. Although one of our stories was specifically about mistrust in research and discussed past research abuses, our results indicate that current discrimination that the participants see happening to their racial/ethnic group is a powerful barrier to participation.
Key challenges to this study were the attrition after randomization and the low proportion of participants who ultimately enrolled in the antibody study or provided a blood sample. Several factors may have contributed to these challenges. Qualtrics was set up in such a way that as soon as a person consented to join the study, they were automatically randomized. Thus, if participants decided that the study was too long or they didn’t want to answer the questions and closed the survey without returning to complete it, it would show as a dropout after randomization. In the future, setting randomization to take place immediately before intervention delivery (e.g., just prior to being presented with the stories or education material), may solve this issue. Regarding the low proportion of participants who enrolled and provided blood for the antibody study, possible barriers include the additional burden of participating in a separate study, the requirement of biospecimen collection, and research/COVID burnout. Enrolling in a separate study is likely more sensitive to logistical barriers, competing priorities, and perceptions of risk and benefit.
Several limitations should be considered when interpreting these findings. First, the study was conducted in a single county in central Massachusetts and included a relatively young, on average, sample, which may limit generalizability to older populations and to communities in other geographic and sociopolitical contexts. Second, the intervention was delivered via an unsupervised digital platform, which limited our ability to determine if participants understood all the questions and adhered fully to the study protocol, such as viewing fewer than the intended number of videos. Third, participation in the antibody study, including how many participants provided a blood or saliva sample, was low, which limited statistical power for interpretation of secondary outcomes. Fourth, as with any study, potential selection and participation biases should be considered, including self-selection into the study and differential dropout after randomization, all of which may have influenced observed associations. Our mix of sampling methods may also be considered a limitation, one that we attempted to resolve through the use of randomization. Finally, the change in outcome question before and after the closure of the antibody study gauged different behavioral responses (interest vs. readiness). The strengths of our study include a randomized design, an innovative intervention that was used in a different way than it has been in the past, a post-intervention survey allowing us to measure engagement and uptake, and recruitment of nearly 350 community participants from Black and Hispanic communities in the Worcester, MA area during a global pandemic. Future studies using this method might consider outcomes that are not likely to be unavailable partway through the study. For example, one might use this method to determine if storytelling is an effective means of increasing vaccine uptake by asking a question such as “Do you plan to get vaccinated for xx?” to have a consistent outcome and then follow-up in the future to see if the participant did get vaccinated to add a real-world outcome as well.
Conclusion
Overall, our study did not increase interest or participation in the research study in the primary analysis. Post hoc analyses suggest that a storytelling intervention could be effective in increasing research participation if the stories are relevant to the lives of the participants, and one way to do that may be to ensure that the stories are genuine and reflect personal experiences. However, these findings should be interpreted carefully, given the small sample size. Further, our study suggests that perception of current racial/ethnic discrimination may be a barrier to participation. These findings highlight the need to further explore the utility of personalized stories as a way to facilitate research participation and address barriers to research participation, and the importance of community participation in the research process to ensure that researchers are trusted by communities and that they are creating content that is relevant to the community that they are striving to include.
Supplementary material
The supplementary material for this article can be found at https://doi.org/10.1017/cts.2026.10816.
Acknowledgements
The authors thank the study participants who generously gave their time to make this study a success.
Author contributions
Sarah N. Forrester: Conceptualization, Data curation, Formal analysis, Investigation, Methodology, Writing - original draft, Writing - review & editing; Ann M. Moormann: Funding acquisition, Writing - review & editing; Jennifer A. Batista: Project administration, Writing - review & editing; Raquel A. Binder: Project administration, Writing - review & editing; Mary R. Lee: Writing - review & editing; Catarina Kiefe: Conceptualization, Supervision, Writing - review & editing; Jeroan Allison: Conceptualization, Investigation, Supervision, Writing - review & editing.
Funding statement
This work was supported through the National Institutes of Health (NIH), National Cancer Institute Serological Sciences Network (AM, SF, grant number U01 CA261276), and the NIH National Center for Advancing Translational Sciences Grant (RB, grant number KL2-TR001455). The content is solely the responsibility of the authors and does not necessarily represent the official views of the NIH. The funders had no role in study design, data collection and analysis, decision to publish, or preparation of the manuscript.
Competing interests
The author(s) declare none.




 Open access

