1. Introduction
The understanding of the late Neogene southern North Sea Basin has advanced considerably following recent dinoflagellate cyst and sequence stratigraphic studies (Vandenberghe et al. Reference Vandenberghe, Laga, Steurbaut, Hardenbol, Vail, de Graciansky, Hardenbol, Jacquin and Vail1998, Reference Vandenberghe, Van Simaeys, Steurbaut, Jagt and Felder2004; Louwye, Head & De Schepper, Reference Louwye, Head and De Schepper2004; Louwye et al. Reference Louwye, De Schepper, Laga and Vandenberghe2007; Louwye & Laga, Reference Louwye and Laga2008; De Schepper, Head & Louwye, Reference De Schepper, Head and Louwye2009). These built further on the first Neogene chronostratigraphic framework of northern Belgium based on foraminifer research by De Meuter & Laga (Reference De Meuter and Laga1976). The recent studies made handy use of the temporary, easily accessible sections during the latest expansion phase of the Antwerp Harbour and provided new stratigraphic and palaeoenvironmental insights in the depositional history of the southern North Sea Basin during Miocene and Pliocene times. In the Campine area (Fig. 1), east of Antwerp, contemporaneous sediments were deposited in similar environments (Vandenberghe et al. Reference Vandenberghe, Laga, Steurbaut, Hardenbol, Vail, de Graciansky, Hardenbol, Jacquin and Vail1998). The southern North Sea Basin was shallow at that time and hence, frequently occurring lateral facies changes render correlation based on sedimentology and geometry between units in the Campine and Antwerp areas difficult. There are also no permanent Neogene outcrops in the Campine area, making the stratigraphic studies even more complicated.
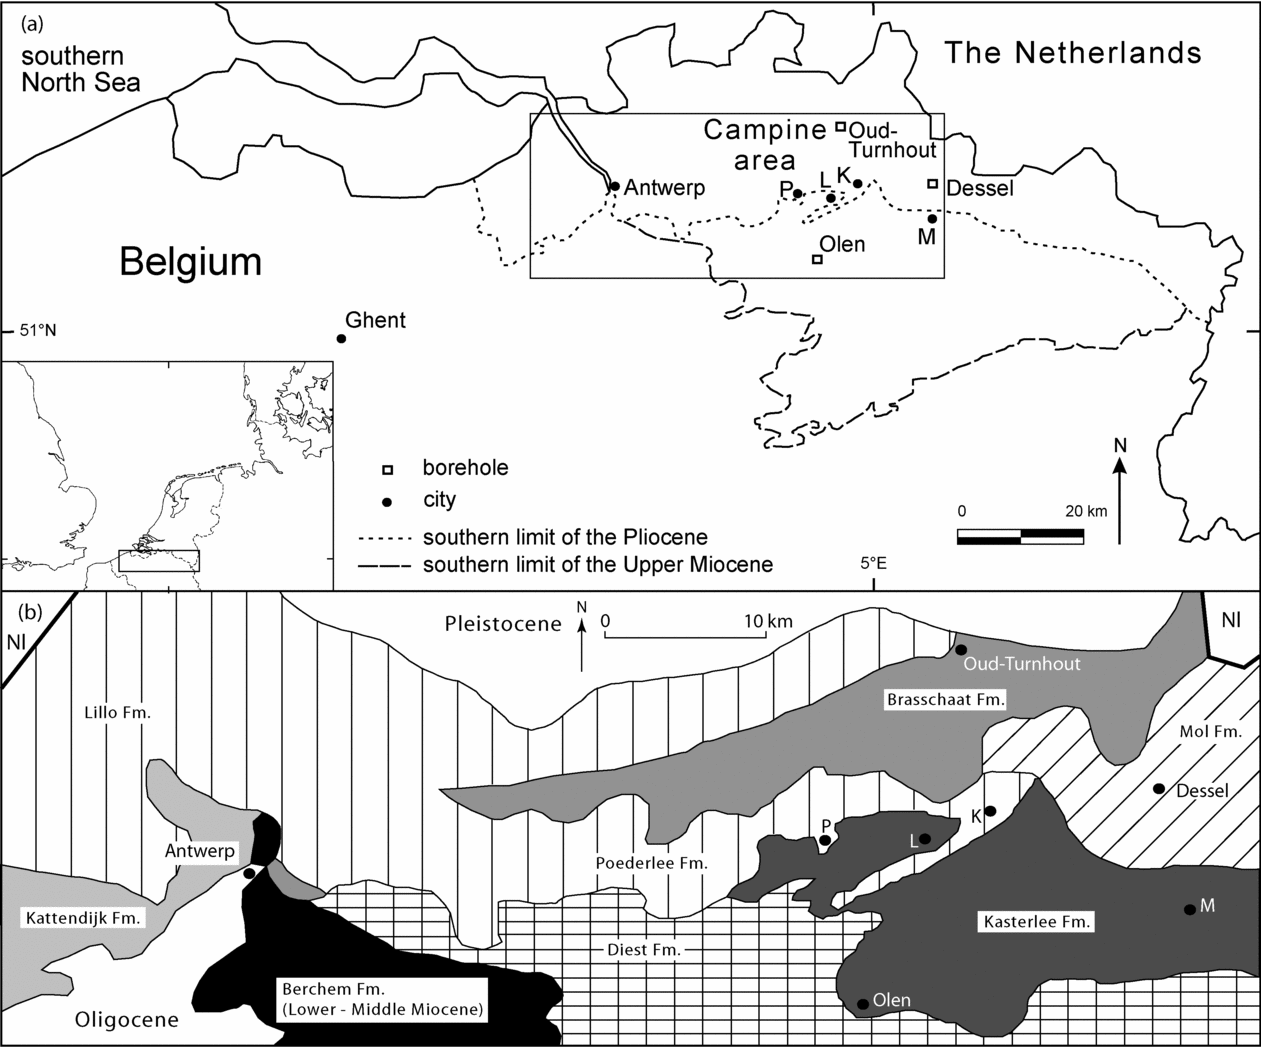
(a) Map of northern Belgium and southern Netherlands, and location of the study area. Inset: southern North Sea Basin. Rectangle indicates limit of (b). (b) Geological map of the study area. Explanation of abbreviations of locality names: P – Poederlee, L – Lichtaart, K – Kasterlee, M – Mol, Nl – The Netherlands. Geographic areas are printed in italics.

A dinoflagellate cyst study of the Kasterlee Formation at the southern edge of the North Sea Basin (Olen locality, Fig. 1a, b) revealed deposition in a near-shore environment during latest Tortonian to Messinian times (Louwye et al. Reference Louwye, De Schepper, Laga and Vandenberghe2007), but the character of the more northerly and possibly deeper depositional settings of this unit remained unknown. The marine Poederlee Formation occurs in the Campine area (Fig. 1a, b) and was attributed a Pliocene age based on a variably preserved mollusc content (e.g. De Meuter & Laga, Reference De Meuter and Laga1976). A detailed age assessment and depositional history was hampered by partial decalcification of the sediments and lateral discontinuity. Nevertheless, a Piacenzian age for the Poederlee Formation and correlations with units in the Antwerp area have been proposed (Buffel et al. Reference Buffel, Vandenberghe, Goolaerts and Laga2001; Vandenberghe et al. Reference Vandenberghe, Van Simaeys, Steurbaut, Jagt and Felder2004).
The Kasterlee and Poederlee formations in our study site, the Oud-Turnhout borehole (Fig. 1a, b), contain well-preserved palynomorph assemblages. Comparison of the dinoflagellate cyst association from this borehole with the framework established in the Antwerp area (Louwye, Head & De Schepper, Reference Louwye, Head and De Schepper2004; De Schepper, Head & Louwye, Reference De Schepper, Head and Louwye2009) allows the elucidation of the current knowledge of the stratigraphy and depositional history of both formations, and enhances the current understanding of the southern North Sea Basin evolution. In this study, we intend to characterize the deeper depositional setting of the Miocene Kasterlee Formation; evaluate the stratigraphic position of the Poederlee Formation, estimate its age, and test and refine correlations with units in the Antwerp area; and finally, assess the magnitude of the hiatus between the Miocene and Pliocene deposits in the Campine area and the Antwerp area.
2. Geology of the Campine area
The geographic distribution of the Kasterlee Formation is limited to the Campine area (Fig. 1b). The formation is a micaceous, fine-grained sandy unit without macrofossils, slightly glauconitic and with intercalations of micaceous clay (De Meuter & Laga, Reference De Meuter and Laga1976). The lower boundary with the Diest Formation is often inconspicuous, but a discrete basal gravel has been observed in a few localities. Louwye et al. (Reference Louwye, De Schepper, Laga and Vandenberghe2007) proposed deposition at some time between 7.5 and 5.32 Ma (latest Tortonian to Messinian). Their palynological and geophysical study of the formation in the Dessel-2 borehole and the Olen outcrop (Fig. 1a, b) further revealed deposition in a shallow marine environment, characterized by a distinct shoaling phase in the upper part of the sequence (Louwye et al. Reference Louwye, De Schepper, Laga and Vandenberghe2007). It must be noted that the Olen outcrop is located near the southern boundary of Upper Miocene deposits in northern Belgium (Fig. 1a, b), and that deeper, neritic environments must have prevailed to the north. The present study area, Oud-Turnhout, is located approximately 20 km to the north of the Olen outcrop.
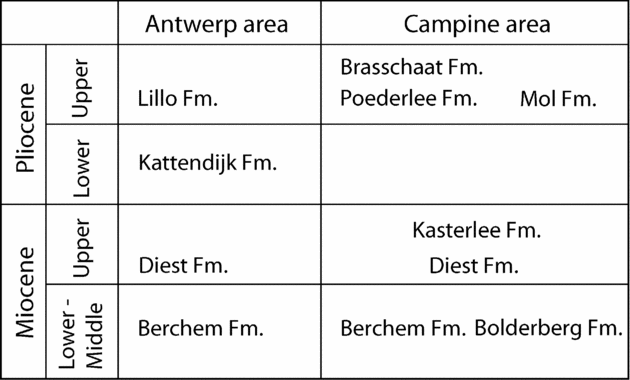
In parts of the Campine area, the shallow marine depositional setting of the Kasterlee Formation succeeded the distinctly transgressive, and fully marine environment of the underlying Upper Miocene Diest Formation (Louwye et al. Reference Louwye, De Schepper, Laga and Vandenberghe2007) (Fig. 2). The Diest Formation is a diachronous sequence genetically related to the eustatic sea-level rise following the sea-level low around the Middle–Upper Miocene boundary. Deposition started during early Tortonian times in the Campine area, and the centre of maximum deposition later shifted to the region north of Antwerp (Fig. 1) during late Tortonian to Messinian times (Louwye, De Coninck & Verniers, Reference Louwye, De Coninck and Verniers1999). This shift is expressed by distinctive prograding of the sequence to the northwest. The Deurne Sands are a local and marginal marine facies of the Diest Formation in the vicinity of the city of Antwerp, and are covered by the Lower Pliocene Kattendijk Formation. The age of the Diest Formation was already established from several locations in northern Belgium by Louwye (Reference Louwye2002), Louwye, De Coninck & Verniers (Reference Louwye, De Coninck and Verniers1999) and Louwye et al. (Reference Louwye, De Schepper, Laga and Vandenberghe2007): Tortonian in the greater part of the Campine area, early to middle Tortonian in the vicinity of the city of Antwerp (Deurne Sands), and Tortonian–Messinian north of Antwerp near the border with The Netherlands.
Stratigraphic framework of the Neogene deposits in northern Belgium (after Louwye et al. Reference Louwye, De Schepper, Laga and Vandenberghe2007).

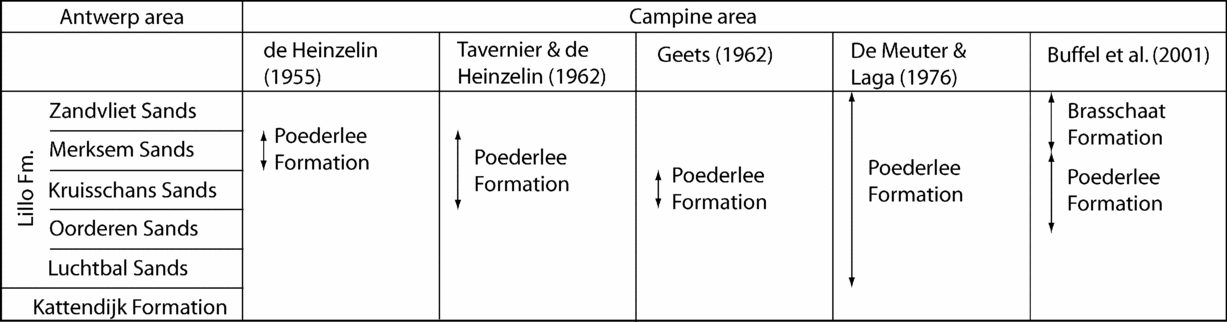
The geographic distribution of the Poederlee Formation is restricted to the centre of the Campine area (Fig. 1b). De Meuter & Laga (Reference De Meuter and Laga1976) formally defined the Poederlee Formation as ‘fine, slightly glauconitic sand with small lenses of clay in the lower part; a base gravel of rounded quartz and flint, silicified limestones (the Hukkelberg gravel); a much oxidized upper part in the type region, sometimes containing limonitic sandstones with moulds of shells’. These authors designated the iron sandstone layers on top of the hills north of the village of Poederlee as the type section, and the village of Poederlee in the southern part of the Campine area as the type locality (Fig. 1a, b). The formation has a maximum thickness of about 10 m (Schiltz, Vandenberghe & Gullentops, Reference Schiltz, Vandenberghe and Gullentops1993). De Meuter & Laga (Reference De Meuter and Laga1976) broadly correlated the formation with the entire Lillo Formation from the Antwerp area (Figs 2, 3). The Poederlee Formation rests unconformably on the Kasterlee Formation throughout the study area (Buffel et al. Reference Buffel, Vandenberghe, Goolaerts and Laga2001; Louwye et al. Reference Louwye, De Schepper, Laga and Vandenberghe2007) and is covered to the north by the Brasschaat Formation (Figs 1, 2), which was deposited in an estuarine environment. The absence of calcareous macrofossils, microfossils and organic-walled palynomorphs in the latter unit hampers its stratigraphic assessment.
Previous correlations of the Poederlee Formation with members of the Lillo Formation in the Antwerp area.

Buffel et al. (Reference Buffel, Vandenberghe, Goolaerts and Laga2001) regarded the Poederlee Formation as a transitional facies between the fully marine Lillo Formation in the west (the Antwerp area) and the continental/estuarine Mol Formation to the east (Fig. 1b). Based on geometrical arguments and palaeontological evidence, including molluscs, these authors correlated the Poederlee Formation with parts of the shallow marine Lillo Formation (Oorderen Sands, Kruisschans Sands and lower part of Merksem Sands) from the Antwerp area (Fig. 3). They also correlated the Brasschaat Formation with the upper part of the Merksem Sands and Zandvliet Sands of the Lillo Formation in the Antwerp area. Buffel et al. (Reference Buffel, Vandenberghe, Goolaerts and Laga2001) proposed a Piacenzian age for the Poederlee Formation and a late Piacenzian age for the Brasschaat Formation, a viewpoint followed by Vandenberghe et al. (Reference Vandenberghe, Van Simaeys, Steurbaut, Jagt and Felder2004).
3. Historical background
According to Mourlon (Reference Mourlon1882), A. Dumont was the first to describe the sandy deposits in the hills around Poederlee around 1850, and the latter assumed a correlation with the Upper Miocene Diest Formation based on the ferruginous character of the deposits. Cogels & Van Ertborn (Reference Cogels and Van Ertborn1881) were the first to coin the term ‘La roche de Poederlé’ after a mapping campaign. A detailed overview of the literature regarding the stratigraphy of the Poederlee Formation until 1935 was presented by Gullentops & Huyghebaert (Reference Gullentops and Huyghebaert1999).
It was only after 1950 that new insights into Neogene stratigraphy of Belgium arose, based on observations made during large excavation works for the Antwerp harbour (de Heinzelin, Reference de Heinzelin1955). De Heinzelin grouped both the Diest Formation and the superjacent Kasterlee Formation in the Upper Miocene ‘Diestien’ stage, whereas the Kattendijk Formation, the Luchtbal and Oorderen Sands (as the Kallo Sands) were placed in the Pliocene ‘Scaldisien’ stage. Furthermore, a new Pleistocene stage, the ‘Merksemien’, was then established and consisted of the Kruisschans Sands and Merksem Sands. Based on the faunal similarity between the Merksem Sands and the Poederlee Formation (Fig. 3), de Heinzelin (Reference de Heinzelin1955) considered the Poederlee Formation as Lower Pleistocene, hence excluding the presence of Pliocene deposits in the Campine area.
A heterogeneous gravel layer at the base of the Poederlee Formation was observed in the Campine area (Gulinck, Reference Gulinck1960), and was named the Hukkelberg gravel after its locality. Geets (Reference Geets1962) studied mollusc moulds from the limonitic sandstone layer in the upper part of the Poederlee Formation, and suggested a correlation with the Kruisschans Sands of the ‘Merksemien’ stage (the present-day Lillo Formation) as defined by de Heinzelin (Reference de Heinzelin1955). Although the fossil content (mainly bivalves) is strongly weathered and limonitized, Tavernier & de Heinzelin (Reference Tavernier and de Heinzelin1962) identified Cardium parkinsoni, Corbulomya complanata and Mya arenaria, which allowed correlation with the Kruisschans Sands and Merksem Sands (‘Merksemian’ stage) (Fig. 3). These authors considered the Poederlee Formation as a transgressive unit of Pleistocene age in the entire the Campine area, with the Hukkelberg gravel at its base. Gulinck (Reference Gulinck1962) followed these ideas and also considered the Poederlee Formation as a lateral equivalent of the ‘Merksemian’ stage. Vandenberghe et al. (Reference Vandenberghe, Laga, Steurbaut, Hardenbol, Vail, de Graciansky, Hardenbol, Jacquin and Vail1998) agreed with Tavernier & de Heinzelin (Reference Tavernier and de Heinzelin1962) that the Poederlee Formation is the lateral equivalent of the Merksem Sands, although they suggested that sedimentological similarities rather point at an equivalence with the lower part of the Lillo Formation. They attributed a Piacenzian age to the Poederlee Formation.
Buffel et al. (Reference Buffel, Vandenberghe, Goolaerts and Laga2001) studied the Kasterlee and Poederlee formations north of the type locality in four boreholes, and one borehole, located at Oud-Turnhout, is studied herein (Fig. 1a, b). The Kasterlee Formation consists lithologically of glauconitic sands that are fining upward in the unit. The uppermost part of the formation is a zone of poorly cemented, ferruginous sandstone fragments with internal moulds of dissolved molluscs. A basal gravel of small quartz pebbles (the Hukkelberg gravel) separates the overlying Poederlee Formation from the Kasterlee Formation. The lithology of the Poederlee Formation consists of fine-grained glauconitic sands with dispersed shell debris layers. The well-sorted, fine-grained sands in the upper two metres of the Poederlee Formation are called the Heieinde facies or unit (Fig. 4). Molluscs indicate that the Poederlee Formation north of the type locality is a lateral equivalent of the Oorderen Sands Member of the Lillo Formation (Fig. 3). Also, reworked shells from the Luchtbal Sands Member occur in the Poederlee Formation, suggesting that the Luchtbal Sands were deposited in the greater part of northern Belgium, but eroded before the deposition of the Poederlee Formation in the Campine area. Based on a re-evaluation of the mollusc fauna, Buffel et al. (Reference Buffel, Vandenberghe, Goolaerts and Laga2001) refuted the biostratigraphic correlation of the iron sandstone layer at the top of the Poederlee Formation with the Kruisschans Sands proposed by Geets (Reference Geets1962). Buffel et al. (Reference Buffel, Vandenberghe, Goolaerts and Laga2001) rather proposed a correlation of this layer with the base of the Merksem Sands of the Lillo Formation. In summary, they correlated the Poederlee Formation with the Oorderen Sands to Merksem Sands interval in the Antwerp area. Vandenberghe et al. (Reference Vandenberghe, Van Simaeys, Steurbaut, Jagt and Felder2004) considered the Poederlee Formation equivalent to large parts of the Oorderen Sands, Kruisschans Sands and Merksem Sands, and correlated the lower boundary with sequence boundary Za2 at 4.04 Ma (Hardenbol et al. Reference Hardenbol, Thierry, Farley, Jacquin, de Graciansky, Vail, de Graciansky, Hardenbol, Jacquin and Vail1998). An exhaustive overview of the stratigraphy of the Kasterlee Formation is given in Louwye et al. (Reference Louwye, De Schepper, Laga and Vandenberghe2007).
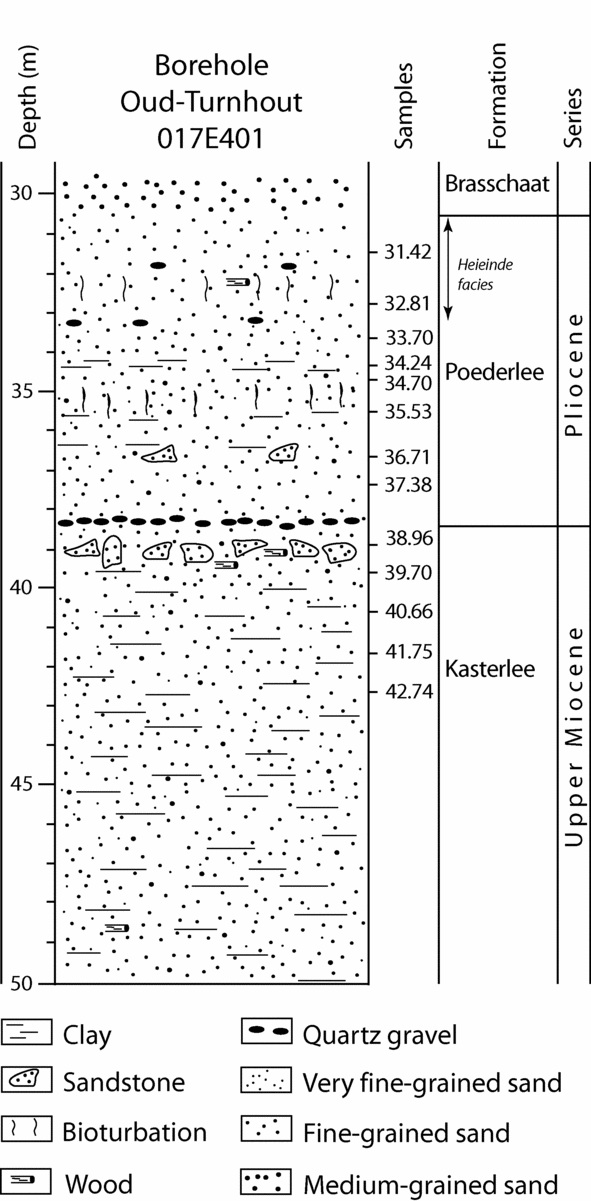
Lithological column and stratigraphic assignment of the units in the studied interval of the Oud-Turnhout borehole. The depths of the samples are referred to the Belgian Ordnance Datum (Tweede Algemene Waterpassing).

4. The study site
The studied borehole Oud-Turnhout (Lambert coordinates X: 192210, Y: 218431; Fig. 1a, b) was drilled in 1998 in the framework of a geological mapping project in Flanders. The borehole was entirely cored to a depth of 50 m (Fig. 4), and is now stored at the Belgian Geological Survey (archive number 017E/0399). It is located in the Campine area, north of the outcrop area of the Poederlee Formation. The lowest lithological unit (50.00 m to 38.71 m) corresponds with the Kasterlee Formation (De Meuter & Laga, Reference De Meuter and Laga1976). It is characterized by a dominant grain size of 125–250 μm, a mica and glauconite fraction, dispersed sand concretions, and varying clay content. Loosely compacted, glauconitic sandstone fragments with internal moulds of shells occur in the top of the sequence, together with fossil wood fragments. The base of this unit was not reached in this borehole.
At the base of the overlying Poederlee Formation (38.71–30.50 m), a layer of small, discoid-shaped quartz pebbles separates this unit from the Kasterlee Formation (Fig. 4). Between 38.71 and 33.30 m, the lithology consists of fine-grained sand with an admixture of coarse glauconite grains and mica. Clayey intercalations and bioturbations are present. Between 33.30 and 30.50 m, well-sorted, fine-grained sand with dispersed pebbles, some wood fragments, and traces of bioturbation are the Heieinde facies of this formation (Buffel et al. Reference Buffel, Vandenberghe, Goolaerts and Laga2001). An abrupt change to the glauconitic, medium-grained sand of the Brasschaat Formation occurs above the Heieinde facies at 30.50 m. A total of 19.50 m of cored sediments from the Kasterlee and Poederlee formations are thus recovered between 50.00 and 30.50 m depth.
5. Materials and Methods
A total of thirteen samples were analysed from the Kasterlee and Poederlee formations (Figs 4, 5) for dinoflagellate cysts and other organic-walled palynomorphs. Test samples from the Brasschaat Formation proved to be barren. The samples were prepared following the palynological maceration technique described in Louwye, Head & De Schepper (Reference Louwye, Head and De Schepper2004), involving removal of carbonates and silicates with HCl and HF, respectively. Residues were filtered on a 20 μm nylon screen, ultrasonicated for 30 seconds, and strew mounted with glycerine jelly. All palynomorphs were analysed on a ZEISS Axioskop light microscope at 200× and 400× magnifications until a minimum of 200 dinoflagellate cysts were counted. This number was sufficient for reliable relative abundance estimates, and counting 300 specimens did not yield significant changes in relative abundances. The remainder of the slide was then scanned for rare species and well-preserved specimens for photomicroscopy. The presence and numbers of acritarchs, green algae, pollen, spores, invertebrate remains and other incertae sedis were noted during the systematic count of the dinoflagellate cysts. Two Lycopodium tablets (batch 483216, for one tablet X = 18 583; standard deviation: 1708; coefficient of variation: 9.19 %) were added for the concentration calculation of in situ palynomorphs following the formula of Stockmarr (Reference Stockmarr1971). Photomicrographs were taken with a ZEISS MRc5 digital camera mounted on a ZEISS Axio Imager microscope. Photomicrographs of selected stratigraphic key species are given in Figures 6 and 7. Nomenclature follows De Schepper, Head & Louwye (Reference De Schepper, Head and Louwye2004), Fensome & Williams (Reference Fensome and Williams2004), De Schepper & Head (Reference De Schepper and Head2008a) and Louwye, Mertens & Vercauteren (Reference Louwye, Mertens and Vercauteren2008). Timescale is after Lourens et al. (Reference Lourens, Hilgens, Shackleton, Laskar, Wilson, Gradstein, Ogg and Smith2005) and the stratigraphic subdivision of the Pliocene follows Gibbard et al. (Reference Gibbard, Head and Walker2010). All slides are housed in the collection of the Research Unit Palaeontology of Ghent University.
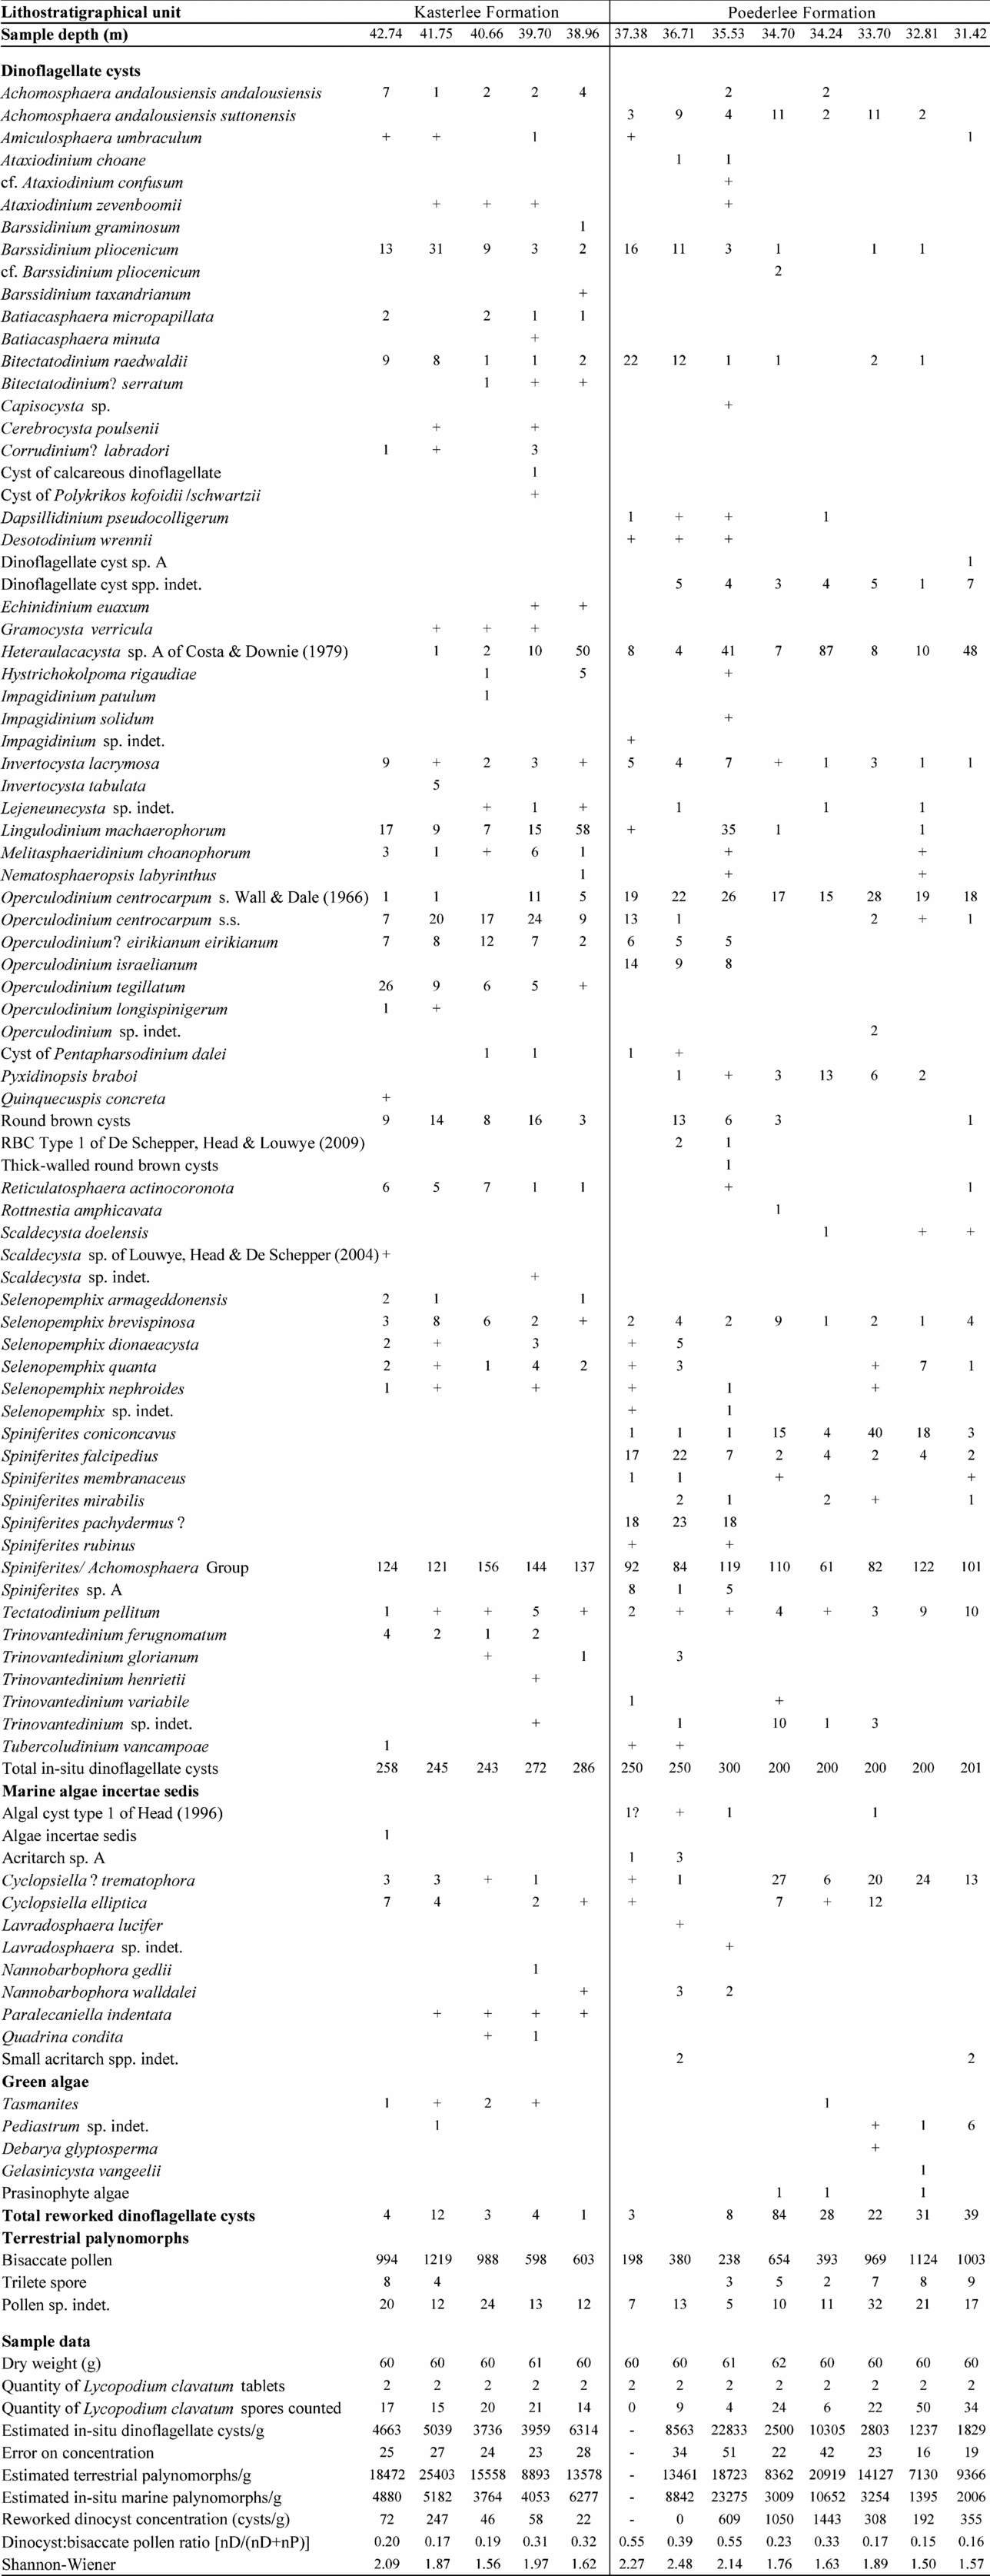
Raw counts of marine and terrestrial palynomorphs in the Oud-Turnhout borehole. A ‘+’ indicates that a species was recorded outside the systematic count. For the Shannon-Wiener diversity index (Krebs, Reference Krebs1998) only the taxa encountered within the count were used.

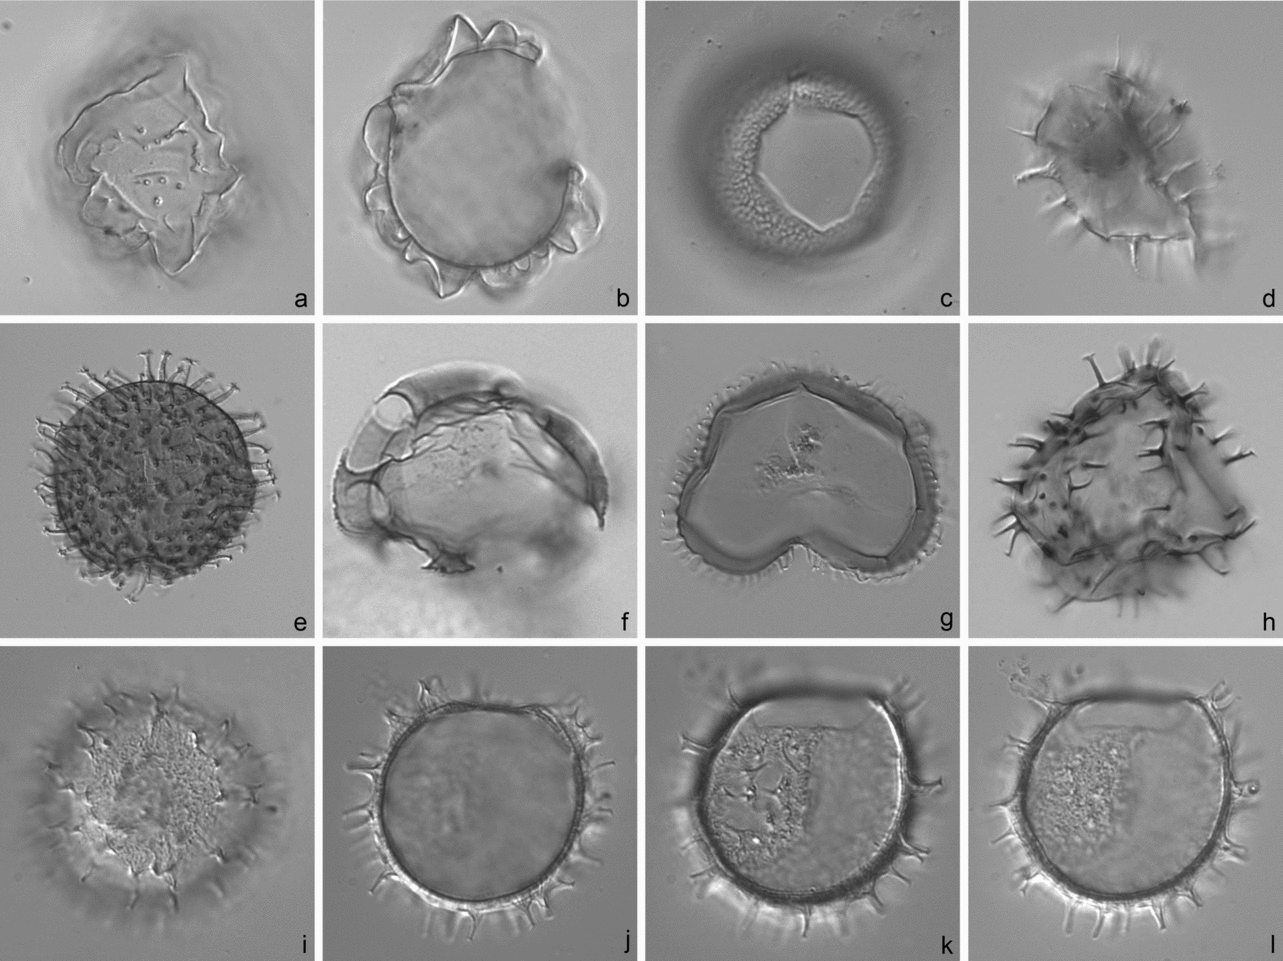
All photomicrographs taken in bright field. Sample number, slide number and England Finder reference are given. All specimens are from the Kasterlee Formation. (a, b) Ataxiodinium zevenboomii Head. High focus on left lateral surface (a) and optical section (b). Sample 39.70 m, p2, T35/3. Maximum length central body, 33 μm. (c) Batiacasphaera minuta (Matsuoka) Matsuoka & Head. Apical view on apical archaeopyle. Sample 39.70 m, p2, M24/4. Maximum diameter archaeopyle, 15 μm. (d) Nannobarbophora walldalei Head. High focus and orientation uncertain. Sample 38.96 m, p1, R19/2. Length processes approximately, 7 μm. (e) Barssidinium pliocenicum (Head) Head. Dorsal view on dorsal surface. Sample 40.66 m, p1, E24/1. Maximum diameter central body, 73 μm. (f) Selenopemphix armageddonensis de Verteuil & Norris. Dorsal view on dorsal surface. Sample 41.75, p1, V23/1. Maximum diameter central body excluding processes, 33 μm. (g) Selenopemphix brevispinosa brevispinosa (autonym). Dorsal view on dorsal surface. Sample 40.66 m, p1, C37/1. Maximum diameter excluding processes, 47 μm. (h) Trinovantedinium ferugnomatum de Verteuil & Norris. High focus on processes. Sample 42.74 m, p1, G32/3. Maximum diameter excluding processes, 38 μm; maximum length processes, 6 μm. (i–l) Operculodinium tegillatum Head. Antapical view of antapex (i), optical section (j), upper archaeopyle margin (k) and apex (l). Sample 38.96 m, p1, G21/1. Maximum diameter central body, 35 μm.

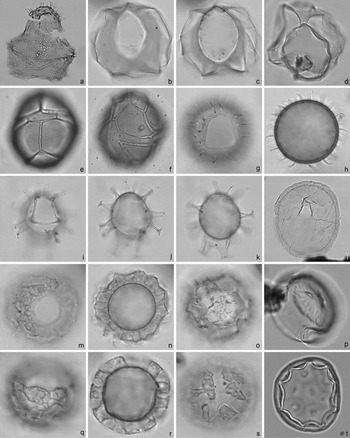
All photomicrographs taken in bright field. Sample number, slide number and England Finder reference are given. All specimens are from the Poederlee Formation. (a) Dinoflagellate cyst sp. A. Composite picture of various foci. Sample 31.42 m, p1, G25/0. Maximum length central body, 70 μm; maximum width central body, 64 μm. (b, c) Invertocysta lacrymosa Edwards. Dorsal view of (b) upper focus on dorsal surface with large archaeopyle and (c) mid-focus. Sample 36.71 m, p1, H57/3. Maximum length central body, 39 μm; maximum width central body, 29 μm. (d) Amiculosphaera umbraculum Harland. Ventral view on mid-focus; note funnel-shaped structure connecting apical area of periblast with endoblast. Sample 37.38 m, p1, V48/0. Maximum length central body: 36 μm; maximum width central body, 28 μm; maximum length, 50 μm; maximum width, 50 μm. (e, f) Impagidinium solidum Versteegh & Zevenboom in Versteegh. Oblique ventral view of (e) dorsal surface showing archaeopyle, cingulum, postcingular and antapical plates and (f) ventral surface, apical plates and cingulum. Note that cyst wall is brown coloured. Sample 35.53 m, p1, R42/1. Maximum length, 44.5 μm; maximum width, 37 μm, wall thickness, 1.2–1.5 μm. (g, h) Operculodinium? eirikianum eirikianum (autonym). Dorsal view of (g) dorsal surface with large archaeopyle, and (h) mid-focus. Sample 36.71 m, p1, R32/0. Maximum diameter cyst excluding processes, 35 μm; maximum process length, 5.8 μm; wall thickness, 1.3–1.5 μm. (i–k) Spiniferites sp. A. Dorsal view of (i) dorsal surface with archaeopyle, and (j, k) two slightly lower mid-foci, revealing a flange between two antapical processes. Sample 36.71 m, p1, R45/2. Maximum length central body, 35 μm; maximum width central body, 32 μm. (l) Cyclopsiella? trematophora (Cookson & Eisenack) Lentin and Williams. High focus on uncertain view. Sample 34.70 m, p1, C56/1. Maximum diameter, 27 μm. (m–o) Lavradosphaera lucifer De Schepper & Head. Sample 36.71m, p1, L39/4. Apical view of (m) apical surface with rounded pylome, (n) mid-focus and (o) antapical surface. Sample 36.71 m, p1, L39/4. Maximum diameter cyst excluding processes, 17 μm. (p) Zygospore of Debarya glyptosperma (De Bary) Wittrock. Polar view. Sample 32.81 m, p1, B36/4. Maximum diameter, 32 μm. (q–s) Lavradosphaera sp. Oblique apical view of (q) upper focus on pylome, (r) mid-focus, and (s) lower focus. Sample 35.53 m, p1, R51/4. Maximum diameter cyst excluding processes, 19 μm. (t) Gelasinicysta vangeelii Head. Polar view. Sample 32.81 m, p1, F46/0. Maximum diameter, 34 μm.

6. Palynological analysis: results
In most samples, pollen grains are much more abundant than dinoflagellate cysts (Fig. 5). Only samples 37.38 m and 35.53 m yield more dinoflagellate cysts than pollen grains. Unfortunately, terrestrial palynomorphs are of limited biostratigraphic value in this study because of the selective loss of small specimens after sieving on a 20 μm mesh. The preservation of the marine palynomorphs is good to excellent. The presence of well-preserved protoperidinioid dinoflagellate cysts indicates that little or no post-depositional oxidation took place.
A total of 74 dinoflagellate cyst, eleven acritarch and five chlorophycean algae taxa are recorded in the Kasterlee and Poederlee formations together (Fig. 5). The assemblages in both formations are dominated by gonyaulacacean species. Highest numbers of protoperidiniacean cysts are recorded in the Kasterlee Formation (sample 41.75 m). Reworked pre-Neogene dinoflagellate cysts, pollen, spores and acritarchs are present in every sample (Fig. 5), but their numbers are relatively unimportant except in samples 34.70 m and 34.24 m, where respectively 1082 and 1443 reworked dinoflagellate cysts per gram are recorded.
A total of 47 dinoflagellate cyst taxa are recorded in the Kasterlee Formation. Undetermined specimens of the genera Spiniferites and Achomosphaera are grouped as Spiniferites/Achomosphaera spp. This group constitutes at least ~ 50 % of the assemblage in every sample, with the highest abundance of almost 65 % in sample 40.66 m. Lingulodinium machaerophorum and Operculodinium centrocarpum s.s. are other species with high relative abundances. Operculodinium tegillatum is well represented in the lowest sample (42.74 m).
Fifty-three dinoflagellate cyst taxa are recorded in the Poederlee Formation. The Spiniferites/Achomosphaera spp. group is abundant to dominant in every sample. Other common species are Achomosphaera andalousiensis suttonensis, Operculodinium centrocarpum sensu Wall & Dale (Reference Wall and Dale1966) and Spiniferites coniconcavus. The taxa Barssidinium pliocenicum, Bitectatodinium raedwaldii, Operculodinium centrocarpum s.s., Operculodinium? eirikianum eirikianum and Operculodinium israelianum have high relative abundances at the base of the unit.
Heteraulacacysta sp. A of Costa & Downie (Reference Costa, Downie, Montadert, Roberts, De Charpal and Guennoc1979) is recorded in almost every sample, and is very abundant at the top of the Kasterlee Formation (sample 38.96 m) and in sample 34.24 m of the Poederlee Formation. This species is a common element of Miocene (Louwye et al. Reference Louwye, De Schepper, Laga and Vandenberghe2007) and Pliocene assemblages (Head, Reference Head1993; Louwye, Head & De Schepper, Reference Louwye, Head and De Schepper2004; De Schepper, Head & Louwye, Reference De Schepper, Head and Louwye2009).
Cyclopsiella? trematophora (Fig. 7l) is the most common acritarch. Impagidinium solidum (sample 35.53 m; Fig. 7e, f) and the acritarch Lavradosphaera lucifer (sample 36.71 m; Fig. 7m–o) were recorded for the first time in the North Sea Basin.
Operculodinium tegillatum was defined by Head (Reference Head1997) from the mid-Pliocene of eastern England. According to De Schepper & Head (Reference De Schepper and Head2008b), the lowest occurrence of this species was recorded from DSDP Hole 603C in the western North Atlantic and is located at 5.02 Ma (based on unpub. data of M. J. Head). The morphologically similar Operculodinium? pontis was described for the first time by Zevenboom & Santarelli in Zevenboom (D. Zevenboom, unpub. Ph.D. thesis, Univ. Utrecht, 1995) from the Upper Miocene and Pliocene of the Boxmeer well in the Netherlands. Louwye & Laga (Reference Louwye and Laga1998) identified Operculodinum? pontis in the Upper Miocene Diest Formation and the Pliocene Kattendijk and Lillo formations in the Kalmthout well of northern Belgium. Louwye (Reference Louwye1999) formally defined Operculodinium antwerpensis from the Upper Miocene Diest Formation, and considered Operculodinium? pontis Zevenboom & Santarelli in Zevenboom (D. Zevenboom, unpub. Ph.D. thesis, Univ. Utrecht, 1995) as a manuscript name and synonymous. Louwye (Reference Louwye1999) regarded the continuous periphragm and the proximally to medially joined processes a sufficient argument to differentiate Operculodinium antwerpensis from Operculodinium tegillatum. However, new observations from the Kasterlee Formation showed both morphological criteria to be insufficient for discriminating between both species. The degree of perforation of the tegillum, and the degree of connection between processes, medially or proximally, is a variable feature within this taxon (Fig. 6i–l). Based on these observations, Operculodinium antwerpensis Louwye (Reference Louwye1999) is here considered as a junior synomym of Operculodinium tegillatum Head (Reference Head1997).
7. Biostratigraphy
7.a. Kasterlee Formation
The dinoflagellate cyst assemblage recorded from the Kasterlee Formation in the Oud-Turnhout borehole compares well to other records from the same formation in shallower environments identified in the Dessel-2 borehole and Olen outcrop (Louwye et al. Reference Louwye, De Schepper, Laga and Vandenberghe2007), although the relative abundance of certain species (e.g. Gramocysta verricula) is lower. Only four dinoflagellate cyst species encountered in the Kasterlee Formation have a biostratigraphic value and allow correlations to the timescale of Lourens et al. (Reference Lourens, Hilgens, Shackleton, Laskar, Wilson, Gradstein, Ogg and Smith2005).
Trinovantedinium ferugnomatum is recorded in low abundance in the Kasterlee Formation (Figs 5, 6h). Trinovantedinium ferugnomatum was recorded for the first time by de Verteuil & Norris (Reference de Verteuil, Norris, Head and Wrenn1992) in the Middle and Upper Miocene from the Maryland and Virginia Coastal Plain. The highest occurrence (HO) is placed in the dinoflagellate cyst zone DN10 of late Tortonian to Messinian age (de Verteuil & Norris, Reference de Verteuil and Norris1996) (Fig. 8). This species has also been recorded from Middle and Upper Miocene deposits of the southern North Sea Basin (Louwye, Reference Louwye2002; Louwye et al. Reference Louwye, De Schepper, Laga and Vandenberghe2007; Louwye & Laga, Reference Louwye and Laga2008) and the Porcupine basin (Louwye et al. Reference Louwye, Foubert, Mertens and Van Rooij2008). Records from the Mogarts Beach Member of the Yorktown Formation (Upper Pliocene) by de Verteuil & Norris (Reference de Verteuil, Norris, Head and Wrenn1992) and the Lower Pliocene Kattendijk Formation of northern Belgium (Louwye, Head & De Schepper, Reference Louwye, Head and De Schepper2004; De Schepper, Head & Louwye, Reference De Schepper, Head and Louwye2009) probably represent reworking.
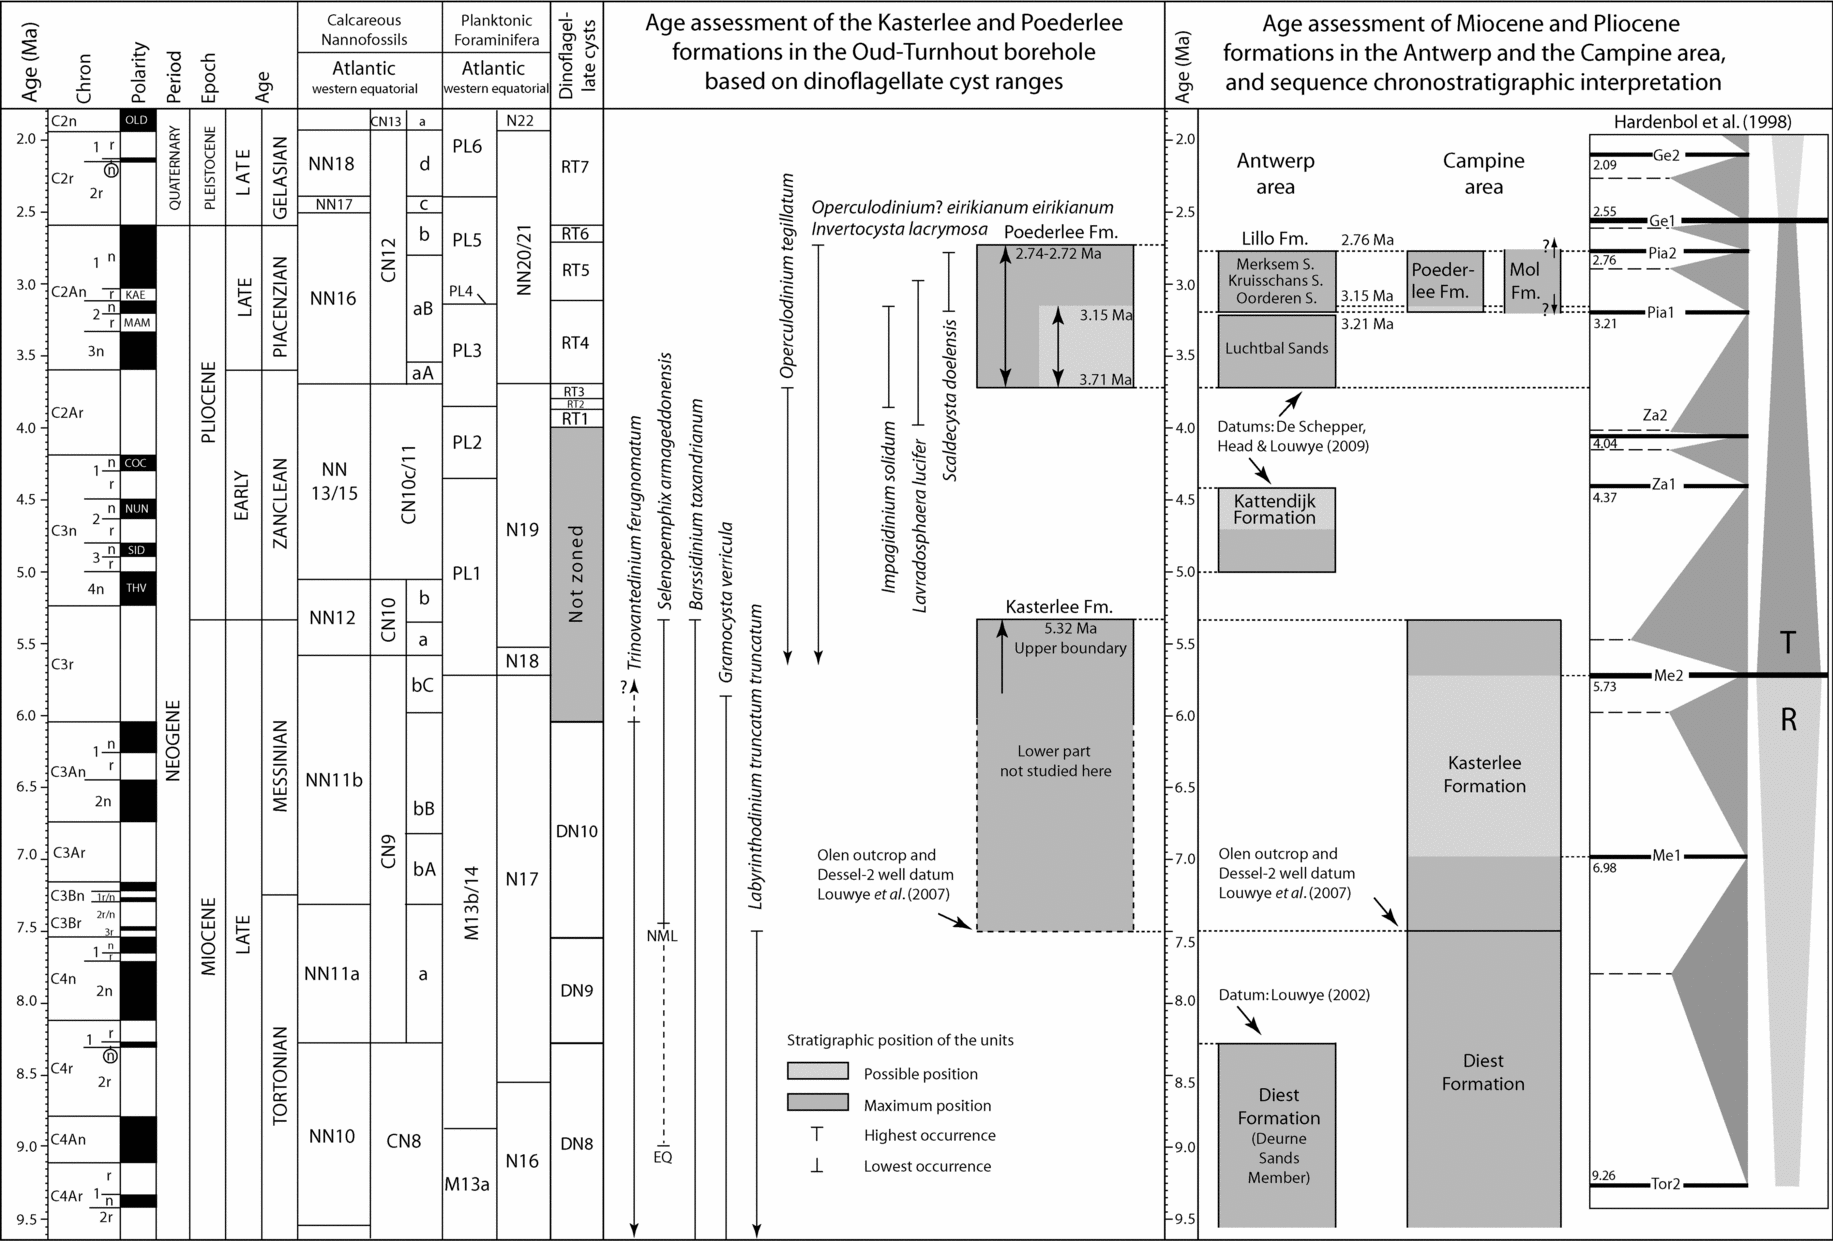
Left panel: absolute and relative age, geomagnetic polarity, calcareous microfossil biozones, and Miocene dinoflagellate cyst zonation of the USA eastern coast. Time scale used is the ATNTS 2004 (Lourens et al. Reference Lourens, Hilgens, Shackleton, Laskar, Wilson, Gradstein, Ogg and Smith2005), but we follow Gibbard et al. (Reference Gibbard, Head and Walker2009) for the position of the Pliocene–Pleistocene boundary. Abbreviations in Polarity column are OLD – Olduvai, KAE – Kaena, MAM – Mammoth, COC – Cochiti, SID – Sidufjall, THV – Thvera. The dinoflagellate cyst zonation for the Miocene (DN zones) is from de Verteuil & Norris (Reference de Verteuil and Norris1996) and for the Pliocene (RT zones) from De Schepper & Head (Reference De Schepper and Head2009). Middle panel: stratigraphic range of selected dinoflagellate cysts used for the relative age assessment of the Kasterlee and Poederlee formations, for which a maximum and possible (minimum) age assessment is given. Right panel: combined dinoflagellate cyst and sequence stratigraphic age assessment for the Kasterlee and Poederlee formations. Their position in relation to other Neogene stratigraphic units in northern Belgium and to sequence stratigraphy of Hardenbol et al. (Reference Hardenbol, Thierry, Farley, Jacquin, de Graciansky, Vail, de Graciansky, Hardenbol, Jacquin and Vail1998) is also given. Regressive (R) and transgressive (T) cycles are after Haq, Hardenbol & Vail (Reference Haq, Hardenbol and Vail1987). Thin dashed horizontal lines represent correlation and age indication. Arrows indicate time ranges. HML – Northern Hemisphere Mid-latitude; EQ – Equatorial. Ranges of dinoflagellate cysts and position of the Neogene units of northern Belgium are based on this study and de Verteuil & Norris (Reference de Verteuil, Norris, Head and Wrenn1992, Reference de Verteuil and Norris1996), Louwye (Reference Louwye1999, Reference Louwye2002), Warny & Wrenn (Reference Warny and Wrenn2002), De Schepper, Head & Louwye (Reference De Schepper, Head and Louwye2004), Louwye, Head & De Schepper (Reference Louwye, Head and De Schepper2004), Munsterman & Brinkhuis (Reference Munsterman and Brinkhuis2004), Williams et al. (Reference Williams, Brinkhuis, Pearce, Fensome, Weegink, Exon, Kennett and Malone2004), Louwye et al. (Reference Louwye, De Schepper, Laga and Vandenberghe2007), Louwye & Laga (Reference Louwye and Laga2008), De Schepper & Head (Reference De Schepper and Head2008a,Reference De Schepper and Headb), De Schepper, Head & Louwye (Reference De Schepper, Head and Louwye2009) and references therein.

Selenopemphix armageddonensis is present in low abundances in three samples of the Kasterlee Formation (Figs 5, 6f). It was previously recorded in the latest Tortonian to Messinian Kasterlee Formation by Louwye et al. (Reference Louwye, De Schepper, Laga and Vandenberghe2007). The latter authors give an extensive overview of published Miocene records of this species, and assume no in situ Pliocene records. According to Williams et al. (Reference Williams, Brinkhuis, Pearce, Fensome, Weegink, Exon, Kennett and Malone2004), Selenopemphix armageddonensis has a lowest occurrence at 9.0 Ma in equatorial areas and at 7.45 Ma in the northern hemisphere mid-latitudes. Based on data from Zevenboom (D. Zevenboom, unpub. Ph. D. thesis, Univ. Utrecht, 1995) from the Mediterranean realm, Williams et al. (Reference Williams, Brinkhuis, Pearce, Fensome, Weegink, Exon, Kennett and Malone2004) place the HO of this species at the Miocene–Pliocene boundary (5.32 Ma) in equatorial areas. Warny & Wrenn (Reference Warny and Wrenn2002) recorded Selenopemphix armageddonensis in the Messinian of Morocco and southern Spain, and place the HO also at the Miocene–Pliocene boundary (Fig. 8). Single records of Selenopemphix armageddonensis are reported in Pliocene deposits from the southern North Sea Basin (Louwye, Head & De Schepper, Reference Louwye, Head and De Schepper2004), from the Utsira Formation in the northern Viking Graben (Piasecki, Gregersen & Johannessen, Reference Piasecki, Gregersen and Johannessen2002) and from the Yorktown Formation in Virginia, USA (Edwards et al. Reference Edwards, Barron, Bukry, Bybell, Cronin, Poag, Weems, Wingard, Horton, Powars and Gohn2005). The latter records thus most probably represent reworking, since Selenopemphix armageddonensis is not reported from other Lower Pliocene assemblages.
Barssidinium taxandrianum is a rare species, recorded only from the southern North Sea Basin in Upper Miocene deposits. It was recorded for the first time in the Tortonian Diest Formation from northern Belgium by Louwye (Reference Louwye1999), and later also by Louwye et al. (Reference Louwye, De Schepper, Laga and Vandenberghe2007) and Louwye & Laga (Reference Louwye and Laga2008). Other records are from the early to middle Tortonian Deurne Sands Member (lower part of the Diest Formation) (Louwye, Reference Louwye2002), and the late Tortonian to Messinian Kasterlee Formation (Louwye et al. Reference Louwye, De Schepper, Laga and Vandenberghe2007). No Pliocene records are known.
A detailed overview of the stratigraphic occurrences and ranges of Gramocysta verricula is given by Louwye et al. (Reference Louwye, De Schepper, Laga and Vandenberghe2007). Geographically, the species is apparently restricted to the North Sea Basin, the western North Atlantic realm and the eastern Mediterranean, and has a published HO at the base of Chron C3r (middle Messinian) in the Miocene of Morocco (Warny & Wrenn, Reference Warny and Wrenn2002) (Fig. 8). No in situ Pliocene records are known. The morphology of Gramocysta verricula from the Kasterlee Formation is illustrated in Louwye et al. (Reference Louwye, De Schepper, Laga and Vandenberghe2007, fig. 8h–j).
Labyrinthodinium truncatum truncatum does not occur in the Kasterlee Formation of this study, but was recorded from the very basal part of this formation in the Olen outcrop (Louwye et al. Reference Louwye, De Schepper, Laga and Vandenberghe2007). It is a common species in the greater part of the Tortonian Diest Formation of northern Belgium. Its HO is situated in the upper part of Chron C4n at c. 7.5 Ma, that is, the latest Tortonian (de Verteuil & Norris, Reference de Verteuil and Norris1996; Munsterman & Brinkhuis, Reference Munsterman and Brinkhuis2004; see Louwye et al. Reference Louwye, De Schepper, Laga and Vandenberghe2007 for an overview of the stratigraphic ranges) (Fig. 8). Species with a known post-Miocene lowest occurrence (LO) are not encountered in the Kasterlee Formation.
The age of the Kasterlee Formation from the Oud-Turnhout borehole relies on the ranges of key dinoflagellate cyst species such as Selenopemphix armageddonensis, Trinovantedinium ferugnomatum, Barssidinium taxandrianum and Gramocysta verricula, and the absence of Labyrinthodinium truncatum truncatum and typical Pliocene species. Because only the upper part of the sequence was analysed (Fig. 4), it is obvious that an age estimate for the entire formation cannot be proposed. The formation at Oud-Turnhout is younger than 7.5 Ma and older than 5.32 Ma.
7.b. Poederlee Formation
The presence of Achomosphaera andalousiensis suttonensis, Barssidinium spp., Invertocysta lacrymosa, Operculodinium? eirikianum eirikianum and Selenopemphix brevispinosa places the Poederlee Sands firmly within the Pliocene. Other components of the Poederlee assemblage such as Pyxidinopsis braboi, Scaldecysta doelensis and Spiniferites coniconcavus were first described from the Piacenzian Lillo Formation (Belgium, Antwerp Harbour area), and more precisely from the Basal Shelly Unit, Oorderen Sands Member and Kruisschans Sands Member (De Schepper, Head & Louwye, Reference De Schepper, Head and Louwye2004). The apparent HOs of Desotodinium wrennii and Operculodinium? eirikianum eirikianum within the Poederlee Formation are likely environmentally controlled and do not reflect their true stratigraphic range. Nevertheless, they suggest a correlation of the Poederlee Formation with the upper part of the Lillo Formation.
The palynological assemblage of the Poederlee Sands is very comparable to the Oorderen Sands Member (Louwye, Head & De Schepper, Reference Louwye, Head and De Schepper2004; De Schepper, Head & Louwye, Reference De Schepper, Head and Louwye2009) and marker events are found in both units. The LO of Scaldecysta doelensis is halfway up the Poederlee Sands, comparable to its first record within the Oorderen Sands at the Antwerp Harbour sections. Invertocysta lacrymosa is recorded throughout the Poederlee Sands, comparable to the Oorderen Sands Member record in the Tunnel-Canal Dock section (De Schepper, Head & Louwye, Reference De Schepper, Head and Louwye2009). In the Verrebroek and Deurganck docks, this species ranges to halfway up the Oorderen Sands Member (Louwye, Head & De Schepper, Reference Louwye, Head and De Schepper2004), where its HO is likely environmentally controlled.
Reticulatosphaera actinocoronata is recorded persistently in the Kasterlee Formation but is almost completely absent from the Poederlee Formation. The two single records of Reticulatosphaera actinocoronata in the Poederlee Formation are attributed to reworking. This species ranges no higher than c. 4.7 Ma (Louwye, Head & De Schepper, Reference Louwye, Head and De Schepper2004; De Schepper, Head & Louwye, Reference De Schepper, Head and Louwye2009), suggesting that the Poederlee Formation is at least younger than 4.7 Ma. The maximum age of this unit can be determined more accurately from the absence of biostratigraphic markers such as Batiacasphaera minuta/micropapillata (Fig. 6c) and Operculodinium tegillatum (Fig. 6i–l). The absence of both species excludes a correlation with the eastern North Atlantic RT1 to RT3 zones from De Schepper & Head (Reference De Schepper and Head2009) (Fig. 8). Batiacasphaera minuta/micropapillata has a HO at c. 3.83 Ma in DSDP Hole 610A (De Schepper & Head, Reference De Schepper and Head2008b) and was recorded in situ in the southern North Sea Basin from the Zanclean Kattendijk Sands only. Operculodinium tegillatum is also common in the Kattendijk Sands (5.0 to 4.7–4.4 Ma), where it has its HO in the southern North Sea (Louwye, Head & De Schepper, Reference Louwye, Head and De Schepper2004; De Schepper, Head & Louwye, Reference De Schepper, Head and Louwye2009). It ranges up to 3.71 Ma in the eastern North Atlantic (De Schepper & Head, Reference De Schepper and Head2008b) (Fig. 8). Thus, the Poederlee Formation is likely younger than 3.71 Ma.
The Poederlee Formation is also likely older than 2.74 Ma. This is derived from the presence of Invertocysta lacrymosa (Fig. 7b, c), Operculodinium? eirikianum eirikianum (Fig. 7g, h) and the acritarch Algal cyst type 1 of Head (Reference Head1996), which suggests a correlation with the RT4 and RT5 zones of De Schepper & Head (Reference De Schepper and Head2009) (Fig. 8). Operculodinium? eirikianum eirikianum has not been recorded in deposits younger than c. 2.0 Ma and has a HO at 2.62 Ma in the eastern North Atlantic (De Schepper & Head, Reference De Schepper and Head2008b, Reference De Schepper and Head2009). The highest occurrence of Invertocysta lacrymosa is relatively synchronous at around 2.72–2.74 Ma in the North Atlantic area (De Schepper & Head, Reference De Schepper and Head2008b). Algal cyst type 1 of Head (Reference Head1996) is infrequently recorded in the Poederlee Formation. It disappears from the record in the eastern North Atlantic around 2.74 Ma, but is recorded up to 1.8 Ma in eastern England (Head, Reference Head1998) (Fig. 8).
Further hints about the age of the Poederlee Formation come from occurrences of two palynomorph taxa, previously unknown from the North Sea Basin. Their record outside the regular counts should not limit their stratigraphic value, as they are usually recorded in low abundances only in the North Atlantic (De Schepper & Head Reference De Schepper and Head2008b; SDS, pers. obs.). Firstly, a dinoflagellate cyst of the genus Impagidinium, thus far only reported from the Mediterranean and North Atlantic (Versteegh, Reference Versteegh1997; De Schepper & Head, Reference De Schepper and Head2008b), suggests an even more restricted stratigraphic range for the Poederlee Sands. The brown coloured Impagidinium solidum (sample 35.53 m; Fig. 7e, f) has a maximum range between 3.87 and 3.15 Ma in the eastern (DSDP Hole 610A) and western North Atlantic (603C) (De Schepper & Head, Reference De Schepper and Head2008b). Although the LO of this species may be before 3.87 Ma, this age fits well with the estimated maximum age for the Poederlee Formation. When oceanic taxa (e.g. Impagidinium) are recorded in shallow marine deposits, they are likely displaced from open marine environments (e.g. Dale, Reference Dale, Jansonius and McGregor1996). Nevertheless, it is likely a contemporaneous element, just like other specimens of Impagidinium in the Neogene units of northern Belgium (Louwye, Head & De Schepper, Reference Louwye, Head and De Schepper2004; Louwye & Laga, Reference Louwye and Laga2008; De Schepper, Head & Louwye, Reference De Schepper, Head and Louwye2009). Secondly, a rarely recorded acritarch taxon corroborates this assessment and provides further detail. In sample 36.71 m, the occurrence of acritarch Lavradosphaera lucifer (Fig. 7m–o) narrows down the age range for the unit. The currently known stratigraphic range in the eastern North Atlantic DSDP Hole 610A is from 3.98 to 2.97 Ma (De Schepper & Head, Reference De Schepper and Head2008b) (Fig. 8).
The range based on dinoflagellate cysts and acritarchs for this unit is thus maximally between 3.71 and 2.74–2.72 Ma, comparable to the age assessment of the Oorderen Sands (De Schepper, Head & Louwye, Reference De Schepper, Head and Louwye2009). When considering the ranges of Lavradosphaera lucifer (3.98–2.97 Ma) and Impagidinium solidum (3.87–3.15 Ma), the Poederlee Sands could even have been deposited before 3.15 Ma, although we cannot exclude the possibility that these specimens are reworked. The dinoflagellate cyst assemblage corresponds to the eastern North Atlantic RT4 and RT5 zones, and is possibly restricted to the RT4 zone (Fig. 8).
8. Palaeoenvironmental analysis
8.a. Kasterlee Formation
The dinoflagellate cyst assemblage recorded from the Kasterlee Formation at our study site consistently reflects an inner to outer neritic marine environment. Neritic genera such as Achomosphaera, Lingulodinium, Operculodinium and Spiniferites dominate the assemblage. Dinoflagellate cyst species with an oceanic affinity are almost completely absent; only one specimen of the oceanic genus Impagidinium was recorded in sample 40.66 m. Gramocysta verricula is a dinoflagellate cyst with an affinity for shallow to shoaling marine environments (Warny & Wrenn, Reference Warny and Wrenn2002), and is recorded in low numbers in this study. Geonettia clineae is characteristic for open bay environments typified by low sediment influx, and is absent in this study. Both species are, however, markedly present in the more shallow marine facies of the Kasterlee Formation identified at the Dessel-2 borehole and Olen outcrop, and occur even in very high numbers in the upper part of the sequence (Louwye et al. Reference Louwye, De Schepper, Laga and Vandenberghe2007). There, the study sites are closer to the palaeo-shoreline than in the Oud-Turnhout borehole of this study (Fig. 1).
Further evidence of the shallow marine environment comes from the continental palynomorphs. The dinoflagellate cysts are in every sample outnumbered by bissacate pollen, most likely blown into the depositional environment by the wind. The dinoflagellate cyst versus bisaccate pollen ratio is minimally 0.17 and maximally 0.32, which means that there are at least three pollen grains for every dinoflagellate cyst in the uppermost sample of this unit (38.96 m).
Chlorophycean palynomorphs such as Pediastrum are scarce. Pediastrum normally occurs in low-energy freshwater environments, but according to Head et al. (Reference Head, Seidenkrantz, Janczyk-Kopikowa, Marks and Gibbard2005) can thrive also in brackish water environments with salinities lower than 5–10 psu. The occurrence of a single specimen in the Kasterlee Formation at Oud-Turnhout contrasts sharply with the large numbers of Pediastrum boryanum recorded in the shallow marine facies of this unit in the Dessel borehole and Olen outcrop (Louwye et al. Reference Louwye, De Schepper, Laga and Vandenberghe2007; Fig. 1). At the latter localities, a freshwater component was brought into the depositional environment via rivers of the palaeo-Meuse and Gete basin.
The acritarch plexus Cyclopsiella granosa/elliptica is present in every sample, except in sample 40.66 m. An overview of previous records and a reconstruction of the ecological preferences of the genus Cyclopsiella were compiled by Louwye & Laga (Reference Louwye and Laga2008), and revealed the species to be characteristic for shallow marine to near-shore high energetic environments. Moreover, these palynomorphs most probably had an encrusting or epilithic mode of life (Matsuoka & Head, Reference Matsuoka, Head, Head and Wrenn1992), and thus lived in the photic zone.
These findings corroborate the sedimentological analysis of the Kasterlee Formation in an outcrop at Lichtaart (Fig. 1) by Gullentops & Huyghebaert (Reference Gullentops and Huyghebaert1999). Granulometric and heavy mineral analysis indicated that the upper part of the formation was deposited in a near-shore environment with long shore drift of very well-sorted fine sands rich in hornblende.
8.b. Poederlee Formation
The palynological assemblage of the Poederlee Formation is also heavily dominated by terrestrial palynomorphs, which always exceed the counted dinoflagellate cysts. In the upper three samples, for each dinoflagellate cyst counted there are about five pollen grains, mainly bisaccate pollen. This suggests a close proximity to the coast and possibly a shoaling during deposition of the upper part of the unit.
Nevertheless, dinoflagellate cysts are abundant in the record, but concentration estimates are questionable due to the limited amount of Lycopodium clavatum marker grains recorded. The errors on the concentrations of samples 36.71 m, 35.53 m and 34.24 m exceed 34 % and are considered questionable (Fig. 5). In the other four samples an error below 25 % on the concentration could be attained, and for these samples the concentration of 1237–2803 cysts/g compares well to the values of the Oorderen Sands (Louwye, Head & De Schepper, Reference Louwye, Head and De Schepper2004; De Schepper, Head & Louwye, Reference De Schepper, Head and Louwye2009). The error could not be calculated for sample 37.38 m since no Lycopodium marker grains were counted.
Spiniferites/Achomosphaera spp. indet. dominate the record throughout, clearly indicating neritic environments. The shoaling of the environment upwards in the unit is indicated by the higher abundance of terrestrial palynomorphs and the first appearance of Scaldecysta doelensis. Spiniferites coniconcavus, a species with reduced, blunt, conical processes, becomes more abundant in the upper part of the unit. The processes of several species of Spiniferites/Achomosphaera spp. indet. are reduced in number and in shape, possibly due to a more turbulent and shallow environment. The dinoflagellate cyst diversity (Shannon-Wiener index, Fig. 5) drops in sample 34.70 m and remains low in the samples above, also likely an expression of the shoaling environment and input of fresh water. Freshwater palynomorphs such as Gelasinicysta vangeelii, Debarya glyptosperma and Pediastrum are recorded only in the upper part of the Poederlee Sands. Increased reworking from 35.53 m upwards points further at increased erosion of the hinterland. Reworked dinoflagellate cysts can originate from coastal erosion during maximum transgression or can be brought into the basin via rivers following erosion of deposits in the hinterland. This mechanism was proposed for the reworked Cretaceous to Miocene dinoflagellate cysts, and mostly Eocene dinoflagellate cysts recorded in the Pliocene deposits of the Antwerp Harbour area (De Schepper, Head & Louwye, Reference De Schepper, Head and Louwye2009).
9. Discussion and conclusions
In the Oud-Turnhout area, the sediments of the Kasterlee Formation were deposited in a neritic environment as attested to by the dominant neritic dinoflagellate cyst assemblage. Terrestrial palynomorphs significantly outnumber the dinoflagellate cysts in almost every sample and are indicative of the nearby presence of the continent. The quasi-absence of freshwater algae points to a limited fluviatile input. The Kasterlee Formation in the area of Oud-Turnhout was thus deposited in deeper neritic environments compared to the Dessel-2 borehole and Olen outcrop (Fig. 1), where a shallow marine facies is recorded following deposition in a truly coastal environment, characterized by a distinct shoaling phase (Louwye et al. Reference Louwye, De Schepper, Laga and Vandenberghe2007). Therefore, the Kasterlee Formation shows in the Campine area a deepening of the depositional environment in a northerly direction.
The stratigraphic ranges of the dinoflagellate cysts confine the age of the Kasterlee Formation in the Oud-Turnhout borehole between 7.5 and 5.32 Ma (latest Tortonian to Messinian), comparable to the age proposed by Louwye et al. (Reference Louwye, De Schepper, Laga and Vandenberghe2007). The unconformity at the top of the Kasterlee Formation can be correlated with the major sequence boundary Me2 of Hardenbol et al. (Reference Hardenbol, Thierry, Farley, Jacquin, de Graciansky, Vail, de Graciansky, Hardenbol, Jacquin and Vail1998), which is dated at 5.73 Ma. The combination of dinoflagellate cyst stratigraphy with sequence stratigraphy narrows the time frame for deposition between 7.5 and 5.73 Ma (Fig. 8).
Messinian depositional sequences are characterized globally by regressive trends, caused by lowering sea level due to global increasing ice volume (Adams et al. Reference Adams, Benson, Kidd, Ryan and Wright1977). A δ18O isotope study with benthic foraminifers of a Late Miocene to Early Pliocene sequence from ODP Site 982 (North Atlantic) revealed a late Messinian glacial period between 6.26 to 5.50 Ma (Hodell et al. Reference Hodell, Curtis, Sierro and Raymo2001). This glacial period consists of eighteen glacial–interglacial cycles, of which TG20 at 5.75 and TG12 at 5.51 Ma are the most intense. The sequence boundary Me2 at 5.73 Ma (Hardenbol et al. Reference Hardenbol, Thierry, Farley, Jacquin, de Graciansky, Vail, de Graciansky, Hardenbol, Jacquin and Vail1998), correlated to the unconformity at the top of the Kasterlee Formation, is thus likely related with glacial event TG20. According to Hodell et al. (Reference Hodell, Curtis, Sierro and Raymo2001), the magnitude of the associated sea-level drop is difficult to determine in open marine settings, but estimates range from ten metres (Aharon et al. Reference Aharon, Goldstein, Wheeler and Jacobson1993) to tens of metres (Braga & Martin, Reference Braga and Martin1996). In summary, the regressive trends and shoaling observed in the Kasterlee Formation (Louwye et al. Reference Louwye, De Schepper, Laga and Vandenberghe2007) can be set against the backdrop of the onset of the late Miocene glaciation. Although the effect of a sea-level drop is first observed in coastal areas, the top of the Kasterlee Formation in the deeper (Oud-Turnhout area) and shallower facies (Dessel and Olen areas) shows no age difference. The Messinian glaciation ended with the transition from TG12 to TG11 just before 5.5 Ma, after which sea levels started to rise again.
The depositional environment of the Poederlee Formation was neritic with an open ocean influence at first, changing into more shallow waters in the proximity of the coast and fresh water influence. Deposition likely took place during a transgressive to highstand phase, under a high and possibly maximal sea level, until the accommodation space was filled. At the edge of the North Sea Basin, accommodation space is limited; hence, from halfway up the Poederlee Sands, fresh water influences are recorded together with increased pollen influx showing the proximity of the continent.
The stratigraphic range of marker dinoflagellate cyst species confine the age of the Poederlee Formation between 3.71 and 2.74–2.72 Ma. Given the stratigraphic range of Impagidinium solidum (3.87–3.15 Ma), the Poederlee Sands could be older than 3.15 Ma. Based on the range of marker species and the overall dinoflagellate cyst assemblage, the Poederlee Formation is correlated with the Oorderen Sands. The Oorderen Sands are placed in the sequence between the Pia1 (3.21 Ma) and Pia2 (2.76 Ma) sequence boundaries (Hardenbol et al. Reference Hardenbol, Thierry, Farley, Jacquin, de Graciansky, Vail, de Graciansky, Hardenbol, Jacquin and Vail1998; De Schepper, Head & Louwye, Reference De Schepper, Head and Louwye2009). Therefore, also the lower boundary of the Poederlee Sands should be correlated to the Pia1 (3.21 Ma). This sequence boundary is likely related to the global glaciation event of Marine Isotope Stage M2 at around 3.30 Ma (e.g. Lisiecki & Raymo, Reference Lisiecki and Raymo2005; De Schepper, Head & Groeneveld, Reference De Schepper, Head and Groeneveld2009). Miller et al. (Reference Miller, Kominz, Browning, Wright, Mountain, Katz, Sugarman, Cramer, Christie-Blick and Pekar2005) and also Dwyer & Chandler (Reference Dwyer and Chandler2009) estimate the sea-level low stand at MIS M2 at approximately 65 m below present. The Pia2 sequence boundary (Fig. 8) corresponds with the sea-level drop of about 75 m around 2.74 Ma (Miller et al. Reference Miller, Kominz, Browning, Wright, Mountain, Katz, Sugarman, Cramer, Christie-Blick and Pekar2005) at the intensification of the Northern Hemisphere glaciation.
The combined evidence from dinoflagellate cysts and sequence stratigraphy suggests that the Poederlee Formation was deposited between 3.21 and 2.76 Ma, but may have even been deposited in the narrow time window between 3.21 and 3.15 Ma. Sediments from the eastern English sector of the southern North Sea Basin often have been deposited in a short amount of time, even decadal timescales (Head, Reference Head1998; Balson, Reference Balson, Daley and Balson1999). Thus, deposition of the Oorderen Sands and Poederlee Formation likely took place during the Mid-Pliocene warm period or PRISM time slab (3.27–2.97 Ma), when sea level was high enough and accommodation space was adequate for sediments to be deposited. Sea level was higher by around 35 ± 18 m (Dowsett & Cronin, Reference Dowsett and Cronin1990), but more recent reconstructions suggest a sea level of 20 to 25 m higher relative to today (Miller et al. Reference Miller, Kominz, Browning, Wright, Mountain, Katz, Sugarman, Cramer, Christie-Blick and Pekar2005; Dowsett, Reference Dowsett, Williams, Haywood, Gregory and Schmidt2007; Dwyer & Chandler, Reference Dwyer and Chandler2009).
The magnitude of the hiatus between the Miocene and Pliocene series in northern Belgium varies considerably from region to region, and no continuous section exits. In the vicinity of the city of Antwerp, the hiatus between the Diest Formation (more specifically the Deurne Sands Member) and the Zanclean Kattendijk Formation can be estimated at a minimum of 3.2 million years (Fig. 8). The hiatus is at least 2.52 million years in the Campine area, where the Kasterlee Formation is covered by the Poederlee Formation. No precise estimation can be given for the areas where Miocene deposits are covered by the continental/estuarine Mol Formation for which no precise age can be proposed (Fig. 8). The major cause of this variation is the shallow depositional environment at the southernmost border of the North Sea Basin, where glacio-eustatic or local tectonically induced sea-level fluctuations determine deposition or non-deposition in marginal marine areas.
Acknowledgements
S. Van Cauwenberghe kindly helped with the palynological preparations. The stimulating discussions on Neogene stratigraphy with P. Laga (Geological Survey of Belgium) and with S. Geets are much appreciated. SDS appreciates funding from the Deutsche Forschungsgemeinschaft (International Graduate College ‘Proxies in Earth History’, EUROPROX, University of Bremen) and MARUM (G. Wefer). The samples of the Oud-Turnhout borehole were kindly made available by the Geological Survey of Belgium, and their co-operation is much appreciated. The constructive reviews by L. Edwards and an anonymous reviewer are much appreciated and improved the manuscript considerably.