Introduction
Low-dimensional carbon nanostructures, such as graphene, nanotubes, and fullerenes, are promising candidates for use as building blocks of new electronic and/or mechanical devices. Their physical and chemical properties are largely dependent on the atomic configurations with interrupted periodicity due to, for example, defects and edge structures. Element selective single-atom imaging was first demonstrated a decade ago for dopant detection in carbon nano-peapods, namely, fullerene molecules encapsulated in carbon nanotubes.Reference Suenaga, Tencé, Mory, Colliex, Kato, Okazaki, Shinohara, Hirahara, Bandow and Iijima1, Reference Hirahara, Suenaga, Bandow, Okazaki, Kato, Shinohara and Iijima2 A fully digitized scanning transmission electron microscope-electron energy-loss spectroscopy (STEM-EELS) systemReference Tencé, Quartuccio and Colliex3 that enabled spectrum imaging was indispensable to achieve statistical data analysis. Due to the high dose of the incident electron beam required for a high signal-to-noise ratio, specimen damage was, however, a severe problem in such a highly sensitive analysis technique. Reducing the accelerating voltage of the TEM/STEM then becomes essential when one aims to image any beam-sensitive objects. A lower accelerating voltage is preferred for the observation of small molecules composed of light elements, because molecular structures are not destroyed by the knock-on effect and, more importantly, the image/EELS contrast is enhanced. In order to compensate for the inferior spatial resolution that accompanies operating at a lower voltage, more sophisticated electron optics are required to reduce residual aberrations.
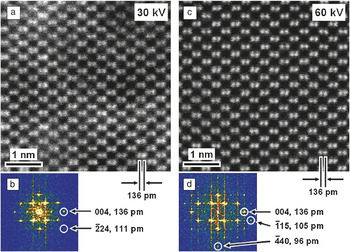
Sawada et al. designed a new type of aberration corrector with triple dodecapole elements (DELTA system) to reduce higher-order aberrations, such as six-fold astigmatism,Reference Sawada, Sasaki, Hosokawa, Yuasa, Terao, Kawazoe, Nakamichi, Kaneyama, Kondo, Kimoto and Suenaga4, Reference Sawada, Sasaki, Hosokawa, Yuasa, Terao, Kawazoe, Nakamichi, Kaneyama, Kondo, Kimoto and Suenaga5 which is very useful for a TEM/STEM operating at low accelerating voltages of approximately 30 to 60 kV. A TEM (JEOL 2100F) equipped with this corrector offers unique capabilities in terms of the spatial resolution normalized by the electron wavelength; this capability was proved by the presence of a Si (224) reflection in a high-angle annular dark-field (HAADF) image of a Si crystal observed along the [110] direction, see Figure 1.Reference Sasaki, Sawada, Hosokawa, Kohno, Tomita, Kaneyama, Kondo, Kimoto, Sato and Suenaga6 This reflection corresponds to 1.11 Å, just 16 times the 0.07 Å wavelength of the 30 kV electrons used to form the image.
(a) Raw high-angle annular dark-field (HAADF) image of Si [110] taken at 30 kV shows 1.36-Å (136 pm) separated Si dumbbells. (b) Its Fourier transform shows a ¯2Q1: Typesetter: Please add a bar over the 2.24 spot, which corresponds to a spacing of 1.11 Å. (c) Raw HAADF image of Si [110] taken at 60 kV clearly shows Si dumbbells. (d) Its Fourier transform contains ¯1Q2: Typesetter: Please add a bar over the 1.15 and ¯44Q3: Typesetter: Please add a bar over the 4.0 spots, corresponding to spacings of 1.05 and 0.96 Å, respectively.Reference Sasaki, Sawada, Hosokawa, Kohno, Tomita, Kaneyama, Kondo, Kimoto, Sato and Suenaga6 Both are the highest spatial resolution achieved for the used electron wavelengths.

One of the major advantages of the low voltage STEM has been demonstrated by the chemical analysis of individual molecules without massive structural destruction.Reference Suenaga, Sato, Liu, Kataura, Okazaki, Kimoto, Sawada, Sasaki, Omoto, Tomita, Kaneyama and Kondo7 Despite this success, higher dose experiments still show non-negligible irradiation damage in metallofullerene molecules, as has been proven by the escape of encaged Er atoms from the peapod even at 60 kV.Reference Krivanek, Dellby, Murfitt, Chisholm, Pennycook, Suenaga and Nicolosi8 The calculated knock-on threshold energies for the various carbon materials suggest that, for the fullerene molecules that have higher curvatures than graphene or nanotubes, an accelerating voltage of 60 kV may not be low enough to completely avoid irradiation damage.Reference Banhart9 An accelerating voltage below ∼35 kV seems preferable for observing the fullerene molecules.
Case studies: Metallofullerenes and graphene
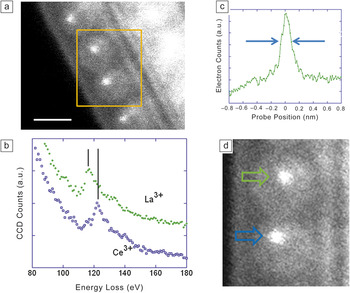
As an illustration of single atom spectroscopy and imaging, two case studies will be discussed: metallofullerenes and graphene. In addition, studies have shown that single atom spectroscopy with little irradiation damage can be realized by further reducing the accelerating voltage down to 30 kV. An electron energy-loss spectrometer dedicated for operation at low voltages (GIF Quantum, modified) was employed for this purpose.Reference Gubbens, Barfels, Trevor, Twesten, Mooney, Thomas, Menon, Kraus, Mao and McGinn10, Reference Suenaga, Iizumi and Okazaki11 A single-walled nanotube (SWNT) containing two or more different metallofullerenes, a so-called mixed peapod, was analyzed using an operating voltage of 30 kV.Reference Suenaga, Iizumi and Okazaki11 C82 molecules were chosen and co-doped with rare-earth elements La, Ce, or Er inside the SWNTs. Such structures are denoted as M@C82, where M = La, Ce, or Er. Annular dark-field imaging and EELS results are shown in Figure 2. An annular dark-field (ADF) image clearly shows the molecular structures encapsulated inside the SWNT (Figure 2a). In the indicated rectangular area, two metallofullerene molecules are involved, and each of the two carries one metal atom, appearing in brighter contrast, inside the caged structure. Although the ADF image does not supply any elemental information of these two atoms, these atoms can be identified by EELS spectra. Figure 2b shows two EELS spectra recorded from two atoms seen in Figure 2d. The EELS spectrum in green corresponds to the atom indicated by the green arrow. The spectrum is a sum of four spectra, each of which had an acquisition time of 0.05 sec. The resulting signal-to-noise ratio is high enough to isolate the La N edge. The atom indicated by the blue arrow is assigned as Ce. Moreover, its peak position (∼122 eV) fits very well to that for Ce3+.Reference Suenaga, Sato, Liu, Kataura, Okazaki, Kimoto, Sawada, Sasaki, Omoto, Tomita, Kaneyama and Kondo7
Detailed analysis of the mixed peapods (La@C82 and Ce@C82) at 30 kV.Reference Suenaga, Iizumi and Okazaki11 (a) An annular dark-field (ADF) image with a rectangle showing where the spectrum image was obtained. Scale bar is 1 nm. (b) Two electron energy-loss spectra recorded from the two metal atoms indicated in (d). The atom indicated by the green arrow is assigned as La, and that indicated by the blue arrow is Ce. The two vertical lines indicate the peak positions of the edges and clearly prove that the La (Z = 57) and Ce (Z = 58) can be discriminated. (c) A profile across the ADF image of the La atom indicated by the green arrow shown in (d). The full width at half maximum is roughly estimated as 0.15 nm, which reflects the probe size and includes any possible atomic movement or vibration. (d) Higher magnification of (a); the image width is 2 nm and height is 2.5 nm. Note: CCD, charge-coupled device.

Though the two edges of La N and Ce N severely overlap, the elements (La: Z = 57 and Ce: Z = 58) comprising the two encaged atoms as well as the oxidation state of the Ce atom (Ce3+) could be identified. Figure 2b shows a profile of ADF counts across the atom indicated by green arrow. The full width at half maximum of the ADF profile of single atoms is approximately 0.15 nm, which should reflect the probe size at 30 kV. A possible atomic movement or vibration during the ADF imaging might be also involved in the profile.
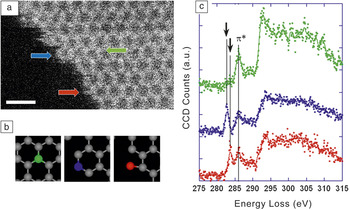
Graphene is regarded as a promising candidate for future electronic devices. The physical properties of graphene in a finite size range (smaller than several nm wide) will be governed by the edge structures, and, therefore, understanding the edge properties is of great importance. So far, the atomic configurations at the graphene edge have been investigated either by TEMReference Girit, Meyer, Erni, Rossell, Kisielowski, Yang, Park, Crommie, Cohen, Louie and Zettl12 or STM,Reference Kobayashi, Fukui, Enoki and Kusakabe13 but the electronic states of the edges have only recently been experimentally studied with atomic resolution. Single atom spectroscopy of carbon, including the fine structure information on the carbon K edge, had never been realized until recently because of the extremely weak signal and the intrinsic problem of specimen damage. A recent study by the author demonstrated the site specific single-atom spectroscopy at the graphene edge by means of an aberration-corrected STEM operated at 60 kV where the peculiar electronic/bonding structures attributed to the graphene edge can be directly investigated.Reference Suenaga and Koshino14 Despite the anticipated delocalization of the energy-loss signal, discrimination of the single-, double-, and triple-coordinated carbon atoms at the graphene edge has been successfully demonstrated with atomic resolution (Figure 3). These results demonstrate how detailed the information obtained from single atoms through the analysis of such a near-edge structure can be, and this capability will open up many possibilities to explore the local electronic structures of nanoscale devices and/or individual molecules.
Atom-by-atom spectroscopy at the graphene edge. (a) Scanning transmission electron microscope annular dark-field image of a graphene edge region. Scale bar = 0.5 nm. (b) Different atomic configurations for each carbon atom painted green (triple coordination), blue (double coordination), and red (single coordination). (c) Electron energy-loss spectra from single carbon atoms with different coordination numbers.Reference Suenaga and Koshino14 The black arrows indicate the different energy levels of the 1s to π* excitations, proving the radical bonding states of edge carbon atoms. Note: CCD, charge-coupled device.

Summary
Here, we have discussed some examples of how spectroscopic imaging based on the scanning transmission electron microscope-electron energy-loss spectroscopy (STEM-EELS) techniques can be applied to explore nanostructured carbon materials. It is clear that not only the elemental information but also the bonding/electronic states are now accessible for single atoms through the near-edge fine structure analysis. Such an analysis was not possible until recently because of two different intrinsic problems, namely, the inevitable irradiation damage due to a large number of electrons required to realize a high enough signal-to-noise ratio for the fine structure analysis from a single atom and the non-negligible EELS signal delocalization that may smear out the spatial resolution. Lowering the accelerating voltage is the only way to overcome these two drawbacks.
Acknowledgments
This work is supported by the JST-CREST program and grant-in-aid from MEXT (19054017). The work has been done with the collaboration of Drs. Masahiro Koshino, Yoshiko Niimi, Toshiya Okazaki, and Yoko Iizumi.