1 Introduction
Over the past 30 years, individuals have had to become increasingly responsible for their own financial security after retirement. Prior to the 1980s, many Americans relied mainly on Social Security and employer-sponsored defined benefit pension plans. Today, by contrast, individuals are increasingly relying on defined contribution (DC) plans and Individual Retirement Accounts to help finance their retirement years. The transition to the DC retirement saving model has the advantage of permitting more worker flexibility and labor mobility than in the past, yet it imposes on workers a greater responsibility to plan, save, invest, and decumulate retirement wealth sensibly. Thus, retirement security will depend more and more on individuals’ saving and planning decisions.
Unfortunately, studies show that few individuals plan for retirement, and fewer develop and follow through on a financial plan for retirement (Lusardi and Mitchell, Reference Lusardi and Mitchell2007a , Reference Lusardi and Mitchell2008, Reference Lusardi and Mitchell2009, Reference Lusardi, Mitchell, Mitchell and Lusardi2011a , Reference Lusardi and Mitchell b ). Financial literacy, and specifically the knowledge of financial concepts that are the basis for retirement-related financial decision-making, is one important predictor of retirement planning, not just in the USA but also worldwide (Lusardi and Mitchell, Reference Lusardi and Mitchell2011c ). In addition to knowledge of interest compounding and inflation, risk diversification has been singled out as a concept that is critically important for retirement planning and for several other financial decisions (Lusardi and Mitchell, Reference Lusardi, Mitchell, Mitchell and Lusardi2011a , Reference Lusardi and Mitchell b , Reference Lusardi and Mitchell c , Reference Lusardi and Mitchell2014; Lusardi and De Bassa Scheserberg, Reference Lusardi and de Bassa Scheresberg2013). Yet studies show that risk literacy worldwide is very low: for instance, an international survey showed that when compared with understanding of other financial concepts, knowledge of risk was by far the lowest (Lusardi, Reference Lusardi2015). Self-efficacy with regard to financial decision-making also plays a role in the likelihood that an individual will follow through with retirement planning (Shockey and Seiling, Reference Shockey and Seiling2004; Gutter et al., Reference Gutter, Copur and Garrison2009). As employers move to give employees more responsibility for their own financial security in retirement, ensuring that workers are well-equipped to make financial decisions becomes increasingly important.
Given the pressing need to improve financial literacy among individuals, financial education programs have become an important topic of research (Bernheim et al., Reference Bernheim, Garrett and Maki2001; Bernheim and Garrett, Reference Bernheim and Garrett2003; Lusardi and Mitchell Reference Lusardi and Mitchell2007b , Reference Lusardi and Mitchell2014; Atkinson, Reference Atkinson2008). Related work has also focused on financial education for young adults (examples include Walstad et al., Reference Walstad, Rebeck and MacDonald2010; Carlin and Robinson, Reference Carlin and Robinson2012a , Reference Carlin and Robinson b ; Bechetti et al., Reference Becchetti, Caiazza and Coviello2013; Brown et al., Reference Brown, Van der Klaauw, Wen and Zafar2013; Lührmann et al. Reference Lührmann, Serra-Garcia and Winter2015). While findings are still mixed, there is emerging evidence that financial education is or can be made effective (Lusardi and Mitchell, Reference Lusardi and Mitchell2014). However, recruiting individuals into educational seminars is a difficult task, and educational programs often require full-time instructors or counselors. This makes seminars costly and hence difficult to scale up. Research also finds that those consumers who need help the most are the least likely to seek out educational programs (Meier and Sprenger, Reference Meier and Sprenger2013).
The recent connectivity of most households to the Web provides an opportunity to develop and bring new educational materials to users quickly and efficiently. Moreover, interventions delivered via the Web could be successful in attracting users due to ease of accessibility and low time-commitment requirements. Various online tools are available today, such as educational material for customers at investment firms such as Fidelity and VanguardFootnote 1 and interactive tools on websites such as Google Finance and the New York Times.Footnote 2 Importantly, few online tools that we know of are theory-based or are empirically validated for their effectiveness. One exception is Heinberg et al. (Reference Heinberg, Hung, Kapteyn, Lusardi, Samek and Yoong2014) who investigated the use of videos to teach individuals about five different financial literacy concepts.Footnote 3 Another is Ambuehl et al. (Reference Ambuehl, Bernheim and Lusardi2014) who also tested the impact of educational videos. Our paper provides a contribution different from Heinberg et al. (Reference Heinberg, Hung, Kapteyn, Lusardi, Samek and Yoong2014) and Ambuehl et al. (Reference Ambuehl, Bernheim and Lusardi2014), in that we have designed an expanded set of online tools and compared these with a new educational video and written narrative.
We focus on the development and evaluation of new web-based educational programs aimed at explaining the concept of risk diversification. Understanding risk diversification is fundamental both to optimally allocating wealth and to retirement planning, yet most individuals do not have a solid grasp of this concept (Lusardi, Reference Lusardi2015). When responding to a battery of questions measuring financial literacy, the majority of individuals fare particularly poorly on questions related to risk and risk diversification (see, e.g., Lusardi and Mitchell, Reference Lusardi and Mitchell2009, Reference Lusardi, Mitchell, Mitchell and Lusardi2011a , Reference Lusardi and Mitchell b , Reference Lusardi and Mitchell c , Reference Lusardi and Mitchell2014; van Rooij et al., Reference Van Rooij, Lusardi and Alessie2011, Reference Van Rooij, Lusardi and Alessie2012; Heinberg et al., Reference Heinberg, Hung, Kapteyn, Lusardi, Samek and Yoong2014; Lusardi et al., Reference Lusardi, Mitchell and Curto2014).
We designed four different educational programs for delivery online: an informational brochure, an interactive visual tool, a written narrative, and a video narrative. Written narratives and informational brochures are methods that have generally been used to educate consumers in practice, while videos and interactive visual tools are more innovative and exploratory. All of these programs are designed to improve knowledge of risk diversification but differ substantially from previous financial education programs that have been evaluated and discussed in academic work for the innovative ways in which they communicate the information.
We evaluate the effectiveness of the educational programs that we developed using a representative sample of individuals age 20+ from the RAND Corporation American Life Panel (ALP).Footnote 4 The ALP is a nationally representative panel of individuals who are regularly interviewed over the Internet. A total of 892 ALP participants were randomized to receive one of the four programs or were assigned to a control group. Immediately after being exposed to the program, participants completed short questionnaires aimed at evaluating their knowledge of basic financial concepts related to risk diversification, confidence in their financial literacy, and self-efficacy. The programs were designed to appeal to young adults, but were evaluated for use by young and older adults.
Our main results are as follows: (1) videos were most effective at improving financial literacy scores and increasing levels of confidence in financial knowledge; (2) the visual tool increased confidence in financial knowledge, but did not appear to have an effect on financial literacy scores; (3) participants who were exposed to a video had significantly higher financial literacy scores than those who were exposed to a written narrative; and (4) all of the treatments were effective at increasing self-efficacy. Overall, our results provide new evidence for the value of online programs as a new way to improve financial literacy.
This paper makes three main contributions to the existing literature on financial literacy and financial education. First, we show that interventions, even short-duration ones, can help improve financial literacy, specifically risk literacy, a finding that speaks to the widespread lack of financial knowledge in the population. Second, engaging programs, such as videos, can be particularly effective in educating individuals about complex concepts such as risk diversification. Third, not just financial literacy but also confidence and self-efficacy surrounding decisions related to risk can be affected by relatively short-duration interventions, a finding that can be particularly important for some demographic groups, such as women. How long these effects persist, and whether the increased confidence and self-efficacy observed in our study can transfer to other financial literacy concepts, remain important open questions for future work.
2 Narratives and visual tools
The narratives and visual tools that we developed are grounded in evidence-based research. For example, in the social sciences, narratives have been established as an effective method for creating cognitive involvement and affecting comprehension and behavior change. In the field of visual analytics, visual tools have been established as a way to shift information processing to the human perceptual system and nudge behavior. However, the use of narratives and visuals (interactive or not) in the financial literacy domain has remained relatively under-explored. We explain each method in turn.
2.1 Narratives
Narratives are an established method of creating cognitive involvement and emotional immersion, changing minds and generating a desire to change course (Bruner, Reference Bruner1987). Narratives are widely adopted in adult education with demonstrated effects on motivation, comprehension, and recall (Davidhizar and Lonser, Reference Davidhizar and Lonser2003; Norris et al., Reference Norris, Guilbert, Smith, Hakimelahi and Phillips2005). Narratives have also been used to improve health literacy and health-related behavior change (Michielutte et al., Reference Michielutte, Bahnson, Dignan and Schroeder1992; Corby et al., Reference Corby, Enguídanos and Kay1996; Petraglia, Reference Petraglia2007) and findings suggest that public perceptions of risk may be shaped more by narratives than by calculations (Mairal, Reference Mairal2008). While still underused in the area of financial literacy, narratives could prove to be a natural extension from the health field and well suited to overcome the mix of disinterest, anxiety, and non-comprehension associated with financial issues. In another paper, we use videos to explain basic financial literacy concepts and show that they affect both knowledge and behavior (Heinberg et al., Reference Heinberg, Hung, Kapteyn, Lusardi, Samek and Yoong2014).
We made use of our team's expertise in financial literacy, marketing, and linguistics to create stories that are powerful both in terms of comprehension and communication.Footnote 5 The narratives that we developed were delivered as either a written story or a video in which actors performed the story. Thus, we were able to evaluate the effectiveness of both the concept and the mode of delivery. In comparing the written and video medium, we respected the stylistic and narrative norms of the genres, giving the reader/viewer the kind of contemporary written anecdote and short (3-minute) online video to which they may be accustomed. The narrative involved people engaged in a familiar activity (packing to move) and discussing a financial issue of personal relevance: what to do with a major monetary gift (see Appendix A for the script). The story was used to describe and explain risk diversification.
2.2 Visual tools
Individuals often struggle with processing information that requires extensive calculations – this type of processing requires a high level of numeracy, which many individuals do not have (Lusardi, Reference Lusardi2012). For instance, recent work has shown that teaching basic financial heuristics may be more effective than standard accounting training at improving financial practices of firms in developing countries (Drexler et al., Reference Drexler, Fischer and Schoar2014). Graphical representations may be another good approach for overcoming processing difficulties because they shift information processing to the perceptual system, improving understanding of the concept presented and allowing decision-makers to quickly learn from trends and patterns in the data (Lurie and Mason, Reference Lurie and Charlotte2007). Related work has found that interactive visual presentations (or visual analytic tools) encourage exploration of the decision space and reduce search effort (Rudolph et al., Reference Rudolph, Savikhin and Ebert2009; Savikhin et al., Reference Savikhin, Lam, Fisher and Ebert2011; Savikhin, Reference Savikhin and Victoria2012).
One of our goals in this project is to compare the effectiveness of information presented in an interactive format with the effectiveness of the same information delivered in a traditional way, for example via a brochure. Consequently, we developed a two-page brochure and an interactive visual tool that displayed the same information about risk diversification in a portfolio setting. Both were aimed at clarifying the relationship between risk and return and explaining how investing in many assets can reduce risk. The visual tool allowed interactivity and therefore supported reasoning about data through ‘what if’ analysis (i.e., analysis based on key visual analytics concepts – see Thomas and Cook, Reference Thomas and Cook2005; Keim et al., Reference Keim, Andrienko, Fekete, Görg, Kohlhammer and Melançon2008). The brochure was made available online; but in practice, the brochure is in a format that could be printed out and handed to participants. However, by posting it online we can directly compare it with the visual tool.
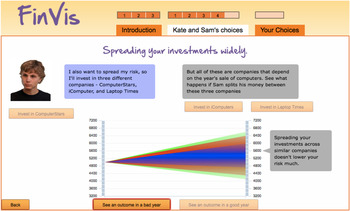
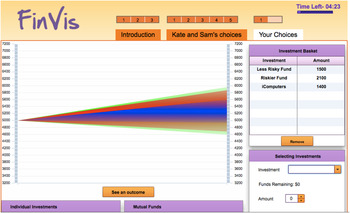
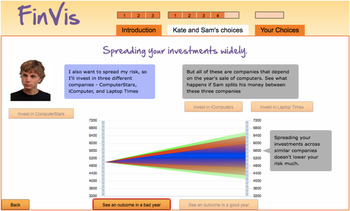
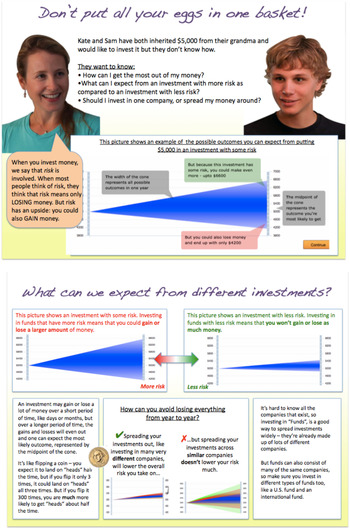
The visual tool that we developed, FinVis (see Figure 1), is a self-contained educational program that assists the user with understanding key concepts about risk and risk diversification and imparts actionable knowledge. This interactive tool has four main components: (1) an introduction that describes the way the tool should be used, (2) a tutorial that introduces risk diversification and demonstrates the concept visually, (3) an interactive feature that allows the user to explore the tool and make his/her own choices, and (4) an outcome screen that displays feedback to the user about whether the choices made were relatively more or less risky and whether the user successfully diversified a hypothetical portfolio (see Appendix B). Both the tool and brochure use the same visual representation, i.e., a cone that shows the range of outcomes, as this was found to be an effective way to communicate risk in prior laboratory studies (Rudolph et al., Reference Rudolph, Savikhin and Ebert2009) and is similar to the representation of risk in a recent, related paper (Kaufmann et al., Reference Kaufmann, Weber and Haisley2013). The visual tool is different from the brochure since it allows the user to explore alternative scenarios. Related work has found that allowing students to experience fictitious life situations and create budgets is an effective way to change behavioral outcomes in the short term (Carlin and Robinson, Reference Carlin and Robinson2012a , Reference Carlin and Robinson b ).
(Colour online) FinVis Tool. One screen from the ‘tutorial’ component of FinVis.

2.3 Confidence and self-efficacy
The programs we developed may also increase levels of confidence and self-efficacy surrounding financial decisions.Footnote 6 According to Bandura's (Reference Bandura1989) social cognitive theory, self-efficacy expectations influence behavior change. Perceived self-efficacy is the belief in one's own ability to perform successfully in a particular situation. For example, an individual's belief that he/she will be able to diversify his/her portfolio is a self-efficacy expectation. Social cognitive theory predicts that perceived self-efficacy helps induce changes in financial behavior. In fact, related work has established a link between educational programs that increase perceived self-efficacy and improved financial decision-making (Shockey and Seiling, Reference Shockey and Seiling2004). In addition, perceived self-efficacy and confidence have been associated with improved decision-making in the health domain (Holden, Reference Holden1991).
Social cognitive theory describes several methods of strengthening self-efficacy. Vicarious experience is one of the most important methods and consists of observing the behavior of others. Presenting narratives or videos that describe behaviors of other individuals should bolster self-efficacy. In fact, previous work has used video-based rather than live modeling to improve self-efficacy (Gist, Reference Gist1989). Additional psychological and social marketing research indicates that narratives of a variety of formats can inspire behavior change. Previous research has found that narratives can be effective in generating behavior change and improving motivation through self-efficacy, especially in the health domain. Moreover, keeping information content constant, presenting narratives in the format of videos rather than written stories may also significantly impact self-efficacy (Heinberg et al., Reference Heinberg, Hung, Kapteyn, Lusardi, Samek and Yoong2014).
According to social cognitive theory, a second method for improving self-efficacy is mastery experience (Bandura, Reference Bandura1989). Mastery experience involves the help of a trained professional who facilitates completion of step-by-step goals. The creation of the FinVis tool was an effort to recreate an environment where the user can engage in the task and meet goals in a short time frame. The tool acts as the ‘expert,’ guiding the user through the process of diversifying a portfolio. While using visual tools to provide mastery experience is relatively new in this domain, we believe it has the potential to increase the effectiveness of the program. Visual analytic tools have been found to increase confidence in financial portfolio selection tasks performed in a laboratory (Savikhin et al., Reference Savikhin, Lam, Fisher and Ebert2011). Our measures allow us to determine whether our interventions affect confidence in knowledge and self-efficacy (where self-efficacy is confidence in one's abilities to diversify a portfolio).
3 Evaluation
To evaluate the impact of the programs on knowledge, confidence, and self-efficacy, we designed a randomized experiment using the ALP. The ALP is a population representative panel composed of approximately 6,000 US households who are regularly interviewed over the Internet (information on ALP sampling is provided in Appendix C). Data routinely collected in the ALP include a wide array of demographic and economic characteristics. The experiment was fielded from June to September 2012.
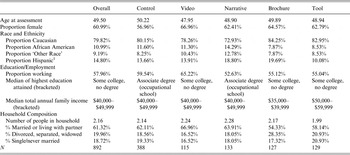
A total of 892 ALP participants were included in the evaluation.Footnote 7 Participants were randomized into one of four treatment groups or into the control group, with at least 100 participants in each treatment cell (see Table 1). Participants randomized into the control group did not receive any treatment. Participants randomized into treatment received one of four educational programs – (i) a video, (ii) a written narrative, (iii) a brochure, and (iv) an interactive visual tool – and then were asked to answer a set of questions, like the control group. The experimental design allows us to compare each treatment group with the control group, providing a rigorous measure of the effectiveness of each program on the basis of knowledge, confidence, and self-efficacy. Moreover, we can compare the value of added interactivity and engagement by comparing the treatment group exposed to the visual tool to the treatment group exposed to the brochure and the treatment group exposed to the video to the treatment group exposed to the written narrative. The first row of Table 1 shows the total number of participants by treatment.
Treatment summary

This table summarizes the total number of participants assigned to each treatment, whether or not they were able to view their assigned intervention.
The questionnaire that we developed consisted of five short, multiple-choice questions, with one question focused on self-efficacy specific to risk diversification (Q1), three questions focused on knowledge of risk diversification (Q2–Q4), and one question focused on confidence in the knowledge of risk diversification (Q5). We chose to use one question each for self-efficacy and self-confidence since we were concerned about respondent fatigue. Related work suggests that single-item scales may be as reliable as multi-item scales, especially for measuring similar constructs such as subjective well-being (Kapteyn et al., Reference Kapteyn, Lee, Tassot, Vonkova and Zamarro2015) and self-esteem (Robins et al., Reference Robins, Hendin and Trzesniewski2001). The precise wording of the questions is as follows:
-
1. If I need to make an investment decision, I can select a mix of investments that are in line with how much risk I want to take on.
-
a. Not at all true
-
b. Hardly true
-
c. Moderately true
-
d. Exactly true
-
-
2. In general, investments that are riskier tend to provide higher returns over time than investments with less risk.
-
a. True
-
b. False
-
c. Don't know
-
-
3. Which of the following is an accurate statement about investment returns?
-
a. Usually, investing $5,000 in shares of a single company is safer than investing $5,000 in a fund which invests in shares of many companies in different industries
-
b. Usually, investing $5,000 in shares of a single company is less safe than investing $5,000 in a fund which invests in shares of many companies in different industries
-
c. Usually, investing $5,000 in shares of a single company is equally as safe as investing $5,000 in a fund which invests in shares of many companies in different industries
-
d. Don't know
-
-
4. Suppose you are a member of a stock investment club. This year, the club has about $200,000 to invest in stocks and the members prefer not to take a lot of risk. Which of the following strategies would you recommend to your fellow members?
-
a. Put all of the money in one stock
-
b. Put all of the money in two stocks
-
c. Put all of the money in a stock index fund that tracks the behavior of 500 large firms in the USA
-
d. Don't know
-
-
5. How confident are you that you have a grasp of how risk changes when choosing a different mix of investments?
-
a. Extremely confident
-
b. Very confident
-
c. Somewhat confident
-
d. Not very confident
-
e. Not at all confident
-
As noted, self-efficacy is the belief in one's ability to perform successfully in a particular situation. Thus, Q1 measured self-efficacy by asking participants to state whether they believe they can select a mix of investments that is in line with the amount of risk they want to take on. Confidence is a similar construct, and Q5 asks participants to state their confidence in understanding how risk changes when choosing a different mix of investments.
Our working assumption is that financial literacy, confidence, and self-efficacy are all relevant for behavior and are important components of financial capability. While financial literacy provides a basic tool for decision-making, confidence and self-efficacy can proxy for the likelihood of taking action based on the (actual or newly acquired) knowledge of the individual.
4 Summary of Results
Table 2 provides a summary of the demographic composition of the sample, including age, gender, race and ethnicity, family income, educational attainment, and number of members in the household. The sample is about 80% Caucasian, 11% African-American, and 15% Hispanic. The average highest educational attainment level of this sample is ‘some college, no degree’ (bracketed) and the average household income is $40,000–$49,999 (bracketed). About 55%–65% of respondents are female. The minimum age of participants is 18, while the average age is 49.5 with a standard deviation of 16.
Demographic background of participants

1 Race does not add to 100% since ethnicity – hispanic or not – is a separate question from race.
We should note that participants needed certain updates to their computers in order to view the video or use the visual tool, and it is possible that some participants chose to skip these programs due to slow download speeds. After we received comments from early respondents about difficulty with accessing materials (because of slow download speeds or not having the correct updates to their computers), we added a question to the survey asking whether the respondent was able to see the tool, video, or brochure. Approximately 81% of those responding to the question were able to view the brochure, 76% were able to view the video, and 65% were able to use the visual tool. Consequently, in the analysis that follows, our measure is one of ‘intent to treat’; it includes everyone who was randomized to treatment, even if they were not able to view the intervention assigned to them.Footnote 8 This means that especially for interventions that were characterized by a low ability to view (like the visual tool), the estimate we provide is a lower bound of the true treatment effect, had the intervention been more easily accessible.
In the analysis of results that follows, Section 4.1 provides results of our financial literacy questions, while 4.2 discusses confidence and self-efficacy.
4.1 Financial literacy
4.1.1 Overall knowledge
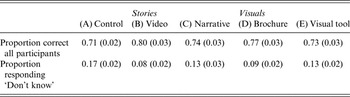
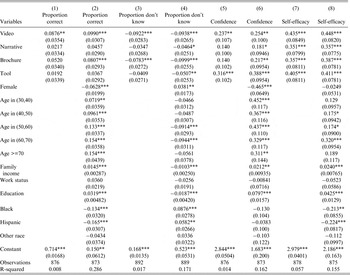
We turn first to the questions measuring knowledge of risk and risk diversification, our questions Q2–Q4. While Q2 and Q3 are knowledge questions, Q4 was designed to test hypothetical decision-making ability. Proportion of correct responses is calculated including all correct, incorrect, or ‘don't know’ responses in the denominator. Overall, the proportion of correct answers across the three questions was 71% among the control group and between 73% and 80% among the treatment groups (see Table 3). To gauge significance of the observed difference, we turn to regression analyses. Columns 1 and 2 of Table 5 present results from ordinary least squares (OLS) regressions in which the dependent variable is the proportion of correct responses to Q2–Q4. The proportion of correct responses is higher by 8–10 percentage points for all participants randomized to the video treatment, and this result is statistically significant (Columns 1–2). In addition, when including demographic controls (Column 2), we also see a positive and significant effect not only for the video but also for the brochure (an increase of 8 percentage points). The narrative has a marginally positive effect on financial literacy, but the result is not statistically significant.
Proportion correct/don't know by treatment (Q2, Q3, and Q4)

Standard errors in parentheses.
Result 1: When controlling for demographic characteristics, exposing individuals to a video or a brochure explaining risk diversification improves their financial literacy relative to the control group.
4.1.2 ‘Don't know’ responses
Each of the questions offered several responses (one of which was correct) that the participant was asked to choose from, including ‘don't know.’Footnote 9 Choosing the ‘don't know’ option may indicate lack of confidence or lack of knowledge. Columns 3–4 of Table 5 present OLS regression results in which the dependent variable is the proportion of ‘don't know’ responses. The proportion of ‘don't know’ responses is almost 10 percentage points lower in the video and brochure treatments relative to the control group, a finding that becomes even stronger when we control for demographic characteristics. The proportion of ‘don't know’ responses is also lower in the visual tool treatment relative to the control group, though this effect is smaller in magnitude and only significant at the 10% level when we control for demographic characteristics.
Result 2: The likelihood of responding ‘don't know’ to financial literacy questions is lower in the video, brochure, and visual tool groups relative to the control group.
The regressions also allow us to compare the video with the written narrative to assess which is the more effective method of improving financial literacy. In the OLS regressions where we control for a set of demographic characteristics, we find a much larger improvement in financial literacy (as measured by the number of correct responses or the number of ‘don't know’ answers) when exposing individuals to a video rather than a written narrative.
Result 3: The video is significantly more effective than the written narrative at improving the proportion of correct answers and reducing the rate of ‘don't know’ responses.
4.2 Confidence and self-efficacy
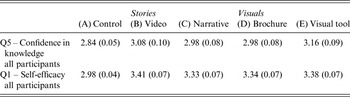
Confidence and self-efficacy are measured using responses to Q5 and Q1, respectively. We code the answers numerically from high to low, so that for Q1 the answers range from 4 (Exactly true) to 1 (Not at all true), while for Q5 the answers range from 5 (Extremely confident) to 1 (Not at all confident). In the control group, the average level of confidence is 2.84 (between not very confident and somewhat confident) while in the treatment groups, confidence varies between 2.98 and 3.16 (between somewhat confident and very confident) (see Table 4). Table 5 (columns 5–6) presents OLS regression results in which the dependent variable is confidence in financial knowledge. The video and brochure significantly improved confidence compared with the control group. When we control for demographic characteristics, we find that all treatments significantly improved confidence compared with the control group.
Confidence and self-efficacy by treatment (Q1 and Q5)

Standard errors in parentheses.
OLS regressions for intent to treat

Standard errors in parentheses, ***p < 0.01, ** p < 0.05, * p < 0.1; comparison age bracket is (20, 30) and comparison race is Caucasian. Dependent variables in columns 1–4 are proportions correct (1–2) or ‘don't know’ (3–4) to Q2–Q4; dependent variables in column 5–6 are answers on a 5-point scale from 5 ‘extremely confident’ to 1 ‘not at all confident’ to Q5; dependent variables in columns 7–8 are answers on a 4-point scale from 4 ‘exactly true’ to 1 ‘not at all true’ to Q1; see Appendix D for the exact wording of the questions. This table uses all participants, whether or not they indicated that they could view the intervention.
Result 4: All treatments significantly improve confidence in financial knowledge relative to the control group.
Turning to self-efficacy, we see from Table 4 that self-efficacy levels in the control group are 2.98 on average (between hardly true and moderately true) while average self-efficacy levels in the treatment groups range between 3.33 to 3.41 (between moderately true and exactly true). While 50% of respondents in the treatment groups respond exactly true to the self-efficacy question, only 26% of the control group do so (not shown in the table). Columns 7–8 of Table 5 present OLS regression results in which the dependent variable is level of self-efficacy, as measured in Q1. All treatments significantly improved self-efficacy compared with the control group.
Result 5: All treatments (video, narrative, visual tool, and brochure) significantly improve self-efficacy levels relative to the control group.
Our results also provide some indication that answers to the financial literacy questions are related to levels of confidence and self-efficacy. Using a Spearman rank correlation test, we find a significant and negative relationship between incidence of ‘don't know’ responses and reported levels of confidence in knowledge (Spearman coefficient −0.46, p-value <0.01) and level of self-efficacy (Spearman coefficient −0.38, p-value <0.01). Likewise, correct responses to the financial literacy questions are significantly and positively correlated with both confidence in knowledge (Spearman coefficient, 0.43, p-value <0.01) and self-efficacy (Spearman coefficient 0.29, p-value <0.01).Footnote 10
We can also look at mismatches between knowledge and levels of confidence and self-efficacy, which could be considered a measure of overconfidence. Finding that a tool makes a user overconfident could be a negative outcome; this could happen if educational materials increase confidence but do not transmit the knowledge they were intended to provide. To assess the correlation between knowledge and confidence, we count the number of participants who do not provide correct responses to the financial literacy questions yet report that they are confident in the subject matter. We classify as ‘overconfident’ a subject who responds very confident or extremely confident in Q5 but actually provides at least one incorrect response in Q2, Q3, or Q4. Out of 413 participants who answered at least one question incorrectly, 57 (13.8%) can be labeled as overconfident using this measure. Overconfidence levels are 11.4% in the control group, 20% in the video group, 9.1% in the written narrative group, 12.3% in the brochure group, and 23.0% in the visual tool group. The visual tool appears to significantly increase overconfidence relative to control when using this measure (Wilcoxon rank-sum p-value <0.05). Wilcoxon rank-sum tests do not indicate significant differences in overconfidence relative to control for the other treatments.Footnote 11
Finally, we observe several effects of demographic characteristics on knowledge that are reflective of general findings in the literature (e.g., Hung et al., Reference Hung, Meijer, Mihaly and Yoong2009; Lusardi and Mitchell, Reference Lusardi and Mitchell2011b , Reference Lusardi and Mitchell2014; Bucher-Koenen et al., Reference Bucher-Koenen, Lusardi, Alessie and van Rooij2012). First, women tend to have a lower number of correct responses, more incidences of ‘don't know’ responses, and lower confidence than men. Second, we tend to see negative effects on correct answers and self-efficacy and positive effects on ‘don't know’ responses for African American and Hispanic respondents relative to Caucasian counterparts. Third, there is a non-linear relationship between age and financial literacy – financial literacy first increases (until about age 55) and then decreases as individuals get older. The proportion of ‘don't know’ responses is U-shaped – first declining and then increasing as individuals get older. These results are in line with related work (Agarwal et al., Reference Agarwal, Driscoll, Gabaix and Laibson2009; Lusardi et al., Reference Lusardi, Mitchell and Curto2010; Yoong, Reference Yoong, Mitchell and Lusardi2011). Fourth, higher household income is associated with more correct responses on financial literacy questions and higher self-efficacy measures. Finally, educational attainment is positively correlated with correct answers, confidence, and self-efficacy and negatively correlated with the proportion of ‘don't know’ responses. These findings confirm results from other studies and can speak to the quality of our data.
5 Discussion and conclusion
We conducted a study on the ALP, an online panel representative of the US population, assigning participants to different types of educational programs (i.e., exposing them to a video, a written narrative, a brochure, and a visual tool) and measuring their effects with a set of questions designed to measure financial literacy, self-efficacy, and confidence in the area of risk diversification. Our video and interactive tools are innovative in that they engage the viewer and provide an easy and enhanced way of communicating information that cannot be achieved by other methods. These were compared with their counterparts – a brochure and written narrative. We find that the video was most effective at increasing financial literacy (by increasing the proportion of correct responses to financial literacy questions and decreasing ‘don't know’ responses) and improving confidence. The video almost always outperformed the written narrative, while there were generally no significant differences between the visual tool and the brochure. All of the programs, including the written narrative, were effective at improving self-efficacy. The increased confidence as a result of most programs is particularly strong and robust for the video treatment, in support of Bandura's (Reference Bandura1989) social cognitive theory.
This paper extends the analysis of Heinberg et al. (Reference Heinberg, Hung, Kapteyn, Lusardi, Samek and Yoong2014) by comparing four formats for providing low-cost financial education on a large scale (Heinberg et al., Reference Heinberg, Hung, Kapteyn, Lusardi, Samek and Yoong2014, only compared two formats, written narrative and video). For policy-makers and practitioners, the differential effectiveness of formats represents an important finding. Format of information may be as relevant as the content of the information, and format should be considered in the design of and prescriptions for future educational material for consumers.
Our results suggest that educational programs that engage the user emotionally or physically and involve vicarious experience (such as watching a video) rather than text-based or passive educational programs (such as reading a narrative) are key for making gains in both financial literacy and confidence in financial knowledge. Static visual representations, such as those found in the brochure, do not seem to fit with the Bandura social cognitive theory methods for increasing self-efficacy. Yet visual representations may provide mastery experience.
More broadly, our work provides insights into the use of narratives in other domains. Narratives have been proposed as a method for health behavior change (Hinyard and Kreuter, Reference Hinyard and Kreuter2007). For example, Houston et al. (Reference Houston, Allison, Sussman, Horn, Holt, Trobaugh, Salas, Pisu, Cuffee, Larkin, Person, Barton, Kiefe and Hullett2011) used a randomized controlled trial to investigate the use of an interactive storytelling intervention to control hypertension. The authors found improvements in blood pressure for patients in the treatment group. However, in a summary of recent primary studies on incorporating personal stories in health interventions, Bekker et al. (Reference Bekker, Winterbottom, Butow, Dillard, Feldman-Stewart, Fowler, Jibaja-Weiss, Shaffer and Volk2013) found insufficient evidence of their effectiveness. The authors suggested that rigorous research is needed to learn what types of stories are most effective at changing behavior.
Due to technological issues, many individuals did not actually use the tool, so our intent to treat measure may capture a lower bound on the actual treatment effect. Additional work may be needed to learn whether more technologically accessible visual tools have better results. More research is needed to develop interactive visual tools that are easy to access. On the other hand, with increasing technological innovation, there will be a greater range of interactive visual tools that can be designed to help educate people on important life skills.
We would like to note that our methods are effective even though they are of short duration and are delivered via the Internet. Thus, these programs can easily be scalable to reach a large number of users. Since take-up is a major problem with existing educational programs, future work should also investigate whether the same selection bias is present in the take-up of online programs, and whether the ability to share content with friends and family online may amplify the positive effects of such programs. Future work should consider further exploring the link between knowledge, confidence, self-efficacy, and actionable behavior in practice. Future work could also investigate the impact of different educational tools on individuals with different learning styles. Finally, how long the effect persists and whether the increased confidence and self-efficacy observed around decisions regarding risk could transfer to increased confidence in other areas of financial decision-making remain important open questions.
Appendix A – Narratives
Videos available online at http://www.youtube.com/watch?v=DO6FPJw_E1Q.
The narrative was designed to explain and encourage risk diversification. In the narrative, two siblings helping their grandparents move debate how to invest the $12,000 gift they have received. Older sister Kate advocates diversifying into different sectors and degrees of risk. She manages to convince younger brother Sam that it is unwise to put all his $12,000 into the company he works for just because the company is doing well. Both Kate and Sam are young people at an early stage in their own earning and saving.
Written story
Sam reflected for a moment. ‘Kate, what are you planning to do with it all? $12,000 each…’
‘I'm going to invest mine,’ said Kate – and she lowered her voice. ‘Grandma told me last night that she wants each of us to have a little ‘nest egg’.’
Sam chuckled. ‘Eggs. That's one of Grandma's favorite words.’ And he imitated his grandmother's voice: ‘Sam, you listen to your grandparents and don't put all your eggs in one basket. We didn't and you and your parents have all been given a good start in life.
‘You may laugh,’ said Kate, ‘but we had a Planning for your Future seminar in my senior year, and they also told us about not putting all our eggs in one basket. I'm going to spread the money around.’
They both began emptying the highest kitchen shelf. Their grandmother had so many plates. What could she possibly have wanted with them all?
‘But Kate,’ said Sam, ‘Why not just put it somewhere you know is safe? Some really really safe stock.’
Kate shook her head: ‘Well, what is really really safe, Sam? Did you know that some really famous firms have ended up going bust? Anyway, if you want to make your money grow over time, they said that you have to take some risk.’
‘But what's one have to do with the other?’ protested Sam.
Video
sam
What are you planning to do with the $12,000 they gave you?
kate
I'm investing mine. Grandma told me last night that she wants each of us to have a little ‘nest egg’.
sam
Eggs. That's one of her favorite words. ‘Sam, you listen to your Grandparents and don't put all your eggs in one basket. We didn't and you and your parents have all been given a good start in life.’ Kate smiles.
kate
Well, I had this Planning for your Future seminar my senior year, and they also told us about not putting all our eggs in one basket. I'm gonna spread the money around.
sam
Why not just put it somewhere you know is safe? Some really, really safe stock.
kate
Well, what is really, really safe? Did you know that some really famous firms have ended up going bust? Anyway, if you want to make your money grow over time, they said that you have to take some risk.
sam
What's one have to do with the other?
Appendix B – Visuals
The interactive visual tool can be accessed at: .
Note: To use the tool, please be sure that you are only playing it on one tab – opening it up in multiple windows may cause audio to overlap. Note that at the time of the intervention, the tool was hosted on RAND's servers. It is now hosted on the personal website of one of the authors hence playback may differ slightly from the original.
First, the visual tool explains risk and return (including the correlation between these two characteristics), and explains the difference between stocks and (stock) funds. Second, the tool provides an interactive explanation of the benefits of diversification, both across stocks and funds. Third, the tool allows the user to choose a set of (hypothetical) stocks and funds that are in line with his/her risk preferences.
Figure 1 is a screenshot of the risk cone. The visual displayed represents the amount of money invested in hypothetical year 1 (the left Y-axis) and the probable values that the portfolio may take on in hypothetical year 2 (the right Y-axis). The risk cone uses a ‘risk gradient that is darker for more likely outcomes and lighter for less likely outcomes. This screenshot features a portfolio with several different assets, and the amount of risk that each asset contributes is highlighted in a different color for each asset. Assets added at the beginning of the decision period appear in the middle of the cone, while assets added later appear on the outside of the cone. An important interactive characteristic of the risk cone is the ability of the user to ‘sample possible outcomes.’ When the user clicks this button, he/she is able to view a possible outcome drawn from the underlying distribution, which appears as a small arrow directly on the risk cone (see Figure B1).
(Colour online) Visualized risk and return in FinVis 2.0.

In the tutorial component of the tool, ‘Kate’ and ‘Sam’ ask questions about risk and return, which are answered when the user clicks on action buttons on the screen that adjust the visual and explain the key concepts. Figure B2 provides a screenshot of one of the tutorial screens. Five screens are used to explain the key concepts, and the user can go back to screens to repeat explanations that were confusing. Each of the tutorial pages utilizes the core visual tool from Figure 1. In the first part of the tutorial, we introduce a more risky and a less risky fund. Kate invests in the more risky fund, while Sam invests in the less risky fund. Second, we introduce the idea that while year-to-year returns may be volatile, returns even out and come closer to the expected return over time. Third, we introduce risk diversification, whereby Kate invests in several different stocks to reduce her risk, while Sam invests in several stocks of the same type, which do not reduce his risk (they were generated with a correlation of 1.0). Finally, Kate and Sam discuss the difference between stocks and funds, and Kate points out the benefit of funds, which already contain many different stocks.
(Colour online) Tutorial component screenshot.

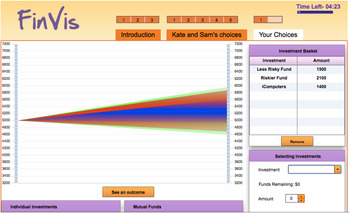
The user then proceeds to the interactive component (see Figure B3). The user is given 5 minutes to allocate five thousand hypothetical dollars to his/her portfolio. The funds and stocks from the tutorial are possible options for the user, and the user can add, modify, and remove the funds and stocks and watch the risk cone update in real time. The tool tracks all user actions, and also records the final choice that the user made.
(Colour online) Interactive component.

‘Mutual Funds’

‘Stocks’

Correlation Matrices

After the user is finished making his/her allocation choices, or after the 5 minutes has run out, the user proceeds to the outcome screen. The outcome screen provides feedback to the user about several key concepts (see Figure B4). First, the user receives feedback about whether he/she invested in all stocks, all funds, or a combination. Users who invested in funds are congratulated on greater diversification. Users who invested only in stocks receive the suggestion that investing in funds can lead to greater diversification. Then users are informed that they took on some risk – and receive feedback in the form of a list of the lowest and highest bound numbers for the risk cone. Because individuals have different risk preferences, the guidance offered is simply to ask the user to reflect on whether this is a suitable risk profile for him/her.
(Colour online) Brochure.

As in Kroll et al. (Reference Kroll, Levy and Rapoport1988), we generated artificial risk and return profiles for each stock and fund, which are summarized in Appendix B.
Appendix C – ALP sampling procedures
ALP respondents have been recruited in one of four ways. Most were recruited from among individuals age 18+ who were respondents to the Monthly Survey of the University of Michigan's Survey Research Center. A subset of respondents (approximately 500) was recruited through a snowball sample; here respondents were given the opportunity to suggest friends or acquaintances who might also want to participate. Respondents without Internet (both in the Michigan sample and the snowball respondents) were provided with so-called WebTVs (http://www.webtv.com/pc/), which allows them to access the Internet using their television and a telephone line. The technology allows respondents who did not have previous Internet access to participate in the panel and furthermore use the WebTVs for browsing the Internet or using email. A new group of respondents (approximately 500) has recently been recruited after participating in the National Survey Project, created at Stanford University with SRBI. This sample was recruited in person, and at the end of their 1-year participation, they were asked whether they were interested in joining the ALP. Most of these respondents were given a laptop and broadband Internet access. Finally, in recent years, recruiting of panel members is based on Address Based Sampling, where once again potential respondents are given a laptop to allow them to participate if they do not have Internet access yet. For more information about the ALP sample recruiting methodology as well as access to the data collected in the ALP to date, the reader is referred to http://mmic.rand.org.
Appendix D – Questionnaire
-
1. If I need to make an investment decision, I can select a mix of investments that are in line with how much risk I want to take on.
-
a. Not at all true
-
b. Hardly true
-
c. Moderately true
-
d. Exactly true
-
-
2. In general, investments that are riskier tend to provide higher returns over time than investments with less risk.
-
a. True
-
b. False
-
c. Don't know
-
-
3. Which of the following is an accurate statement about investment returns?
-
a. Usually, investing $5,000 in shares of a single company is safer than investing $5,000 in a fund which invests in shares of many companies in different industries
-
b. Usually, investing $5,000 in shares of a single company is less safe than investing $5,000 in a fund which invests in shares of many companies in different industries
-
c. Usually, investing $5,000 in shares of a single company is equally as safe as investing $5,000 in a fund which invests in shares of many companies in different industries.
-
d. Don't know
-
-
4. Suppose you are a member of a stock investment club. This year, the club has about $200,000 to invest in stocks and the members prefer not to take a lot of risk. Which of the following strategies would you recommend to your fellow members?
-
a. Put all of the money in one stock
-
b. Put all of the money in two stocks
-
c. Put all of the money in a stock indexed fund that tracks the behavior of 500 large firms in the USA
-
d. Don't know
-
-
5. How confident are you that you have a grasp of how risk changes when choosing a different mix of investments?
-
a. Extremely confident
-
b. Very confident
-
c. Somewhat confident
-
d. Not very confident
-
e. Not at all confident
-