I. INTRODUCTION
Since the significant progress has been achieved on low-cost dye-sensitized solar cells (DSSCs) by Professor Grätzel in 1991,Reference Oregan and Gratzel1 the DSSCs have attracted extensive attention and been regarded as a promising candidate for the next-generation solar cells. The overall solar to current conversion efficiency over 11% has been reached under standard AM1.5 solar illuminationReference Gratzel2 exceeding that of the amorphous silicon solar cells. The most extensively explored type of DSSCs are composed of four main components: (i) a sensitizer attached to (ii) a porous semiconductor film on conducting glass substrate, which forms the photoanode, (iii) a Pt-sputtered conducting glass known as counter electrode, and (iv) an electrolyte solution in between. Basically, TiO2 is the most commonly used semiconductors in DSSCs due to its advantages in terms of its low cost, nontoxicity, and high chemical stability.Reference Fujishima, Inoue and Honda3 Among all kinds of morphology, nanosized TiO2 materials have attracted widespread attention as it provides a high specific surface area for dye absorption, thus efficiently increasing the light harvesting yield compared with the same bulk material. Recently, extensive interest has been drawn in the synthesis of anatase TiO2 nanosheets with exposed {001} facets as the {001} surface of anatase TiO2 is much more reactive than the thermodynamically more stable {101} counterpart indicated by both theoretical and experimental studies, which would be favorable for photovoltaic cells, photodegradation of organic molecules, and photocatalytic water splitting applications.Reference Herman, Dohnalek, Ruzycki and Diebold4, Reference Vittadini, Selloni, Rotzinger and Gratzel5 We recently reported the preparation of microsized anatase single crystals with 47% of exposed highly reactive {001} facets in 2008.Reference Yang, Sun, Qiao, Zou, Liu, Smith, Cheng and Lu6 In a more recent paper, we demonstrated the correlation between the particle morphology and the photoconversion efficiency of the nanosized anatase TiO2 single crystals with different percentages of exposed {001} facets.Reference Wu, Chen, Lu and Wang7 Experimentally confirmed by dark current potential and open-circuit voltage decay scans, such highly exposed {001} facets are not only favorable for more dye adsorption but also effectively retard the charge recombination process in DSSCs,Reference Wu, Chen, Lu and Wang7 which therefore makes the TiO2 single crystals with exposed {001} facets promising candidates for DSSCs application. However, the effect of the film thickness of TiO2nanosheets with exposed {001} facets on the performance of DSSCs is not addressed yet.
In this study, nanosized anatase TiO2 nanosheets with highly exposed {001} facets were prepared and fully characterized for DSSCs application. High-quality TiO2 nanosheets films on fluorine-doped tin oxide (FTO) glass substrates with different thickness (∼5–20 μm) were fabricated by doctor blading. The effect of the film thickness of TiO2 nanosheets films on the photovoltaic performance of DSSCs was investigated by photocurrent–voltage (I-V) characterization and dark current potential scan; the results show that each parameter of DSSCs performance depends strongly on the thickness of the TiO2nanosheets films. The overall conversion efficiency was found to reach a maximum value of 8.39% at the thickness of ∼15 μm.
II. EXPERIMENTAL
Anatase TiO2 nanosheets with exposed {001} facets were prepared by a hydrothermal method.Reference Han, Kuang, Jin, Xie and Zheng8 Typically, 10 mL of Ti(OC4H9)4(Aldrich, St. Louis, MO) and 1.2 mL of hydrofluoric acid solution (with a concentration of 50 wt%) were mixed in a Teflon-lined 35 mL autoclave at room temperature and then kept at 200 °C for 24 h. After hydrothermal reaction, the white precipitates were collected and washed with deionized water and ethanol for several times and then dried in oven at 50 °C overnight. The as-prepared sample was further sintered at 450 °C for 30 min and 500 °C for 30 min to remove fluoride species.
For DSSCs working electrodes fabrication, cis-bis(isothiocyanato)bis(2,2′-bipyridyl-4,4′-dicarboxylato)ruthenium(II), bis-tetrabutylammonium (N719 dye; Dyesol, Queanbeyan, Australia), acetonitrile (HPLC; Labscan, POCH S.A., Poland), and tert-Butanol (LR; Ajax Chemicals, Queensland, Australia) were used for the preparation of the dye solution. The I−/I3− organic solvent-based electrolyte (EL-HSE) and Pt-sputtered counter electrode used in DSSC fabrication were supplied by Dyesol (Queanbeyan, Australia). The fluorine-doped tin oxide FTO glass (2.3 mm thickness, 8Ω/sq, Dyesol Glass) was cleaned with 2-propanol and deionized water successively using an ultrasonic bath for 30 min and then thoroughly rinsed with deionized water. The TiO2 paste was prepared by an improved method depicted in Ref. Reference Ito, Murakami, Comte, Liska, Grätzel, Nazeeruddin and Gratzel9. Typically, 1 g of Degussa P25 was mixed in 20 mL of ethanol with the addition of 0.17 mL of acetic acid and 0.83 mL of deionized water. This mixture was then sonicated using an ultrasonic probe, alternating stirring, and sonication, for three consecutive times before adding 4.056 g of Terpineol and 0.5 g of ethyl cellulose successively. After that, ethanol was removed by rotary evaporator (initial temperature 40 °C and pressure 175 mbar, subsequently reduced to a final pressure of 40 mbar at 40 °C). The resulting slurry was casted on the FTO glass plates by doctor blade methodReference Mills, Elliott, Hill, Fallis, Durrant and Willis10 and kept in a clean box for 30 min so that the paste can relax to reduce the surface irregularity and mechanical stress and then dried at 100 °C for 6 min. This doctor blading procedure (with coating, storing, and drying) was repeated to increase the thickness of the TiO2 working electrode. The TiO2 films were cut into 4 × 4 mm squares and then gradually heated at 325 °C for 5 min, at 375 °C for 5 min, at 450 °C for 15 min, and at 500 °C for 15 min, respectively. When the films had cooled to 80 °C, they were immersed into a 0.5 mM N719 dye solution in a mixture of acetonitrile and tert-Butanol (volume ratio: 1:1) and kept at room temperature for 24 h to complete the sensitizer uptake. Subsequently, the dye-covered TiO2 electrode and Pt counter electrode (Dyesol) were assembled into a sandwich-type cell and sealed with a thermoplastic membrane of 30 μm thickness (Surlyn; DuPont, Sydney, Australia). In the sealed cell, a drop of electrolyte solution was introduced via vacuum backfillling.Reference Ito, Chen, Comte, Nazeeruddin, Liska, Pechy and Gratzel11 Finally, the hole was sealed using an Al-backed thermoplastic membrane (Bynel; DuPont).
I-V curves of the constructed solar cells were measured by using a Keithley 2420 Source Meter (Cleveland, OH) under illumination of simulated sunlight (100 mW/cm2) provided by an Oriel Solar simulator (Adelaide, Australia) with an AM 1.5G type filter (81094; Newport, Adelaide, Australia). The I-V curve is obtained by applying an external bias to the cell and measuring the generated photocurrent under simulated solar illumination, while the dark current potential scan is performed as the same but without illumination.
The measurements were repeated three times for each sample, and the experimental error was within ∼3%.
III. RESULTS AND DISCUSSION
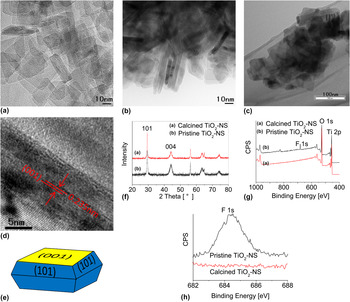
Transmission electron microscopy (TEM) image shown in Figs. 1(a) and 1(b) revealed that the as-prepared TiO2-nanosheets (NS) showed an average size of ∼50 nm and thickness of ∼6 nm. After calcination, the size of the nanosheets maintained the same, while the thickness of the nanosheets increased as a result of the restack of the samples during heat treatment [Fig. 1(c)]. Figure 1(e) demonstrates a typical top-viewed square shape particle indicative of {001} facet, while the HRTEM image [Fig. 1(d)] shows that the lattice spacing parallel to the top and bottom facets is ∼0.235 nm, representing the {001} atomic planes of the anatase TiO2Reference Yang, Sun, Qiao, Zou, Liu, Smith, Cheng and Lu6; the calculated percentage of exposed {001} facets was ∼80%. The corresponding x-ray diffraction (XRD) pattern [Fig. 1(f)] indicates that the as-prepared and calcined TiO2-NS both showed well-resolved diffraction peaks, which are dominated by anatase phase (tetragonal, I41/amd; JCPDS Card No. 21-1272). The relative ratio of (004) peak diffraction intensity to that of the (101) peak of the as-prepared TiO2-NS was estimated to be ∼50%, implying the oriented growth of the TiO2-NS along the (001) axis. The (004)/(101) ratios of the TiO2-NS were decreased to ∼38.6% after calcination, which might be attributed to the increased thickness of the nanosheets due to the fusion of several neighboring nanosheets during the calcination. The Brunauer–Emmett–Teller surface areas of the as-prepared TiO2-NS were determined by the nitrogen sorption isotherms with the value of 89.2 m2/g. The x-ray photoelectron spectroscopy (XPS) was used to investigate the chemical composition and status of the as-prepared TiO2-NS before and after calcination. As indicated in Figs. 1(g) and 1(h), the existence of F 1s peak (684.8 eV) as a typical value of the fluorinated TiO2 system such as ≡Ti–F speciesReference Yang, Sun, Qiao, Zou, Liu, Smith, Cheng and Lu6 can be easily observed in the as-prepared TiO2-NS due to surface fluorination, whereas the F 1s peak disappeared after calcination, suggesting that the F in TiO2is completely removed.
TEM images of (a) top view and (b) side view of TiO2 nanosheets (designated as TiO2-NS); (c) TiO2 nanosheets after calcination; (d) high-resolution TEM image of TiO2-NS; (e) schematic crystallographic structure of TiO2-NS; (f) XRD patterns and (g) XPS survey spectra; and (h) high-resolution XPS spectra of the F 1s region of the pristine TiO2-NS and calcined TiO2-NS.

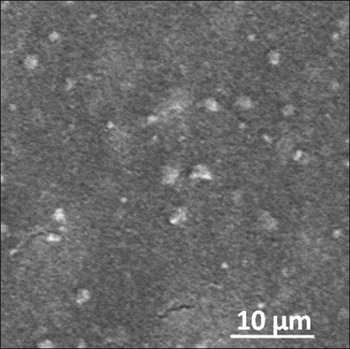
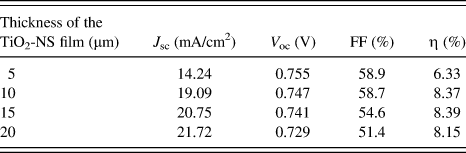
To investigate the effect of the thickness of the TiO2-NS films on the photovoltaic performance of DSSCs, TiO2-NS films with various thicknesses of ∼5, 10, 15, and 20 μm were fabricated by doctor blading and designated as TiO2-NS-5, TiO2-NS-10, TiO2-NS-15, and TiO2-NS-20, respectively. Five cells were fabricated under identical condition for each thickness, and the average values of the DSSCs performance were summarized in Table I. The surface scanning electron microscopy (SEM) image of porous TiO2-NS film with the thickness of ∼10 μm after calcination (Fig. 2) revealed that the film was uniform, smooth, and crack free over the large area with minor aggregates. The TiO2 film also exhibits a nanoporous structure, which consists of interconnected nanoparticles. The other films also exhibit a similar smooth and crack-free morphology as the TiO2-NS-10 film.
SEM image of the surface morphology of porous TiO2-NS film with thickness of ∼10 μm on the FTO glass substrate.

Comparison of photovoltaic properties of the DSSCs fabricated with various thicknesses of TiO2films.
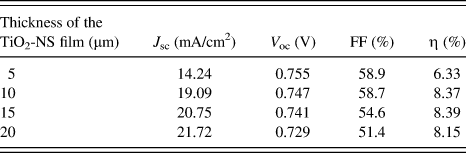
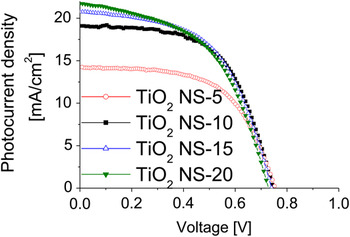
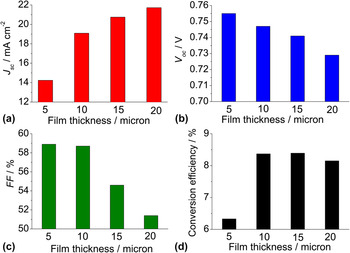
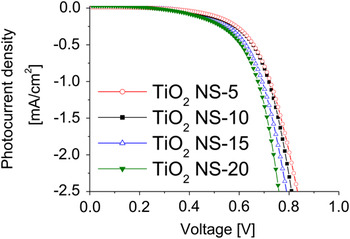
The I-V curves and photovoltaic properties of DSSCs assembled with various thicknesses of TiO2-NS films (∼5–20 μm) were depicted in Fig. 3 and Table I. Photovoltaic characteristics variations of short-circuit photocurrent density (a, J sc), open-circuit voltage (b, V oc), fill factor (c, FF), and conversion efficiency (d, η) with layer thickness of TiO2-NS film were demonstrated in Fig. 4. A clear trend could be observed that both V oc and FF decrease with increasing film thickness, whereas J sc increased with the increase of film thickness, resulting an optimized η of 8.39% with a J sc of 20.75 mA/cm2, a V oc of 0.741 V, and a FF of 54.6% was obtained by the TiO2-NS-15 film with a thickness of ∼15 μm. Since the dye adsorption capacity and the light scattering property of the TiO2-NS films are directly proportional to the film thickness,Reference Wang, Kawauchi, Kashima and Arakawa12 they both play essential roles in determining the performance of DSSCs. Therefore, the enhanced J sc with increasing film thickness could be mainly attributed to the improved dye loading capacity and light scattering properties of the TiO2-NS films with the increased thickness. On the other hand, as a result of the improved dye loading with increasing film thickness, more electrons were generated under illumination, thus the back reaction of photogenerated electrons at the surface of TiO2-NS films with oxidized species such as I3− in the electrolyte increased,Reference Nazeeruddin, Kay, Rodicio, Humphry-Baker, Mueller, Liska, Vlachopoulos and Graetzel13 leading to the decreased V ocand FF with increasing film thickness.
I-V curve of DSSCs assembled with various thicknesses of TiO2-NS films.

Photovoltaic characteristics relationship with layer thickness of TiO2-NS film: (a) J sc, (b) V oc, (c) FF, and (d) conversion efficiency (η).

The dark current potential scans were performed to investigate the back electron transfer process in the TiO2-NS films with various thicknesses (Fig. 5). This technique could be used to qualitatively describe the extent of the back electron transfer as the origination of the dark current arises from the reduction of I3− ion by the electrons on the FTO substrate and therefore lead to electron recombination and the loss of photocurrent.Reference Ito, Liska, Comte, Charvet, Pechy, Bach, Schmidt-Mende, Zakeeruddin, Kay, Nazeeruddin and Gratzel14 It could be observed that the dark current onset of the TiO2-NS films shifted to a lower potential and produced a higher dark current at the same potential above 0.6 V with increasing film thickness, reflecting a higher recombination rate between transferred electrons and I3− ions with the increase of film thickness, which is in good agreement with the decreased V ocand FF with increasing film thickness obtained in I-V characterization.
Dark current potential scans of DSSCs assembled with various thicknesses of TiO2-NS films.

Therefore, the J sc, V oc, and FF of the DSSCs showed different manners with the increase of the film thickness. The increased J sc with increasing film thickness is mainly due to the improved dye loading capacity and light scattering properties of the TiO2-NS films with the increased thickness. Meanwhile, the increased back reaction rate of photogenerated electrons with oxidized species from the electrolyte at the surface of TiO2-NS films leads to decreased V oc and FF with increasing film thickness, which was also confirmed by dark current potential scan. Thus, an optimized η of 8.39% can be obtained by the TiO2-NS-15 film with a thickness of ∼15 μm. Note that we only used one type of faceted TiO2-NS samples in this study, thus the influence of TiO2facets on the efficiency should be negligible.
IV. CONCLUSIONS
In summary, nanosized anatase TiO2 nanosheets with highly exposed {001} facets (∼80%) were synthesized via hydrothermal reaction with the addition of hydrofluoric acid. High-quality crack-free TiO2 nanosheets films were fabricated using doctor blading with various thicknesses (from ∼5 to 20 μm), and the effect of film thickness on the performance of DSSCs was investigated by I-V characterization and dark current potential scan. A clear trend of increased J sc and decreased V oc and FF was observed with increasing film thickness, resulting peak efficiency of 8.39% at ∼15 μm thickness for TiO2nanosheets films.