

Introduction
Frailty puts individuals at increased risk for poor health outcomes including progression of disease, falls, disability, and premature death. (Fried et al., Reference Fried, Tangen, Walston, Newman, Hirsch and Gottdiener2001) Although there is no consensus about the definition of frailty, there is a general consensus among geriatricians that frailty is a state of decline in physiologic reserve capacity and resiliency due to impairment in multiple physiological systems, thereby causing vulnerability to death and adverse health outcomes (Bergman et al., Reference Bergman, Ferrucci, Guralnik, Hogan, Hummel and Karunananthan2007; Ferrucci et al., Reference Ferrucci, Penninx, Leveille, Corti, Pahor and Wallace2000; Fried et al., Reference Fried, Tangen, Walston, Newman, Hirsch and Gottdiener2001). Multiple definitions of frailty have been developed and tested (Bergman et al., Reference Bergman, Ferrucci, Guralnik, Hogan, Hummel and Karunananthan2007; Gobbens, Luijkx, Wijnen-Sponselee, & Schols, Reference Gobbens, Luijkx, Wijnen-Sponselee and Schols2010; Hogan, MacKnight, Bergman, Steering Committee, & Canadian Initiative on Frailty and Aging, 2003; Markle-Reid & Browne, Reference Markle-Reid and Browne2003; Rockwood, Reference Rockwood2005; Verbrugge, Reference Puts, Lips, Ribbe and Deeg2005), with the frailty phenotype developed by Fried et al. (Reference Fried, Tangen, Walston, Newman, Hirsch and Gottdiener2001) being the most often used. Markers of frailty that have been studied include the following: having (a) multiple co-morbidities, (b) poor nutrition, (c) weight loss or sarcopenia, (d) poor endurance, (e) low activity level, (f) slowness, (g) weakness or decreased muscle strength, (h) poor cognition, (i) decreased mobility or poor mood, (j) polypharmacy, (k) decreased vision, (l) poor hearing, and (m) feelings of loss of control (Fried et al., Reference Fried, Tangen, Walston, Newman, Hirsch and Gottdiener2001; Marcantonio et al., Reference Marcantonio, McKean, Goldfinger, Kleefield, Yurkofsky and Brennan1999; Sager et al., Reference Sager, Franke, Inouye, Landefeld, Morgan and Rudberg1996; Shelton, Sager, & Schraeder, Reference Shelton, Sager and Schraeder2000).
Frailty increases with age (Mitnitski et al., Reference Mitnitski, Skoog, Song, Waern, Ostling and Sundh2006), although frailty and aging are not synonymous (Bergman et al., Reference Bergman, Ferrucci, Guralnik, Hogan, Hummel and Karunananthan2007; Fried et al., Reference Fried, Tangen, Walston, Newman, Hirsch and Gottdiener2001). Elderly individuals use a disproportionately greater amount of emergency department (ED) services (Aminzadeh & Dalziel, Reference Aminzadeh and Dalziel2002; Strange, Chen, & Sanders, Reference Strange, Chen and Sanders1992) and often require a greater number of tests and investigations than their younger counterparts (Lowenstein, Crescenzi, Kern, & Steel, Reference Lowenstein, Crescenzi, Kern and Steel1986; Singal et al., Reference Singal, Hedges, Rousseau, Sanders, Berstein and McNamara1992). They also tend to have longer hospital stays (Lowenstein et al., Reference Lowenstein, Crescenzi, Kern and Steel1986). One half to two thirds of older adults will be discharged home from the ED and of these (Aminzadeh & Dalziel, Reference Aminzadeh and Dalziel2002), between 24–29 per cent will return to hospital within 90 days of being seen in the ED (Aminzadeh & Dalziel, Reference Aminzadeh and Dalziel2002; McCusker, Healey, Bellavance, & Connolly, Reference McCusker, Healey, Bellavance and Connolly1997).
Brief screening tools have been developed to predict repeat ED visits and hospitalizations in older patients (Meldon et al., Reference Meldon, Mion, Palmer, Drew, Connor and Lewicki2003; McCusker, Cardin, Bellavance, & Belzile, Reference McCusker, Cardin, Bellavance and Belzile2000). These screening tools, while incorporating some frailty markers, do not specifically look at different frailty domains. Although some frailty markers have been studied independently, in this study we use the combination of the frailty markers as suggested by the Canadian Initiative on Frailty and Aging (Bergman, Hogan, & Karunananthan, Reference Bergman, Hogan and Karunananthan2008). The relationships between frailty and long-term outcomes such as nursing home admission, mobility disability, and mortality have been often studied in community-dwelling older adults, but the relationships between frailty and more acute health outcomes, such as emergency room admission or hospitalization, have less often been studied. Frailty has been shown to be distinct from chronic diseases and disability (Fried, Ferrucci, Darer, Williamson, & Anderson, Reference Fried, Ferrucci, Darer, Williamson and Anderson2004; Puts, Lips, & Deeg, Reference Puts, Lips, Ribbe and Deeg2005a, 2005b). Because the concept of frailty was developed with the aim of identifying older adults at risk for adverse outcomes, it is advantageous to examine frailty, which may aid in developing community programs that optimize seniors’ well-being and thereby decrease their use of these services.
The purpose of this study was to investigate the relationship between frailty markers and ED utilization in a community-dwelling sample of vulnerable seniors in a Canadian population.
Materials and Methods
Study Population
This study used data collected in the context of the Service Intégrés pour les Personnes Âgées en Perte d’Autonomie (SIPA) study. That study, detailed elsewhere (Beland et al., Reference Beland, Bergman, Lebel, Clarfield, Tousignant and Contandriopoulos2006), was a randomized control trial which examined whether a model of integrated community health services was cost-effective in reducing nursing home admissions, decreasing the number of patients waiting for nursing home placement from an acute-care hospital, and decreasing average elective and emergency hospital stays in a target population of elderly persons with functional disabilities in Montreal, Canada (Beland et al.). We collected our study data through a baseline questionnaire and participants’ social, medical, hospital, and provincial health records. Participants were followed for 22 months. We obtained informed consent for collection and use of information during the clinical trial from the subjects or their caregivers, and this secondary data analysis was approved by the Research Ethics board at the Sir Mortimer B. Davis Jewish General Hospital.
Briefly, 1,230 subjects aged 65 and over were recruited from the community in Montreal, Quebec, Canada, during an eight-month period in 1999. Inclusion required that participants have a Functional Autonomy Measurement (SMAF) score (Desrosiers, Bravo, Hebert, & Dubuc, Reference Desrosiers, Bravo, Hebert and Dubuc1995; Hebert, Carrier, & Bilodeau, Reference Hebert, Carrier and Bilodeau1988) of –10 or less, indicating a disability in activities of daily living (ADL), instrumental ADL (IADL), cognition, or communication. In this study, we used data from both the control and the intervention groups. Of the 1,230 participants that met the inclusion criteria, 1,164 had valid baseline questionnaires.
As we were interested in seeing if frailty predicted ED visits independent of disability, all patients with ADL disability at baseline were excluded (n = 439). Disability at baseline was measured using the Katz Index of Independence in ADL items (Katz, Downs, Cash, & Grotz, Reference Katz, Downs, Cash and Grotz1970) which included bathing, dressing, toileting, transferring, and feeding (i.e., activities in which the patient needed help or was unable to do). In this study, we asked two separate questions with respect to the patient’s ability to dress: one for the upper body and one for the lower body. We did not include the incontinence item. Participants who answered that they needed help or were unable to do on any of the six tasks were scored as ADL disabled. Another 53 were excluded owing to missing information on one or more of the frailty markers. Additionally, nine were excluded owing to missing information on chronic diseases, and another 44 were excluded owing to missing information on marital status and education. Altogether, the exclusions left a sample of 565 participants which included participants in both the intervention and control groups of the SIPA database.
We conducted a non-response analysis (using t-tests and chi-square tests) to compare those who were included in the sample versus those who were excluded. We wanted to test whether, besides the obvious presence of ADL disabilities, there were other important differences in the sample and the patients who were excluded. Those who were excluded were slightly older (82.3 vs. 81.7 years), more often men (32% vs. 26%), had lower levels of education, and were more often married (p < 0.05). However, there was no difference in the number of chronic diseases.
Outcome Variable
The number and dates of emergency room visits were obtained from eight local administrative ED databases created with data from those hospitals accounting for 85 per cent of all hospitalizations in Montreal. The total number of ED visits during the study period was recorded and dichotomized as an ED visit (yes/no).
Frailty Markers
Frailty markers were developed to reflect five frailty domains – physical activity, mobility, energy, strength, and cognition – using the most appropriate measures available in the SIPA baseline interview. These domains were chosen on the basis of frailty criteria generated by the Canadian Initiative on Frailty and Aging (Hogan et al., Reference Hogan, MacKnight and Bergman2003) and the Interventions on Frailty Working Group (Ferrucci et al., Reference Ferrucci, Guralnik, Studenski, Fried, Cutler and Walston2004). For purposes of simplicity, all variables were dichotomized as low/poor or normal, corresponding with being frail or not frail, respectively. Physical activity was assessed by the following three questions: “How many times a month do you go to a shopping centre (or mall) or to other places in your neighbourhood to shop or walk around?”, “How many times a month do you go to a recreation or cultural centre?”, and “How many times a month do you go to a church, synagogue, or other place of worship?”
Physical activity was considered low if there was a combined attendance of ≤ four times/month in these activities. Mobility was assessed using the question: “How much difficulty do you have walking up or down a flight of stairs?” Mobility was considered poor if the subject answered that they had “a lot” of difficulty or were “unable” to complete the task. Energy was assessed using the question: “How much difficulty do you have walking one mile?” and “Can you walk one city block (150 feet or 50 meters) during summer?” Energy was considered low if participants answered having “a lot” of difficulty or were “unable” to walk the specified distance. Strength was assessed using the question: “Do you have difficulty lifting something that weighs over 5 kilograms (10 lbs.)?” Strength was considered poor if participants answered “a lot” or “unable” to these questions. Cognition was assessed using the Short Portable Mental Status Questionnaire (SPMSQ) (Pfeiffer, Reference Pfeiffer1975) and whether patients self-reported having memory problems or Alzheimer’s disease. Cognition was considered impaired if participants obtained ≥ three errors on the SPMSQ or answered positively to having memory problems or had a history of Alzheimer’s disease.
Socio-demographic variables included age, sex, marital status, and education. Potential confounders included the number of co-morbidities. Co-morbidity was assessed using questions taken from the Established Populations for Epidemiologic Studies of the Elderly (EPESE) study (Cornoni-Huntley et al., Reference Cornoni-Huntley, Ostfeld, Taylor, Wallace, Blazer and Berkman1993). This self-report measure includes eight items asking participants if they have (yes/no) each of the following conditions: high blood pressure, heart problems, circulation problems, stroke, diabetes, respiratory problems, joint/bone pain, and tumor/cancer.
Statistical Methods
We performed statistical analysis with SPSS version 15.0 (SPSS Inc., Chicago, Illinois). We compared those participants who had been admitted to the ED to those who were not admitted by means of student’s t-tests and chi-square tests. Subsequently, we applied univariate logistic regression using the outcome “no ED visits” versus “one or more ED visits” to assess the association between the frailty markers and ED visits.
We applied multivariable logistic regression using the outcome no ED visits versus one or more ED visits. In doing so, we used all five markers in one model and adjusted for age, sex, marital status, education, number of co-morbidities, and whether the subjects were entered into the control versus experimental arm of the SIPA trial. With a final model, we investigated the association between the sum of the frailty markers and ED visits.
We conducted sensitivity analyses using multinomial logistic regression. In these analyses, we categorized the outcome of the number of ED visits into groups with 0, 1, or 2 or more ED visits as the outcomes. The group that had no ED visits was used as the reference group.
A second set of sensitivity analyses was conducted in which we imputed missing data using Multiple Imputation (MI) techniques (Rubin, Reference Rubin1987). MI was performed using the Imputation and Variance Estimation Software (IVEWARE) (Raghunathan, Lepkowski, Van Hoewyk, & Solenberger, Reference Raghunathan, Lepkowski, Van Hoewyk and Solenberger2001). Subsequently, we re-ran the analysis just described using the imputed datasets.
Results
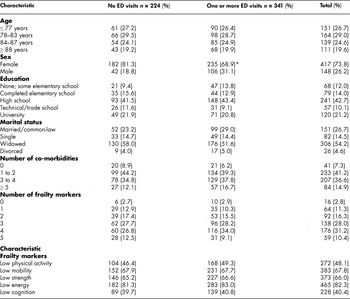
Table 1 presents the characteristics of the study sample. The mean age of the participants was 81.7 years (range: 64–99 years). Women accounted for 73.8 per cent of the sample. Ninety-three per cent of those studied had at least one co-morbidity. Seventy per cent of the participants had at least three frailty markers, with low energy being the most common (82.3%). At the bivariate level, the only significant difference between those participants who had one or more ED visits and those who had no visits was that the former were more often female (p < .001).
Descriptive characteristics

ED = emergency department
* p < .05
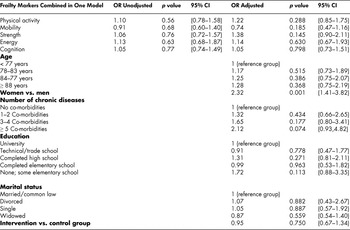
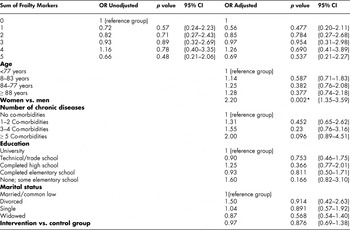
Bivariate analyses using the frailty markers individually showed that none of the five frailty markers was associated with ED visits (see Table 2). Similarly, when we performed multivariable logistic regression entering all five frailty markers at the same time in one model, we found none of the frailty markers to be associated with ED visits (see Table 3), nor did we find the sum of the frailty markers a significant predictor (see Table 4). In fact, the only significant factor in the model was sex. Women had an odds ratio (OR) of 2.2 of having one or more ER visits compared to men (95% confidence interval [CI], 1.35–3.59). Sensitivity analyses showed similar results (results not shown).
Logistic regression analysis using frailty markers separately (n = 565)

Adjusted for age, sex, education, marital status, intervention vs. control, and number of co-morbidities, (CI = confidence interval; OR = odds ratio)
Logistic regression analysis using the single frailty markers combined in one model (n = 565)

CI = confidence interval
OR = odds ratio
Multivariable logistic regression analysis (n = 565) using the sum of frailty markers

CI = confidence interval
OR = odds ratio
* statistically significant
Discussion
In this study of community-dwelling elders, we found no association between any of the five frailty domains identified by the Canadian Initiative on Frailty and Aging (including poor physical activity, mobility, energy, cognition, and strength) and ED visits at the bivariate level. Thus, it was not unexpected that multivariable regression modeling using all frailty markers together or the sum of all frailty markers also failed to show any statistical significance. There was also no association found using multinomial logistic regression to examine the number of frailty markers and the number of ED visits.
The finding that there is no association between any of the frailty markers and ED visits is not unexpected and is similar to previous reported studies (Hastings, Purser, Johnson, Sloane, & Whitson, Reference Hastings, Purser, Johnson, Sloane and Whitson2008). Our study population consisted of community-dwelling individuals with high need characteristics. At baseline, due to the inclusion criteria of the randomized control trial, individuals in the SIPA cohort had IADL disabilities and either ADL, community, or mental functioning impairment. Seventy per cent of the study participants had at least three frailty markers indicating an underlying impairment in multiple functional domains which leads to decreased ability to cope during times of acute stressors, including illness. Even when individuals with baseline ADL disability were removed or when baseline ADL disability was used as a confounder, there was no difference in the presence of ED visits. This lack of difference highlights the fact that frailty is not synonymous with disability, a concept previously shown by others (Bergman et al., Reference Bergman, Ferrucci, Guralnik, Hogan, Hummel and Karunananthan2007; Fried et al., Reference Fried, Ferrucci, Darer, Williamson and Anderson2004).
While baseline frailty markers are an indication of a chronic disease process, ED visits are usually the result of an acute process, and this might explain why frailty was not associated with ED visits as frailty markers are not developed to capture an acute illness process but are instead intended to capture decline in functioning over time. Puts et al. showed that frailty is associated with nursing home admissions (Puts, Lips, Ribbe, & Deeg, Reference Puts, Lips, Ribbe and Deeg2005), highlighting long-term care needs while McCusker showed that acute functional decline prior to an ED visit predicts hospital admission during the subsequent six months after the visit (McCusker, Bellavance, Cardin, Belzile, & Verdon, Reference McCusker, Bellavance, Cardin, Belzile and Verdon2000).
This study was designed to look directly at the combination of frailty domains (low physical activity, cognition, strength, mobility, and energy) to determine their predictive utility with respect to the outcome of ED visits. We chose these domains on the basis of the frailty framework from the Canadian Initiative on Frailty and Aging which suggests the use of seven frailty markers; strength, mobility, physical activity, nutrition, cognition, energy, and mood (Bergman et al., Reference Bergman, Beland, Karunananthan, Hummel, Hogan and Wolfson2004, Reference Bergman, Ferrucci, Guralnik, Hogan, Hummel and Karunananthan2007). In the SIPA database, nutrition and mood were not available, and therefore we used only five frailty markers. A study done by Sourial et al. showed that these frailty markers, possibly with the exception of cognition, measure one underlying concept of frailty (Sourial et al., Reference Sourial, Wolfson, Bergman, Zhu, Karunananthan and Quail2010). In the framework from the Canadian Initiative on Frailty and Aging, disability is seen as a consequence of frailty, and therefore we excluded the participants with disability at baseline. Furthermore, in this framework, social vulnerability was not suggested as one of the frailty markers and thus was not included in this study.
A limitation of this study is that this was a secondary analysis of a prospective cohort study, the main objective of which was to study whether the effect of a multidisciplinary community approach was cost-effective in reducing nursing home and hospital admissions. Therefore, our study was not specifically aimed to examine frailty. The frailty domains that we investigated were based on what was available in the database and not from a previously validated tool. The questions used to determine impairment in the frailty domain were not specifically designed to answer the question and may not have been the most accurate method for measuring impairment. The majority of the questions we asked were answered subjectively, thus opening up the possibilities of self-reporting and recall bias. Recall bias by cognitively impaired individuals may also have impacted the appropriate selection of frail individuals. Although there are frailty definitions that use more items, such as the Frailty Index which uses 70 items to measure frailty (Song, Mitnitski, & Rockwood, Reference Song, Mitnitski and Rockwood2010), we used five markers which may not have been large enough to capture a distinctly frail population. While we used imputation techniques to deal with missing data, a sampling bias may have occurred if there were systematic reasons for the missing information.
Another limitation of our study is that we used a dichotomous (yes/no) method to assess the presence of frailty markers, thus decreasing the sensitivity of our measures. Lastly, the data with regard to ED visits were obtained from hospital records that made up 85 per cent of all Montreal hospitalizations. It is possible that some ED visits may have been missed. However, this most likely would have led to an underestimation of our results, as our population had a high ED use. Nevertheless, since this is a secondary analysis, caution should be used in determining a relationship between the frailty markers and its impact on ED visits.
Conclusion
Despite some limitations, this study is one of the first to examine the ability of frailty to predict acute adverse outcomes. The findings reveal that in a severely functionally disabled, community-dwelling elderly population, the presence of impairment in five frailty domains (physical activity, strength, cognition, energy, and mobility) does not appear to predict ED visits.