


Today, technological innovations enable individuals to learn about politics from countless sources. With the growth of online news and the spread of information on social media, individuals arguably have access to more information now than ever before. Yet, Americans still seem relatively unwilling to access the news. Only four percent of Internet users read at least ten news stories and two opinion pieces over three months (Flaxman, Goel, and Rao Reference Flaxman, Goel and Rao2016). Where, then, are Americans getting their news? Even with the proliferation of news options, 41.7 percent of Americans report getting information from talking with friends and colleagues daily.Footnote 1 Some of these social information exchanges might be occurring online, given that two-thirds of American adults get news from social media (Gottfried and Shearer Reference Gottfried and Shearer2016). This tendency to rely on others for information characterizes the “two-step flow” of information, which suggests that information flows from the media, to the interested individuals known as opinion leaders and to others (Katz Reference Katz1957; Katz and Lazarsfeld Reference Katz and Lazarsfeld1955). The idea is that because many Americans are not particularly interested in or knowledgeable about politics (Delli Carpini and Keeter Reference Delli Carpini and Keeter1996), they find it easier to ask others for information about politics instead of spending time looking it up on their own. Indeed, classic theories in political science suggest that relying on others who are more knowledgeable about politics and have similar preferences can be a rational information shortcut (Downs Reference Downs1957; Lupia and McCubbins Reference Lupia and McCubbins1998). But, just as information can vary from one media outlet to the next, socially communicated information might differ drastically from information communicated by the media.
Recent efforts to understand social information transmission present a relatively grim view of the self-educating potential of the American public. Using a series of controlled lab experiments, Ahn, Huckfeldt, and Ryan (Reference Ahn, Huckfeldt and Ryan2014) show that when incentivized to maximize the number of votes their preferred candidate receives, individuals often send biased information in favor of their preferences to other participants, hindering correct voting decisions. Carlson (Reference Carlson2018) also demonstrates that a substantial amount of information is lost and distorted in the social transmission stage of the two-step flow, showing that those who get information from others are exposed to less—and less precise—information than those who get information directly from a media source. Between filtering out which information is worth passing on to another person, explaining that information through the lens of one’s own experiences, preferences, and (mis)understanding, and introducing new information that may or may not be accurate, socially generated political information is likely to change as it flows from the media, to opinion leaders and to others. However, little research to date has characterized how socially transmitted information differs from information communicated by the media. More importantly, we know even less about the consequences of socially transmitted information for political behavior, relative to information communicated by the media.
How exactly is socially supplied information different from information supplied by the media? What are the consequences of relying on socially supplied information instead of information from the media? I first quantify the ways in which socially generated information differs from information generated by the news media. I use a telephone game experiment (Aarøe and Petersen Reference Aarøe and Petersen2018; Carlson Reference Carlson2018) to examine how information about US economic performance changes as it flows from the Bureau of Economic Analysis to the media to other people. The results demonstrate that socially supplied messages contain less information that is less similar to the original report than news articles. Moreover, individuals transmitted information that was biased in favor of their partisan preferences. Thus, building on Druckman, Levendusky, and McLain (Reference Druckman, Levendusky and McLain2018), I show that even information from initially objective, as opposed to partisan, news sources can become biased through social transmission, even when individuals are not incentivized to misrepresent the information, as in some of the Ahn, Huckfeldt, and Ryan (Reference Ahn, Huckfeldt and Ryan2014) experiments. This is particularly concerning because it suggests that voters could be exposed to even more distorted information than we previously realized.
Next, I examine the consequences of exposure to socially generated political information with an experiment conducted on a nationally representative sample of US adults. Participants were randomly assigned to receive information about US economic performance written by a news outlet or generated by another person in the telephone game experiment. I examine learning and attitude change about the state of the economy and the president. I find that participants who received information from another person learned significantly less than those who received information from the media. However, those who received information from an “ideal informant,” someone who was relatively more knowledgeable and shared their partisanship, learned the same amount as those who received information from the media, even though the social message was substantially shorter than the news article. Thus, consistent with previous research (e.g., Lupia and McCubbins Reference Lupia and McCubbins1998), turning to others for information might not be problematic as long as individuals receive information from these ideal informants.
However, while individuals learned the same amount of objective information from ideal informants and the media, they used that information differently to form subjective evaluations. Those who learned from the media thought the economy was getting worse, whereas those who learned from an ideal informant did not update their beliefs about the economy at all. Socially generated information affected participants’ subjective evaluations of the president, even if it did not affect evaluations of the economy. Those who received information from a Republican or an Independent held significantly more positive evaluations of President Trump than those who received information from a Democrat or the media. That individuals updated their economic and presidential evaluations in response to new information differently conditional on the information source suggests that studies of Bayesian reasoning (Coppock Reference Coppock2016; Kim Reference Kim2017) should carefully consider the impact of the information source.
Together, these results suggest that ideal informants can help facilitate how much individuals know about the news in the absence of information from the media, but this comes at the cost of exposure to biased information that can lead individuals to update their preferences. This illuminates some of the limitations of the classic theories of social informational shortcuts that focused on the dyadic informant-recipient dynamics [e.g., Lupia and McCubbins Reference Lupia and McCubbins1998; Ahn, Huckfeldt, and Ryan (Reference Ahn, Huckfeldt and Ryan2014)], abstracting away from the content of the message itself. By evaluating characteristics of the informant, recipient, and message, this paper more fully analyzes the properties of communication (e.g., Hovland Reference Hovland1948) that impact political learning and attitudes.
WHY SOCIALLY SUPPLIED INFORMATION LOOKS DIFFERENT AND WHY IT MATTERS
Obtaining information from other people might allow individuals to efficiently learn about politics, but the content of socially generated information is likely to be different from information generated by the media. Information from the media is largely communicated by journalists who adhere to professional norms that incentivize producing accurate information and fact-checking (Graves, Nyhan, and Reifler Reference Graves, Nyhan and Reifler2016). While partisan media bias may exist (Arceneaux and Johnson Reference Arceneaux and Johnson2013; Budak, Goel, and Rao Reference Budak, Goel and Rao2016; Levendusky Reference Levendusky2013), professional news outlets must still subscribe to some degree of journalistic integrity that motivates accurate reporting. In contrast, information communicated by others is largely unregulated. This means that individuals can transmit political information to others that is not only biased, but perhaps wildly inaccurate, with little to stop—or correct—them, beyond social or reputational costs (Lupia and McCubbins Reference Lupia and McCubbins1998). On the other hand, peers may be more effective at communicating important political information than elites.
Recent research suggests that information can indeed become distorted through interpersonal communication. In particular, individuals at the end of an information diffusion chain are typically exposed to less information that is less accurate or precise than information at the start of a chain (Carlson Reference Carlson2018; Moussaïd, Brighton, and Gaissmaier Reference Moussaïd, Brighton and Gaissmaier2015). Furthermore, partisan media bias can become amplified through interpersonal communication (Druckman, Levendusky, and McLain Reference Druckman, Levendusky and McLain2018). Individuals who receive information from others are thus likely to be exposed to a different set of information that may or may not be accurate. If the individuals who are least interested in or knowledgeable about politics are also those most likely to look to others for information, they might be unlikely to question the validity of the information communicated by their peers.
There is good reason to expect socially communicated information to be different from the information communicated by the media, but there is less evidence about why these differences matter. In this paper, I explore two interrelated forms of political behavior that could be affected by whether individuals are exposed to information communicated by the media or another person. Specifically, I explore how these different information sets affect objective learning and subjective evaluations.
Consequence 1: Objective Learning
A long line of research has demonstrated that individuals can learn about current events and politics from the news media (Zaller Reference Zaller1992; Bartels Reference Bartels1993; Popkin Reference Popkin1994; Weaver Reference Weaver1996; Baum Reference Baum2002; Wei and Lo Reference Wei and Lo2008; Hill and Roberts Reference Hill and Roberts2019). Even though the mechanism through which individuals learn from the media [e.g., cognitive mediation (Eveland Reference Eveland2001), attention (Drew and Weaver Reference Drew and Weaver1990; Popkin Reference Popkin1994; Zaller Reference Zaller1992)] is debatable, most scholars agree that exposure to the media can inform the electorate. Similarly, scholars have long-theorized that we can learn a lot about politics from others in our social networks (Ahn, Huckfeldt, and Ryan Reference Ahn, Huckfeldt and Ryan2014; Berelson, Lazarsfeld, and McPhee Reference Berelson, Lazarsfeld and McPhee1954; Ellison and Fudenberg Reference Ellison and Fudenberg1995; Huckfeldt, Beck, and Dalton Reference Huckfeldt, Beck, Dalton and Levine1995; Katz Reference Katz1957; Katz and Lazarsfeld Reference Katz and Lazarsfeld1955). While there is evidence to suggest that it is at least possible for individuals to learn from either the media or other people, these studies do not generally compare whether one offers a learning advantage over the other.
Socially transmitted information is likely to be less precise and contain fewer units of information than information communicated by the media itself. This variation in information quantity and quality might impact how much individuals learn about a given topic. On the one hand, we might expect individuals to learn more when they are presented with a greater quantity of higher quality information. If this is the case, we would expect individuals to learn more from media articles than they would learn from socially transmitted summaries of those articles, given the previous research illustrating the differences between these two information sources.
On the other hand, socially transmitted information might facilitate learning by being more accessible than the longer, more detailed information communicated by news articles. Turning to others who are more knowledgeable and share our preferences should, in theory, be a useful information shortcut, allowing us to learn a sufficient amount of information without spending time and resources sifting through information communicated by the media (Downs Reference Downs1957; Lupia and McCubbins Reference Lupia and McCubbins1998). It is possible that these knowledgeable political informants are able to package information in a way that is easier to comprehend than complex news articles. Thus, it is unclear whether individuals will learn and recall more information communicated by the media or other people.
Digging deeper into how much individuals learn from socially communicated information compared with information from the media, individuals should learn differently depending upon the characteristics of the informant. Of particular importance is the perceived level of agreement between the information sender and receiver, which will most readily be cued by partisanship. From a cognitive processing perspective, research on motivated reasoning suggests that individuals are slower to process information that is inconsistent with their preferences (Lodge and Taber Reference Lodge and Taber2013; Taber and Lodge Reference Taber and Lodge2006). But, even from a Bayesian learning standpoint, Hill (Reference Hill2017) shows that individuals have a harder time learning information that is inconsistent with their prior beliefs. Both perspectives should lead us to expect individuals to learn more from like-minded copartisans than disagreeable out-partisans.
Consequence 2: Subjective Evaluations
Related to how much individuals can learn from others relative to the media, I also explore how each information source affects their subjective attitudes. The relationship between facts and attitudes is of much scholarly interest. Some researchers question the extent to which facts impact our subjective beliefs at all (Kuklinski et al. Reference Kuklinski, Quirk, Jerit, Schwieder and Rich.2000). Other researchers find that individuals often do not update their subjective beliefs in a direction that is consistent with the facts, even if they believe those facts to be true (e.g., Gaines et al. Reference Gaines, Kuklinski, Quirk, Peyton and Verkuilen2007; Nyhan et al. Reference Nyhan, Porter, Reifler and Wood2019). Indeed, there are often partisan patterns in how individuals interpret the facts to form their opinions. While factual beliefs theoretically should impact subjective evaluations, the literature to date remains unclear. As such, it is worth considering the extent to which facts presented by other people can impact political attitudes in a way that differs from facts presented by the news media.
Most evidence suggests that media exposure can increase political knowledge and awareness, but can it influence subjective opinions? Political scientists were initially skeptical that the media could influence opinions (Berelson, Lazarsfeld, and McPhee Reference Berelson, Lazarsfeld and McPhee1954; Campbell et al. Reference Campbell, Converse, Miller and Stokes1960), but most research since then argues that the media can indeed impact public opinion (Bartels Reference Bartels1993; Iyengar and Kinder Reference Iyengar and Kinder1987; Popkin Reference Popkin1994; Zaller Reference Zaller1992). Whether the media influences public opinion through priming, making some issues more salient, framing, or some other mechanism, it seems clear that public attitudes about policy and candidates can be influenced by the media.
Social influence has also been shown to affect subjective evaluations. Research on political discussion networks suggests that individuals can persuade members of their social networks (Huckfeldt, Johnson, and Sprague Reference Huckfeldt, Johnson and Sprague2004; Huckfeldt and Sprague Reference Huckfeldt and Sprague1995). Directly examining the two-step flow, Druckman, Levendusky, and McLain (Reference Druckman, Levendusky and McLain2018) find that the effects of partisan media on political attitudes are amplified in political discussions, such that individuals who were not exposed to partisan media, but discussed politics with people who were exposed to partisan media showed dramatic changes in their political attitudes in the direction of the media’s bias. Thus, social political communication can have a dramatic impact on attitudes, above and beyond the independent influence of the partisan media.
Beyond active persuasion and the downstream effects of partisan media, I argue that social information transmission could still have a meaningful impact on opinion. A relatively small segment of the American population consumes partisan media (Arceneaux and Johnson Reference Arceneaux and Johnson2013; Levendusky Reference Levendusky2013), which means that it is also important to consider how socially transmitted information stemming initially from non-partisan media—that is, media that has not been shown to be biased toward Republicans or Democrats—impacts public opinion. Non-partisan, objective information might quickly become politicized through social communication. Even if individuals are not actively trying to persuade others when they discuss politics, their political biases might still be communicated—and possibly amplified—as they attempt to inform others about politics.
The extent to which information is congruent with one’s prior beliefs influences whether and how one is likely to update his or her beliefs (Kunda Reference Kunda1990; Lodge and Taber Reference Lodge, Taber, Lupia, McCubbins and Popkin2000; Redlawsk Reference Redlawsk2002; Erisen, Redlawsk, and Erisen Reference Erisen, Redlawsk and Erisen2017; Hill Reference Hill2017). The possibility that social informants inject their political biases into the information they transmit to others, paired with the general tendency to reject incongruent information suggests that social information transmission might lead individuals to sub-optimally update their beliefs. Individuals exposed to information from an out-partisan should be more likely to be exposed to incongruent information, which they should be less likely to use to update their beliefs. Those exposed to information from a copartisan should be more likely to be exposed to congruent information, which they are likely to accept. Because the congruent information is similar to their prior beliefs, there is little room to update. Both of these cases can be problematic, especially if the incongruent information is accurate and the congruent information is not. Alternatively, individuals might simply employ Bayesian reasoning, updating their beliefs in the direction of the evidence regardless of whether it is consistent with their priors (Coppock Reference Coppock2016). Whether individuals are motivated reasoners or Bayesian updaters has not yet been examined within the context of comparing social information to information from the media.
Ultimately, I expect the content of socially supplied information compared with information from the media to impact subjective political evaluations due to the possibility of bias being introduced in social messages. The media is motivated to adhere to professional norms that require communicating balanced, unbiased information, whereas individuals could be motivated to persuade others. In the real world, those who choose to rely on other people for information about politics might be especially susceptible to bias because they are less likely to be interested in or knowledgeable about politics. As a result, they might be more easily swayed based on the information with which they are presented.
METHOD
I conduct two studies to examine how social information differs from that communicated by the media and how information source affects learning and attitudes. First, I analyze the text from observational and experimental data to examine how information changes as it flows from an official report to media outlets to the public. I then conduct an experiment in which participants are randomly assigned to receive information generated by a news source or another person, using messages generated in the first study.
In both studies, I focus on news articles about economic performance in the United States. This topic is ideally suited for this analysis for four reasons. First, any study about information acquisition and learning needs to protect against the information environment changing during data collection. The Bureau of Economic Analysis (BEA) releases quarterly reports on gross domestic product (GDP) in the United States on a fixed schedule. While the economy certainly can change during a quarter, these economic changes are not typically released more regularly than on a quarterly basis. This means that using a news story about the most recent GDP figures will reflect a relatively stable information environment for a three-month time frame. This gives me more confidence that the information environment will stay constant during the data-collection period.
Second, most news outlets cover economic reports. This means that I will have more data with which to analyze changes in information from the official report to news outlets. The abundance of news articles also suggests that these economic reports are sufficiently newsworthy to be relevant to American voters. This is related to a third advantage of using news stories about economic performance: Economic performance is strongly related to vote choice. When the economy is doing well, individuals tend to reward incumbents at the polls. As a result, exploring the extent to which information source can impact one’s perception of economic performance can have important consequences for how one votes and makes economic decisions.
Fourth, information transmitted about economic performance based on the BEA’s reports can be validated to an objective measure. To the extent that we believe that the data analyses conducted by the BEA are accurate, they should serve as an objective truth of how the economy is performing. We can then examine how information in news articles about the BEA’s report deviates from the objective truth contained in the actual report. One important step further, we can examine how socially transmitted messages deviate from the truth.
STUDY 1: HOW DOES INFORMATION CHANGE? RESEARCH DESIGN
To examine how information changes, I focus on the BEA’s report reflecting the revised GDP estimate of the first quarter of 2017. This report, released on June 29, 2017, reflects the final GDP estimates of President Trump’s first quarter in office, which leaves room for the report to be especially politicized. The BEA report represents the objective benchmark to which I compare information from the media and other people.
Data Collection
Media Transmission
I began by collecting news articles published on June 29, 2017, that were about the GDP estimates. I first searched the Lexis Nexis University database for news articles mentioning GDP or gross domestic product anywhere in the article. I restricted the data collection to US-based news outlets. This search yielded 316 news articles, many of which were newswires that get updated several times each day. After removing duplicates from the hourly newswire updates and articles that did not reference the BEA’s reportFootnote 2 I was left with 32 unique articles. I supplemented this Lexis Nexis search with organic searches using a method similar to that used by Hill and Roberts (Reference Hill and Roberts2019). Specifically, I searched Google News and individual news outlet Web sites, using the same keywords and data restrictions as the Lexis Nexis search. Altogether, I ended up with 61 news articles published on June 29, 2017, about the BEA’s GDP report.
Social Transmission
To examine how information changes as individuals transmit what they learned from a news article to another person, I conducted a telephone game experiment (Aarøe and Petersen Reference Aarøe and Petersen2018; Carlson Reference Carlson2018). I selected one of the 61 news articles for participants to read. The full article is available in the Appendix. I chose an article published by Reuters because Budak, Goel, and Rao (Reference Budak, Goel and Rao2016) show that Reuters is an objectively neutral news source. In an ideal case, I would examine social transmission of a variety of news articles, including those that contain considerable bias. However, as a first step into analyzing these effects, it was more important to examine deviations from a neutral source before adding the complexity of media bias. Selecting the Reuters article thus allows me to evaluate the extent to which individuals introduce bias to the initially objective information sources. Moreover, in an experiment with a limited sample size, it was important to have a common initial information source from which participants might deviate.
I recruited 492 participants on Amazon’s Mechanical Turk for this experiment. While some raise concerns about the generalizability of data collected on Mechanical Turk, others have suggested that for Mechanical Turk, samples are often more representative than other convenience samples, such as college students (Berinsky, Huber, and Lenz Reference Berinsky, Huber and Lenz2012; Mullinix et al. Reference Mullinix, Leeper, Druckman and Freese.2015). In particular, experiments that do not require substantial “buy in” from participants can yield suitable samples (Krupnikov and Levine Reference Krupnikov and Levine2014). Although this sample may not be nationally representative, there are features of Mechanical Turk that are especially suited to telephone game experiments. For example, it is important to ensure that the information environment does not change dramatically over the course of data collection and Mechanical Turk allows researchers to collect data within hours. Furthermore, Mechanical Turk workers are typically more interested in and knowledgeable about politics than the average American. While this means that this sample is less representative of the American public at large, it might be more representative of opinion leaders who transmit information to others in the real world.
After gaining informed consent electronically, participants were asked to read the Reuters news article. The specific prompt was “Please spend a few minutes reading the following article about US economic performance in the first quarter of 2017. You can spend as much time reading it as you like, but we ask that you read it as if you were trying to learn about the economy or read the news in your daily life.” The experimental manipulation was introduced on the next screen. After reading the article, participants were asked to write a message telling another person about the article that they just read. The intended recipient of the message was manipulated such that participants were randomly assigned to write their message to a Republican, a Democrat, or an Independent. Specifically, participants were given the following instructions: “Imagine that you were discussing politics and current events with a [Republican/Democrat/Independent]. Please write what you would tell a [Republican/Democrat/Independent] about the article you just read. Please do not include any names or identifying information about you or the people you know.”Footnote 3 Finally, after writing their messages, participants were asked a few additional survey questions including some demographic information, their perceptions of the article, how much information they recalled from the article, and their subjective evaluations of the economy.
Measuring Information Changes
I demonstrate how information differs between official reports, news articles, and socially generated messages using a variety of strategies. I first present a descriptive analysis of how much information is contained in each stage of this diffusion chain. As a rough proxy for the amount of information, I use the total word count of the report, news article, or social message. Word count correlates very highly with a more structured coding of “units of information” (Erisen, Redlawsk, and Erisen Reference Erisen, Redlawsk and Erisen2017; Moussaïd, Brighton, and Gaissmaier Reference Moussaïd, Brighton and Gaissmaier2015).Footnote 4 I expect the amount of information communicated to decline at each stage such that social messages have the least information and the original report has the most information.
Next, as a proof of concept that the content of the informational messages differs at each stage, I analyze how similar the documents are to each other using cosine similarity. Cosine similarity is a commonly used metric to analyze how similar the content of two documents are (Conover et al. Reference Conover, Ratkiewicz, Francisco, Goncalves, Menczer and Flammini2011; Huang Reference Huang2008). Cosine similarity comes from the angle between two vectors of word counts, one from each of the two documents to be compared. Bounded between zero and one, lower scores mean that there are fewer words in common between two documents, meaning that they are less similar. An important feature of cosine similarity is that it is independent of document length. This is especially important for my analysis because the socially transmitted messages are substantially shorter than the news article and original report. Cosine similarity relies on the bag of words assumption, which means that the order of the words does not matter. Similarity metrics allow us to roughly quantify how much content is shared between two documents. If information is changing as it flows from one source to the next, we should expect fewer words to be the same between documents at each stage. These metrics thus allow us to examine the extent to which information is indeed changing as it diffuses. As shown in the Appendix, the results hold using Jaccard Similarity and cosine similarity with doc2vec. I use Quanteda (Benoit et al. Reference Benoit, Watanabe, Wang, Nulty, Obeng, Müller, Matsuo, Perry, Kuha, Lauderdale and Lowe2018) to calculate the similarity metrics. The results also remain substantively unchanged when the messages have been manually corrected for spelling errors and typos.
Finally, to examine the bias that individuals might introduce as they transmit information to others, I analyze the sentiment of the social messages. To get a better sense for the tone within this context, two independent coders counted the number of units of information that were positive and negative about the economy. I then calculate the percentage of positive and negative units of information relative to the total number of units of information in each social message. I supplement this hand-coded analysis with a dictionary-based sentiment analysis in the Appendix. My general expectation is that individuals inject their biases into information they transmit to others. As a consequence, we should be able to detect partisan bias in how individuals discuss the state of the economy. Specifically, I expect that Republicans will transmit more positive information about the economy than will Democrats.
STUDY 1 RESULTS
How Much Information is Communicated?
I first examine how much information is communicated in each informational message. Considering the number of words contained in a document to be a loose proxy for the amount of information, there is a dramatic loss of information at each stage of this diffusion chain. News articles (mean = 583 words) contained less than half the amount of information as the official report (1,681 words). The social messages contained only about 2.2 percent of the information contained in the official report, with an average length of 37 words. Thus, there is strong support for the expectation that socially generated messages are shorter than news articles. Looking specifically at the socially transmitted messages, there were no statistically significant differences in the length of the messages written to Republicans, Democrats, or Independents.
Does the Content Change?
Beyond how much information is communicated, there might be variation in how similar the informational messages are to each other. Table 1 presents example socially transmitted messages to provide a sense for the content of the socially supplied information in this experiment, as well as to contextualize the similarity scores. Specifically, Table 1 shows the messages with the lowest similarity score (0.10), the median similarity score (0.47), and the highest similarity score (0.77). The messages shown in Table 1 provide some face validity to the similarity measure. Messages with low scores focused more on partisanship and President Trump, offering little information about economic performance. In contrast, the messages with high similarity scores discussed economic growth, often using specific numbers.
Example Socially Transmitted Messages, Similarity, and Sentiment Scores
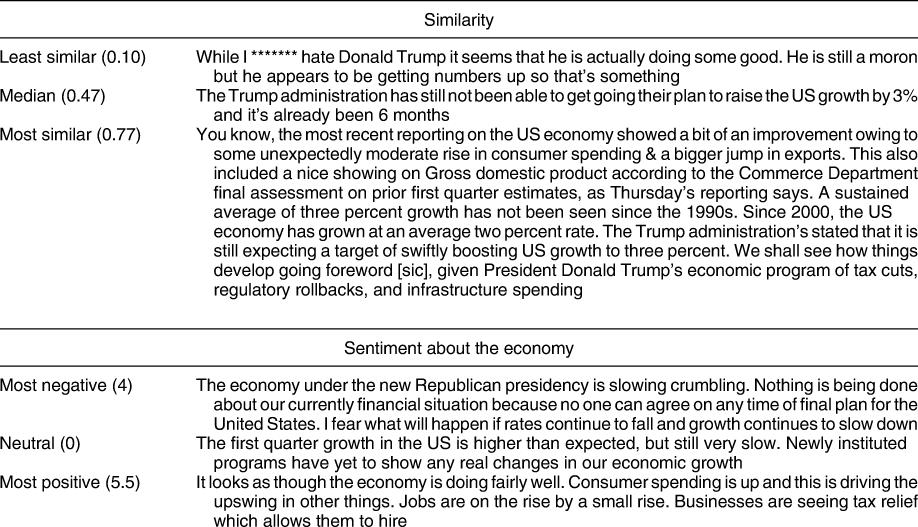
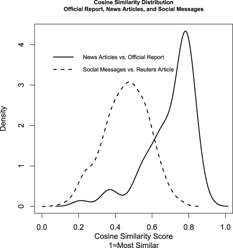
Figure 1 shows the distributions of similarity scores between the different information sets in Study 1. The solid line shows the distribution of similarity scores that indicate how similar each news article was to the official BEA report. The Reuters article used in the experimental portion of Study 1 had a similarity score of about 0.78. The distribution of similarity scores indicates that overall, the news articles were fairly similar to the official report, with the average similarity score being about 0.7.
Distributions of Cosine Similarity Scores
The solid line shows the distribution of similarity scores comparing the news articles to the official BEA report. The dashed line shows the distribution of similarity scores comparing the socially generated messages to the Reuters news article.

The dashed line on Figure 1 shows the distribution of similarity scores comparing the socially generated messages to the Reuters news article. The average similarity score between the news articles and the official report was about 0.7, whereas the average similarity score between the socially generated messages and the Reuters article was about 0.43. The similarity scores between the socially generated messages and the Reuters article were significantly lower than the similarity scores between the news articles and the BEA report (p < 0.001). This suggests that the information communicated in a news article deviates less from the objective original source than socially generated messages deviate from the news articles.Footnote 5
Does the Tone Change?
Given that the socially generated information differs from the information communicated by the media, the next important question is how. Table 1 shows examples of the social messages that were most negative, neutral, and most positive about the economy, based on the hand-coded data. I calculated the percentage of positive units of information about the economy in a message, as well as the percentage of negative units of information about the economy in a message. The results suggest that, on average, 24.3% of the information contained in a social message was positive about the economy, whereas 14.3% of the information in a social message was negative about the economy. The social messages contained significantly less negative information than the article, which contained 17.7% negative economic information (p < 0.001).
As expected, there are clear differences in how Republican and Democrat participants wrote about the economy. Specifically, Republicans transmitted significantly more positive information about the economy (p < 0.01), while Democrats transmitted significantly more negative information about the economy (p < 0.05). Moreover, Republicans transmitted significantly less negative information than the Reuters article (p < 0.001), while there was no difference in negative content between the Reuters article and the messages written by Democrats. This means that socially generated information can be prone to partisan biases absent in information from the media.
STUDY 2: WHAT ARE THE CONSEQUENCES OF SOCIALLY GENERATED INFORMATION? RESEARCH DESIGN
Study 1 demonstrated that information communicated by the media differs from the information communicated by official reports and socially generated information is substantially different from both official reports and news articles. Study 2 examines the consequences of these differences by examining changes in information recall and subjective evaluations after exposure to a randomly assigned information treatment.
Participants
Participants were recruited from Survey Sampling International using a quota-based sampling procedure to ensure that the sample is demographically similar to the United States according to census records. The sample consisted of approximately 1,000 participants. Respondents ranged in age from 18 to 89 years old, with the average respondent being 48 years old. The sample was approximately evenly split between women (50.4%) and men (49.6%). The sample’s ethnoracial composition is slightly different from the estimates based on Census records. Specifically, this sample over-represents Asian Americans (10.7% instead of 4.7%) and under-represents Latinos (10.1% versus 16.3%). The sample was evenly split between Democrats (39.6%) and Republicans (39.2%), and a smaller sample of pure Independents (21.1%). Descriptive statistics of this sample and comparisons between treatment groups are available in the Appendix.
Experimental Design
This experiment included four key components.Footnote 6 First, participants answered pre-treatment questions to measure their baseline knowledge about US economic performance and baseline attitudes about the economy and President Trump. Having pre-treatment measures of participants’ objective knowledge and subjective evaluations allows me to make within-subject comparisons to more accurately examine changes in learning and evaluations after exposure to information. Second, participants answered a variety of questions that were part of other studies.Footnote 7 These questions serve to distract participants from the purpose of the study and to provide some distance between the pre-treatment measures and the treatment. Third, participants were randomly assigned to one of the four treatment groups and presented with a corresponding informational treatment that either came from the media or another person. The treatment groups included the following: (1) Media, (2) Democrat Informant, (3) Republican Informant, and (4) Independent Informant. Participants in the media treatment received the Reuters article about US economic performance in the first quarter of 2017 used in Study 1. Participants in the social treatments—Democrat Informant, Republican Informant, and Independent Informant—were given one of the social messages generated in Study 1. Participants in the Democrat Informant condition received a message written by a Democrat in Study 1, participants in the Republican Informant treatment received a message written by a Republican in Study 1, and participants in the Independent Informant condition received a message written by an Independent in Study 1.Footnote 8
As shown in Study 1 and by previous research (e.g., Ahn, Huckfeldt, and Ryan Reference Ahn, Huckfeldt and Ryan2014), socially supplied information is likely to vary conditional on the partisanship of both the information sender and the receiver. As a result, it was important to randomly assign participants to receive information written by individuals with different partisan identities. However, because the information senders are likely to tailor information conditional on the partisanship of the intended recipient, I needed to account for this in assigning informational messages. In Study 2, participants are randomly assigned to receive a message written by a Democrat, a Republican, or an Independent in Study 1. Because Study 1 participants were randomly assigned to write messages to Republican, Democrat, or Independent recipients, Study 2 participants received a message that was intended to be read by someone of their own partisanship. For example, a Democrat Study 2 participant randomly assigned to the Republican Informant condition would receive an informational treatment written by a Study 1 Republican to a Democrat recipient. A Democrat Study 2 participant randomly assigned to the Democrat Informant treatment would receive a message written by a Study 1 Democrat to a Democrat recipient. This approach means that participants in the same treatment group are not all receiving the exact same informational treatment. However, in the real world, a Democrat would rarely receive information that was intended for a Republican. Thus, it would be unrealistic to present a Democrat participant with an informational message that was written for a Republican audience.
Instead of selecting only one message for each social treatment combination, participants within each treatment were presented with a randomly selected informational message. For instance, a Democrat participant in the Democrat Informant condition would read one of the messages written by a Democrat to a Democrat in Study 1. A different Study 2 Democrat participant randomly assigned to the Democrat Informant condition might receive a different message written by a Democrat to a Democrat in Study 1. To preserve the authenticity of the socially transmitted messages, I did not edit the messages to correct typos, spelling errors, or grammatical errors, and I preserved all capitalization and punctuation. I did, however, edit some messages in two ways. First, I used asterisks in place of letters used in profanity or expletives. Study 1 participants rarely used expletives, but in order to protect Study 2 participants from viewing explicit content, I used asterisks over these words. Second, some participants opened their messages with statements like “I would tell them that” instead of writing a message directly to the hypothetical person. In these cases, I simply deleted the introductory phrase and left the rest of the message unedited.
After reading their randomly assigned informational treatment, participants were asked a series of post-treatment questions. They were asked the same objective knowledge and subjective evaluation questions as in the pre-treatment portion of the study to allow for within-subject comparisons. Participants were also given the opportunity to seek additional information about US economic performance and then were asked a series of political engagement questions. The study concluded by asking participants a few questions about their perceptions of the information source itself, such as whether they considered it trustworthy, biased toward Democrats or Republicans, and whether the structure of the information was similar to what they would experience in their daily lives.
Dependent Variable Measurement
There are two dependent variables of interest in this study: the amount of objective information participants learned and the change in subjective evaluations. Both of these dependent variables are analyzed using both within-subject and between-subject measures.
Learning
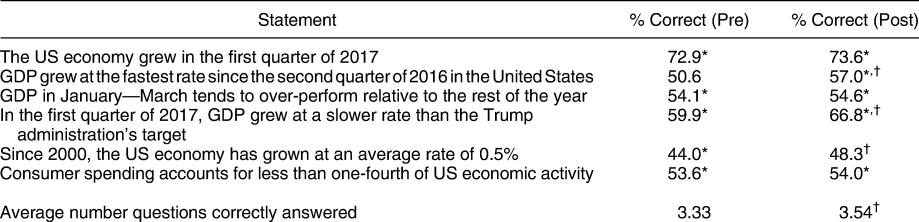
I measure learning by calculating the change in the number of questions about information communicated in the original Reuters article participants answered correctly after exposure to an information treatment. Both before and after treatment, participants were asked to report whether each of six statements was true or false. The statements are shown in Table 2. Ultimately, learning is calculated by subtracting the number of correct answers to the pre-treatment questions from the number of correct answers to the post-treatment questions. Thus, positive learning scores indicate that participants answered more questions correctly post-treatment than they did pre-treatment.Footnote 9
Performance on Knowledge Questions

* Significantly different from 50%.
† Post-treatment significantly greater than pre-treatment.
p < 0.05.
Evaluations
I measure two types of subjective evaluations: economic performance and presidential approval. I first measure participants’ perceptions of the economy, the focus of the information treatments, using Gallup’s economic confidence index. Economic confidence is measured using the average response to two questions: (1) Right now, do you think that the economic conditions in the country as a whole are getting better or getting worse? And (2) how would you rate economic conditions in this country today? I measure the confidence index both pre- and post-treatment, which allows me to calculate a within-subject change in economic confidence. Thus, the change in subjective evaluations of the economy (economic confidence) is measured by subtracting the pre-treatment economic confidence score from the post-treatment economic confidence score. Positive economic evaluation change scores indicate that participants had more positive evaluations of the economy post-treatment.
In addition to economic evaluations, I examine how participants evaluated the president. I use Gallup’s presidential approval questions about overall presidential approval and presidential approval with respect to the economy. The full question wording is available in the Appendix. Both questions were asked pre- and post-treatment, which allows me to capture changes in presidential approval in response to the information treatments. For both presidential evaluations, I subtract the pre-treatment approval from the post-treatment approval to create change in approval scores such that positive values indicate greater approval post-treatment.
Independent Variable Measurement
Information Source Treatment
The primary independent variable of interest is the information source—whether individuals were randomly assigned to receive information from the media or another person. In the analyses that follow, I compare the individuals who received information from the media with those who received information from a Republican, a Democrat, or an Independent in Study 1. In regression models, those in the media treatment will be the omitted category.
Ideal and Non-Ideal Informants
Following work in the political discussion network literature that builds upon Lupia and McCubbins (Reference Lupia and McCubbins1998), I created a variable that indicates whether an individual received information from an ideal informant. Here, an ideal informant is one who has the same partisanship as and is more knowledgeable than the recipient. The ideal informant variable takes the value of 1 if the Study 2 participant received a message from a Study 1 participant of the same partisanship who was more knowledgeable, and zero otherwise. I measure the relative knowledge-level by comparing the number of factual questions about the content of the article Study 1 participants answered correctly with the number of factual questions about the content of the article Study 2 participants answered at baseline—before exposure to the informational message. If the Study 1 participant answered more questions correctly than the Study 2 participant, then the Study 1 participant was considered more knowledgeable.
Information-Level Controls
Beyond analyzing the average treatment effects across the distribution of message and informant characteristics, I introduce a host of control variables based on the characteristics of the information and informant.
First, I control for properties of the text of the messages that might influence the dependent variables. I control for the amount of information communicated by using the hand-coded units of information in a message. I also control for the similarity between each socially generated message and the news article. I measure similarity with the same cosine similarity scores calculated in Study 1. Finally, I control for the sentiment of the information communicated using percentage of information that was positive about the economy, based on the hand-coded data.
Recipient-Level Controls
In addition to controlling for characteristics of the information, I control for characteristics of the recipient that could impact how much he or she was able to learn and update his or her beliefs about the state of the economy. These characteristics should be evenly distributed between the treatment groups, and the balance table in the Appendix suggests that this is the case. However, I still include the controls to show that the treatment effects are robust to these individual-level characteristics that could otherwise confound the relationship.
First, I control for political knowledge, which is measured using the number of standard American government knowledge questions that participants could correctly answer. I used four questions commonly used on the American National Election Study (ANES),Footnote 10 meaning that the political knowledge score ranges from zero (no questions answered correctly) to four (all four questions answered correctly). Next, I control for political interest, which is measured using another question common to the ANES. Participants were asked how interested they are in politics and public affairs on a scale that ranged from one (not at all interested) to four (very interested). I control for partisanship with a dummy variable that takes the value of one if the participant identified as a Democrat and zero otherwise.
Finally, I control for demographic characteristics including age, race, gender, and education. Age is a continuous variable measured in years. I measure race using the participants’ self-reported ethnoracial identification. I dichotomize this variable such that it takes the value of one if the respondent is White and zero otherwise. Similarly, I create a dummy variable for gender that takes the value of one if the participant was female and zero otherwise. Finally, education is an ordinal variable that represents the highest level of education received. Higher values indicate more years of education.
STUDY 2 RESULTS
Learning
Table 2 shows the knowledge questions used to measure how much individuals learned about US economic performance in the first quarter of 2017. The answers to each question were communicated in the Reuters article used in the media treatment and from which the social treatments were generated. Table 2 also shows the percentage of respondents who correctly answered each question before and after exposure to the information treatment. A significantly greater percentage of respondents correctly answered questions after exposure to treatment than before exposure to treatment for three out of the six questions. Across all of the questions, about one-third of the participants were able to learn successfully after exposure to information.
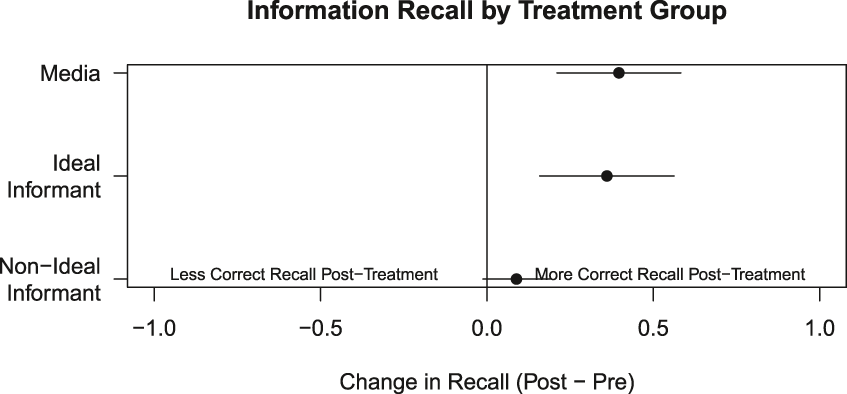
Next, I break down these overall trends by treatment group to examine how the informational treatments affected learning. Figure 2 shows the change in the number of correct responses before and after treatment by treatment group. Positive values indicate that a respondent answered more questions correctly after exposure to treatment. Specifically, +1 means that on average, respondents answered one more question (out of six total) correctly after exposure to information. The results suggest that participants in the media treatment answered significantly more questions correctly after exposure to treatment than before exposure to treatment (p < 0.001). Specifically, those in the media treatment answered approximately 0.4 more questions correctly after exposure to information.
Average Change in Recall after Exposure to an Informational Treatment
Horizontal lines represent 95 percent confidence intervals. The vertical line at zero indicates no change in the amount of correct information recalled after exposure to treatment. Thus, values significantly greater than zero indicate learning based on the treatment, values indistinguishable form zero indicate no learning, and values less than zero indicate that respondents were mislead by the informational treatments.

Participants in the social treatments also learned from the information, answering more questions correctly after exposure to a social message than they did at baseline (p < 0.05). While all participants showed evidence of learning, participants in the media condition learned significantly more than participants in the social conditions (p < 0.05). Next, I examine whether ideal informants can compete with the media. Participants who received information from an ideal informant learned significantly more than participants who received information from a non-ideal informant (p < 0.05). However, there was no statistically significant difference in learning between those who received information from an ideal informant and those who received information from the media, even though socially generated information is substantially different from and shorter than the news article, as shown in Study 1. These results hold if participants who answered all six questions correctly pre-treatment are excluded. Tables 22–23 in the Appendix show that these results hold after controlling for individual and information-level control variables as discussed above.
Knowledge or Copartisanship?
Why do ideal informants help individuals learn? In an effort to unpack the mechanism that drives the patterns shown in Figure 2, I examine the informants’ self-reported motivations as they transmitted information. Study 1 participants, the informants, were asked to report what they were trying to accomplish with the message they wrote. The vast majority of respondents (74.4%) reported that they were trying to objectively inform the other person, 21.6% reported that they were trying to persuade the other person to view the economy or politicians the way that they do, 2.2% reported that they were trying to convince the other person to get involved in politics, and 1.7% reported that they were trying to mislead the other person about the state of the economy. While social desirability bias could surely be inflating the percentage of respondents who reported trying to objectively inform the other person, it seems that individuals overall were trying to be objective, reliable information shortcuts. Importantly, ideal informants were no more likely to report trying to objectively inform someone than non-ideal informants. Breaking apart the two conditions of being an ideal informant (knowledge and copartisanship), we see that there was no difference in motivation based on knowledge level, but those who wrote to copartisans were significantly more likely to report that they were trying to objectively inform than those who wrote to out-partisans (p < 0.05).
If information recipients have some idea about informants’ motivations, we should expect them to consider most informants to be objective, particularly if they are copartisans. Thus, information from copartisans should be viewed as more credible. Moreover, knowledgeable informants should be better equipped to transmit complete and accurate information. Breaking apart knowledge and copartisanship suggests that knowledge is the most important characteristic for objective learning. Indeed, those who received information from someone who was more knowledgeable than they were learned significantly more than those who received information from someone who was less knowledgeable.Footnote 11 However, individuals learned the same amount of information from copartisans as out-partisans. This suggests that finding knowledgeable political informants is more important for learning than finding copartisan informants.
We might expect learning to vary based on the informant’s partisanship and the specific content included in the message. In particular, a Democrat who transmits information that is positive about the economy should be viewed as particularly credible since it is not self-serving for a Democrat to say this because Republicans are currently in office. Likewise, positive information transmitted by a Republican should not be as informative because recipients might assume the Republican is simply passing on self-serving information. This study is not sufficiently powered to test this possibility, but future research should take care to do so, particularly in a context in which identifying self-serving information is unambiguous. For example, studying these effects in a case in which the economy was decidedly strong or weak and when the current administration has been in office for a longer period of time might make it easier to identify self-serving information.
Evaluations
Economic Evaluations
Next, I examine how different sets of information impact subjective evaluations of the economy and the president. I expect that participants will have more negative evaluations of the economy and of President Trump after exposure to a message from a Democrat, while participants in the Republican Informant condition will have more positive evaluations of the economy and President Trump. I expect this change based on the bias that Democrats and Republicans in Study 1 might have included in the messages they passed on. As shown in Study 1, Democrats are more critical of President Trump and the economy he oversees, while Republicans are more positive about President Trump and the economy. In order to establish that the messages used in the social treatments were perceived as biased in the expected direction, I asked participants to indicate the extent to which they thought the information they received favored Democrats or Republicans. Overall, the perceived bias of the information treatments appeared to align with the partisanship of the author of the informational message.Footnote 12
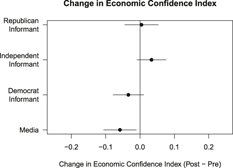
Figure 3 shows the average change in economic confidence after exposure to an informational message between treatment groups. Points to the right of zero suggest an increase in economic confidence, that is, more positive evaluations of the economy, while points to the left of zero indicate a decrease in economic confidence. Participants in the media condition had significantly lower economic confidence after exposure to the news article, compared to their baseline economic confidence (p < 0.05). This is somewhat surprising because the article boasted a headline indicating that the economy had grown more than previously expected. However, the article also discussed some negative aspects of economic growth, such as the economic growth being slower than the three percent target rate set by the Trump administration. The social treatments did not appear to significantly affect participants’ economic confidence. This relationship holds when analyzing Democrats, Republicans, and Independents separately: regardless of partisanship, participants in the social treatments did not significantly alter their economic confidence when exposed to socially supplied information about the economy. However, in the media treatment, only Democrats and Independents had significantly lower economic confidence after exposure to the news article; Republicans were not influenced by the news article.
Change in Economic Confidence Index by Treatment Group
Horizontal lines represent 95 percent confidence intervals. The vertical line about zero represents no change in economic confidence. Points to the right of zero indicate perceptions that the economy was getting better post-treatment; points to the left of zero indicate perceptions that the economy was getting worse post-treatment.

Presidential Approval
In addition to the modest changes in economic evaluations based on the informational message, I also observe modest changes in evaluations of President Trump. Similar to the evaluations of the economy, those who received the news article had significantly more negative evaluations of how President Trump is handling the economy after exposure to treatment. Socially generated information, even from an ideal informant, did not significantly influence subjective evaluations of President Trump with respect to the economy. However, the news article did not influence evaluations of the president overall, but socially generated information did. Those who received information from a Republican or an Independent had significantly more positive evaluations of how President Trump is handling his job as president after exposure to that information (p < 0.05). Breaking these results down by the partisanship of the recipient, Democrats updated their beliefs the most.
Together, the subjective evaluations results suggest that the media can significantly alter perceptions of economic performance and how the president is handling the economy, but some social messages can significantly alter presidential approval overall. In particular, when participants are exposed to information from someone likely to support the president, approval tends to increase more than when someone is exposed to information from someone likely to oppose the president. This relationship is especially strong among Democrats, who should be the least likely to support President Trump. Before exposure to treatment, about 74 percent of Democrats strongly disapproved of how Donald Trump is handling his job as president. After exposure to a message from a Republican, this dropped to 68 percent. These results suggest that those who are initially opposed to the president might be more likely to update their preferences in light of new information than those who are initially supportive of the president, especially if that information comes from a supporter of the president.
DISCUSSION
In this paper, I explored theoretical consequences of reliance on social information. As a proof of concept, I first demonstrated that socially transmitted messages are substantially shorter than information communicated by the media and official reports. Moreover, the content of this information is significantly different, as measured by the words used in each message. Information communicated by the media is about twice as similar to the official source than information communicated by other people. Second, I examined how these important differences in information affect learning and evaluations. I found that participants exposed to socially generated information learned significantly less information than participants exposed to information from the media. However, those exposed to information from an ideal informant who shares their partisanship and is better informed learned significantly more than those exposed to information from a non-ideal informant, but the same amount as those who received information from the media. Thus, receiving information from ideal informants could serve as a valid information alternative to the media, just as previous research has theorized (Downs Reference Downs1957; Katz Reference Katz1957; Lupia and McCubbins Reference Lupia and McCubbins1998). Finally, I examined whether the information source affected evaluations. The results indicated that social information does not appear to affect economic confidence, but it can affect presidential approval such that those exposed to information from a Republican or Independent showed significantly greater approval of President Trump compared to those who were exposed to information from another Democrat or the media. Altogether, these results suggest important implications for the public’s self-educating potential.
This study is not without its limitations. First, this study examines only one issue area: economic evaluations. There are important reasons discussed throughout this paper for focusing on economic news, but it limits the external validity of this analysis. It is possible that social information transmission about other topics, such as elections, high- or low-salience policies, Supreme Court decisions, local politics, political scandals, or other topics might have different effects. There might even be different effects based on other economic news, such as unemployment data, which might be more familiar to the average reader than GDP. Future research should take care to examine whether the results presented here hold for different topics.
Second, participants in social treatments in Study 2 knew very little about the author of the information they received. Participants only knew the partisanship of the author and that he or she had just read a news article about the US economic performance in the first quarter of 2017. In the real world, however, individuals who rely on others for information are likely to know their informants personally and they can thus weigh the information they provide accordingly. That individuals knew little about the informants also limits the external validity of this analysis.
Third, the experimental designs used in Studies 1 and 2 are complex, making it possible that some analyses are under-powered. Beyond the possibility that some null results are simply under-powered, Study 2’s complex design warrants further discussion. Participants in Study 2 were randomly assigned to read either a full news article or one of many messages generated by a Republican, Democrat, or Independent in Study 1. This means that most participants in the social treatments were exposed to a slightly different informational message. In addition, the messages were tailored toward the partisanship of the participant. This feature adds some external validity in that it ensures that Democrats receive information that was intended for a Democrat to read instead of information that was intended for a Republican to read, just like what would happen in the real world. However, it challenges the internal validity of the experiment by making the treatment less clear.
Despite these limitations, this analysis presents important results that improve our understanding of information transmission in American politics. Furthermore, it opens the door for ample opportunities for additional research utilizing similar research designs. Future research can build on the results presented here to examine the consequences of social information transmission about additional topics, using different initial news sources, using different characteristics to describe the social informants, and using different operationalizations of an ideal informant.
CONCLUSION
Given that political discussion is one of the most common ways in which individuals acquire information about politics, it is imperative that we understand how this information source impacts political attitudes and behavior. To date, most research on the role of information in political attitudes and behavior focuses on information from the media. However, as I demonstrate here, socially communicated information is substantially different from information communicated by the media. It is thus important that we begin to unpack the effects of socially supplied information, just as we have with information from the media. This paper makes an important contribution by providing a step toward understanding the consequences of social information transmission.
In part, I provide evidence in support of classic theories of opinion leaders using a novel research design. Similar to previous theories (e.g., Downs Reference Downs1957; Lupia and McCubbins Reference Lupia and McCubbins1998), I find that individuals can learn the same amount from others who share their partisanship and are more knowledgeable as they would from the media. This even holds with messages much shorter than the full news article. However, this important theoretical work was largely previously tested using controlled, incentivized lab experiments in which individuals would communicate about whether a coin toss was heads or tails, for example (Lupia and McCubbins Reference Lupia and McCubbins1998). This line of research necessarily abstracted away from the content of the message to pinpoint the effects of the informants and recipients, even though communication scholars argue that the messenger, message, and audience are all important. The research design employed here allows us to broaden our understanding of the effectiveness of turning to others for information by reintroducing the content of the message to the analysis. Thus, there is an empirical contribution in this paper by providing new evidence in support of classic, oft-cited theories.
Social information is not a panacea for the lack of attention to and knowledge from the news media in American politics. Many individuals over-estimate the expertise of their social ties (Ryan Reference Ryan2011) and actively avoid discussing politics with those who are more politically knowledgeable in an effort to avoid psychological discomfort. This means that many of our political discussions are unlikely to be with ideal informants who can actually close the learning gap between the news media and social informants.
Beyond the impact of information source on learning, the effects on subjective evaluations were quite different. In particular, individuals did not update their beliefs about the economy nor the president’s handling of the economy, in response to information from another person—even an ideal informant. This adds to the body of work suggesting that objective facts have minimal effects on political attitudes (Kuklinski et al. Reference Kuklinski, Quirk, Jerit, Schwieder and Rich.2000). I show that indeed, individuals who learn the same objective facts still have different subjective evaluations. However, I build on previous work by showing that these effects extend beyond directional motivated reasoning based on one’s partisanship and can be influenced by the information source. As such, these results speak to the debate over motivated and Bayesian reasoning (Coppock Reference Coppock2016), showing that the information source might be a crucial component in this process.
Individuals use information from the media differently than they use information from other people. Just as scholars have thoroughly explored the consequences of partisan media bias, I argue that we need to also consider the impact of bias in socially generated information. With the rise of social media, it is important to reconcile the media bias and political discussion literatures to understand the benefits and limitations of social political communication relative to the media.
SUPPLEMENTARY MATERIAL
To view supplementary material for this article, please visit https://doi.org/10.1017/S000305541900008X.
Replication materials can be found on Dataverse at: https://doi.org/10.7910/DVN/NOWHWG.




Comments
No Comments have been published for this article.