I. INTRODUCTION
High-entropy alloys (HEAs) are a class of metallic alloys that have recently gained intense interest, especially over the course of the last decade.Reference Yeh, Chen, Lin and Chen1–Reference Pickering and Jones8 Research in HEAs is considered to be a field that allows for the evaluation of prevalent theories under new, previously unexamined conditions. Among HEAs, no alloy has been subject to more research than the face-centered cubic (fcc), equiatomic CoCrFeMnNi alloy, which was first synthesized by Cantor et al.Reference Cantor, Chang, Knight and Vincent9 This alloy exhibits reasonable mechanical properties by virtue of its work-hardening capability and ductility at room temperature as well as at cryogenic temperatures.Reference Otto, Dlouhý, Somsen, Bei, Eggeler and George10 It is also seen that CoCrFeMnNi shows persevering fracture toughness even at low temperatures.Reference Gludovatz, Hohenwarter, Catoor, Chang, George and Ritchie11 This is a key characteristic of medium to low stacking fault energy (SFE) materials. Zaddach et al.Reference Zaddach, Niu, Koch and Irving12 found the SFE to be 25 mJ/m2 by evaluation of X-ray diffraction (XRD) experiments. Density functional theory (DFT) calculations from the same group yield SFE between 18.3 and 27.3 mJ/m2.Reference Zaddach, Niu, Koch and Irving12 Huang et al.Reference Huang, Li, Lu, Tian, Shen, Holmström and Vitos13 later verified those calculations and, furthermore, found a steady drop of SFE down to below 5 mJ/m2 at about 4.2 K by evaluating chemical, magnetic, and strain contributions to SFE, once again by means of DFT calculations. Generally, SFE is considered to be the principal factor for the appearance of twinning-induced plasticity (TWIP) in steels, seen at SFE values below about 35 mJ/m2.Reference Allain, Chateau, Bouaziz, Migot and Guelton14 Similarly, transformation-induced plasticity (TRIP) due to the formation of hexagonally closed packed ε-martensite is seen at SFE values below about 18 mJ/m2.Reference Allain, Chateau, Bouaziz, Migot and Guelton14 Some other studies in this context refer to different ranges of SFE but nonetheless similarly associate ranges of SFE to the respective deformation mechanisms.Reference Saeed-Akbari, Imlau, Prahl and Bleck15,Reference Cooman, Kwon and Chin16 Accordingly, the formation of ε-martensite was proposed by Huang et al.Reference Huang, Li, Lu, Tian, Shen, Holmström and Vitos13 during deformation at temperatures even lower than 77 K. Thus, a more enhanced work-hardening behavior is to be expected.
Another aspect of the TWIP effect in HEAs which has increasingly received attention recently is the onset stress of deformation twinning. By performing interrupted tensile tests at 77 K, Laplanche et al.Reference Laplanche, Kostka, Horst, Eggeler and George17 revealed an onset of deformation twinning at a true stress of (720 ± 30) MPa. Since this stress can also be reached at room temperature, above an engineering strain of 25%, nanoscaled twins are observed under these conditions. This observation is further validated by the appearance of twins during severe rolling at room temperature.Reference Stepanov, Tikhonovsky, Yurchenko, Zyabkin, Klimova, Zherebtsov, Efimov and Salishchev18 The first study using single crystals of CoCrFeMnNi for critical stress determination was recently published by Abuzaid and Sehitoglu.Reference Abuzaid and Sehitoglu19 They reveal σ = 460 MPa (τ = 153 MPa) for deformation twinning under tensile load along a 〈111〉-direction at 77 K. Considering the relevant constraints for the appearance of mechanical twins in polycrystals, Sun et al.Reference Sun, Tian, Lin, Yang, Dong, Wang and Zhang20 report a critical twinning stress of the order of 500 MPa for CoCrFeMnNi for a grain size in the range of 10–100 µm at room temperature. Evidently, there is no consistent trend of critical twinning stress observed in the literature for this alloy so far. However, it is noteworthy that a critical twinning stress computed from the model of Geissler et al.Reference Geissler, Freudenberger, Kauffmann, Krautz, Klauss, Voss, Eickemeyer and Schultz21 for an SFE of 25 mJ/m2 quite accurately reflects the value given by Laplanche et al.Reference Laplanche, Kostka, Horst, Eggeler and George17 Another aspect that still needs to be verified experimentally is the temperature-dependence of the SFE of CoCrFeMnNi.
When conducting tensile tests at very low temperatures, in addition to twinning and possible ε-martensite formation, serrated plastic deformation can be observed.Reference Pustovalov22 This is a phenomenon that was observed earlier in many different metals and alloys.Reference Blewitt, Coltman and Redman23–Reference Ogata, Ishikawa, Hiraga, Nagai and Yuri25 In 1957, the first investigation of this kind was done on Cu single crystals at 4.2 K, by Blewitt et al.Reference Blewitt, Coltman and Redman23 Subsequently, other single crystalsReference Aono, Kuramoto and Kitajima26,Reference Haasen27 as well as polycrystalline metalsReference Ishikawa28,Reference Moskalenko, Natsik and Kovaleva29 have been studied under a variety of conditions to explore cause and nature of the serrated behavior. Two major hypotheses for the cause of the serrated flow behavior have been proposed: (i) The first assumes that the serrations are an extrinsically driven event.Reference Pustovalov22,Reference Moskalenko, Natsik and Kovaleva29 During the course of the deformation, there are distinct local deformation events taking place, under localized high strain rate conditions, which in turn release heat enabling thermal softening. (ii) The second hypothesis argues that the serrations are intrinsically linked to the markedly changed dynamics of dislocation generation and motion at very low temperatures and possibly deformation twinning. Serrations in this case are considered to be the result of dislocation motion inhibition at barriers, and the stress drops in turn correspond to avalanche slip events. In the latter case of an intrinsically linked event, the dynamics of dislocations would be significantly affected by additional solutes which might exacerbate this effect. The most extreme condition of this situation would be found in a HEA, which naturally has a distorted lattice even though the extent of the lattice distortion is still under debate.Reference Miracle and Senkov3 The idea that dislocation–solute interaction significantly alters the dynamics of dislocation motion in general is further supported by the appearance of a strong Portevin–LeChatelier effect in CoCrFeMnNi at certain elevated temperature and specific strain-rates, as found by Carroll et al.Reference Carroll, Lee, Tsai, Yeh, Antonaglia, Brinkman, LeBlanc, Xie, Chen, Liaw and Dahmen30 A recent overview of serrated plastic flow including that of HEAs mostly at elevated temperatures is provided elsewhere.Reference Zhang, Liu, Chen, Xie, Liaw, Dahmen, Qiao and Wang31
The present article focuses on the mechanical response of CoCrFeMnNi in tensile test experiments at cryogenic temperatures of 4.2 K and higher. Specific emphasis has been placed on the microstructural evolution during mechanical loading, especially on the possibility of ε-martensite formation, the possible initiation of the observed work-hardening plateau by the onset of deformation twinning and on a quantitative description of serrated plastic flow.
II. EXPERIMENTAL
A. Manufacturing of the material
The CoCrFeMnNi samples investigated in this work were synthesized from elemental bulk material. Co, Cr, Fe, Mn, and Ni with purities of 99.95%, 99.99+%, 99.99%, 99.99%, and 99.97%, respectively, were weighed according to the stoichiometric composition and then melted under an Ar atmosphere using an AM/0.5 arc-melting device by Edmund Bühler GmbH (Bodelshausen, Germany). Mn was etched prior to the melting, using a 10:1 solution of water and nitric acid to maintain the purity of the final material. The melting chamber was pumped to a pressure of 5 × 10⁻² mbar and then flooded with Ar. This process was repeated three times before finally pumping to a high vacuum of less than 1 × 10⁻⁴ mbar. The chamber was then flooded with Ar once more. The Ar pressure during the arc-melting was 600 mbar. A Zr getter was liquefied prior to each melting step to getter any residual oxygen. The melted buttons were flipped and remelted at least five times prior to being cast as rod-shaped ingots in a water-cooled Cu mold. The diameter of the rod portion of the mold was 14 mm and the rod was 175 mm long. The composition of the samples in the as-cast state was determined by inductively coupled plasma optical emission spectrometry (ICP-OES). In subsequent batches and during the processing of the material, chemical composition was monitored by standard-related, energy-dispersive X-ray spectroscopy (EDX; detailed description in the following). A slight Mn- and Cr-deficit due to evaporation during the remelting process is observed: 20.4 at.% Co, 19.7 at.% Cr, 20.3 at.% Fe, 19.2 at.% Mn, and 20.4 at.% Ni (accuracy of 0.1 at.% in each case by ICP-OES). Homogenization of the as-cast microstructure was performed in evacuated glass tubes at 1200 °C for 72 h and subsequently quenched in water. The homogenized material was deformed down to 6 mm in diameter via rotary swaging. Tensile test specimens were machined from these rods as described in Sec. II.C. The deformed material was finally recrystallized by annealing at 800 °C for 1 h in an evacuated glass tube followed by water quenching.
B. Materials characterization
XRD analyses were carried out on recrystallized and polished longitudinal sections with the use of a D2 Phaser system equipped with a Lynxeye line detector (Bruker, Billerica, Massachusetts). The lattice parameter was determined by extrapolating toward Θ = 90° in accordance with Nelson–RileyReference Nelson and Riley32 using the weight function  ${1 \over 2}\left( {{{\cot }^2}\;\Theta + \cot \;\Theta \cdot \cos \;\Theta } \right)$. This yielded a value of 0.359(7) nm for the single-phase, fcc Cu-type crystal structure. For microstructural investigations, the samples were prepared by following a standard metallographic procedure. After grinding with a series of abrasive papers of decreasing grit size, the samples were polished using 3 and 1 µm diamond suspensions as well as a noncrystallizing oxide polishing suspension (OP–S) with pH = 9.8, supplied by Struers (Willich, Germany). Scanning electron microscopy [SEM; using backscatter electron imaging (BSE)], EDX (mentioned before for control of chemical composition), and electron backscatter diffraction (EBSD) analyses were performed using two SEMs, namely a Zeiss EVO 50 and a Zeiss Auriga 60 (Carl Zeiss, Oberkochen, Germany). The EVO 50 system is equipped with a Thermo Scientific EDX system, Thermo Fisher Scientific (Waltham, Massachusetts), whereas the Auriga 60 system is equipped with an EDAX DigiView EBSD camera system (Ametek, Berwyn, Pennsylvania). For transmission electron microscopy (TEM), a Tecnai F20 ST (FEI, Hillsboro, Oregon) operated at 200 kV equipped with a field emission gun and an Orius SC600 CCD camera (Gatan Inc., Pleasanton, California) was used. High angle annular dark field scanning TEM images (STEM-HAADF) and selected area diffraction (SAD) patterns were acquired to study the local crystallography and microstructure. For this purpose, target preparation was performed by in situ lift-out using the focused ion beam (FIB) of the Zeiss Auriga 60 system. Following Pt deposition, done for the protection of the target, specimen preparation was performed using 30 kV Ga+ ions with final polishing at 5 and 2 kV to reduce beam damage. An 〈110〉 zone axis for the purpose of twin observation was achieved by selecting a suitable position and orientation of the twin lamella by EBSD before lift-out as described elsewhere.Reference Kauffmann, Freudenberger, Klauß, Klemm, Schillinger, Sarma and Schultz33 Specific heat of the CoCrFeMnNi alloy in the temperature range of 103 K to about 1300 K was determined using a Netzsch DSC 204 setup (Netzsch, Selb, Germany) and the data were extrapolated toward 0 K by means of Debye T 3-dependence. Corresponding details are described elsewhere.Reference Haas, Mosbacher, Senkov, Feuerbacher, Freudenberger, Gezgin, Völkl and Glatzel34 Thermal conductivity of the CoCrFeMnNi alloy was taken from Ref. Reference Jin, Sales, Stocks, Samolyuk, Daene, Weber, Zhang and Bei35. For reference, specific heat of pure Cu was determined using a Quantum Design PPMS 9T system (Quantum Design Inc., San Diego, California) with heat capacity option and calibrated sample holder. Grease Apiezon N (M&I Materials Ltd., Manchester, U.K.) was used as the contact medium for measurements in the temperature range of 4.2–310 K. The data were interpreted based on the description in Ref. Reference Hwang, Lin and Tien36. Thermal conductivity of pure Cu was determined by the axial heat flow method using a Quantum Design PPMS (Quantum Design Inc., San Diego, California) with thermal transport option in the steady-state measurement mode. The details are described elsewhere.Reference Bagrets, Goldacker, Schlachter, Barth and Weiss37
C. Mechanical testing
Tensile tests have been performed at room temperature (295 K), 77, 8, and 4.2 K at Cryogenic Material tests Karlsruhe (CryoMaK, KIT), the process for which is described elsewhere.Reference Sas, Weiss and Bagrets38 The tensile test specimens had M6 connecting threads, a total length of 45 mm, a uniform length of 22 mm, a transition radius of 10 mm, and a gauge diameter of 4 mm. For investigation of serrated plastic flow, additional test specimens with a reduced gauge diameter of 2 mm were used (transition radius is about 6 mm). The uniform length was ground and polished (3 µm, 1 µm, OP-S) to avoid additional effects from the surface topography on the serrated behavior. Furthermore, the recrystallization treatment (see Sec. II.A) was performed after machining and polishing to remove deformed surface layers.
Tensile testing was performed to fracture with constant crosshead movement corresponding to a mean plastic strain-rate of 3 × 10⁻⁴ s−1 under standard conditions according to ASTM E8M using a sampling rate of about 10 Hz. Additional strain-rates (6 × 10⁻⁵ and 1 × 10⁻³ s−1) were used for the investigation of serrated plastic flow. Furthermore, two interrupted tensile tests at 77 and 8 K were performed for the evaluation of microstructure evolution during deformation. The strain was obtained using two 20 mm strain gauges attached to the samples. Work-hardening was determined subsequent to smoothening of the obtained stress and strain data by using moving mean value calculations in proprietary software package Origin 2018 by OriginLab (Northampton, Massachusetts). In the case of serrated plastic deformation, work-hardening was exclusively determined from the maxima of the serrations. The quantitative analysis of the serrations was automatically performed by the use of a self-programmed Matlab script which is based on a peak search algorithm and analyzing the time-depending datasets.
III. RESULTS AND DISCUSSION
A. Materials
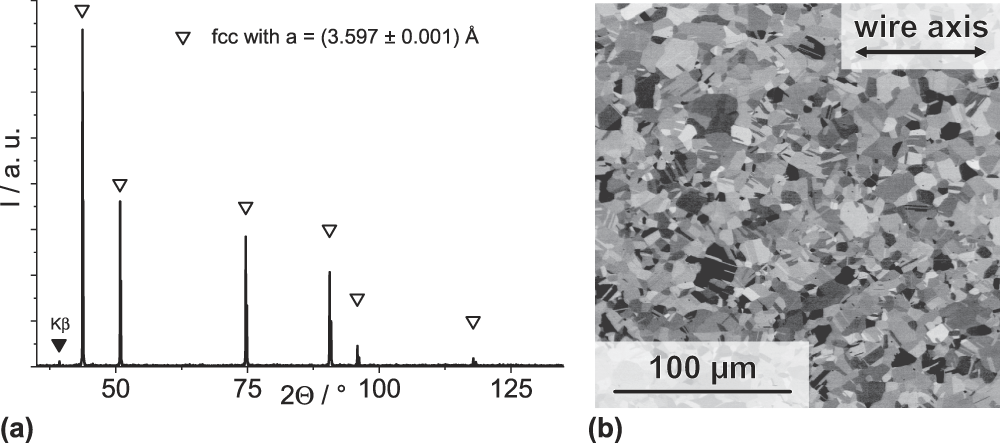
For the preparation of the investigated material, the well-documented production route as has been reported by several groups was adoptedReference Otto, Dlouhý, Somsen, Bei, Eggeler and George10,Reference Bhattacharjee, Sathiaraj, Zaid, Gatti, Lee, Tsai and Yeh39–Reference Smith, Hooshmand, Esser, Otto, McComb, George, Ghazisaeidi and Mills44 : (i) arc-melting for the initial preparation of the alloy, (ii) subsequent homogenization treatment, (iii) cold-working (by rotary swaging up to a true strain of about 1.4), and finally (iv) static recrystallization. The obtained material has an fcc, Cu-type crystal structure as shown in Fig. 1(a) and the microstructure shown in Fig. 1(b) consists of grains of approximately 7–9 µm in size (recrystallization twins are considered as grain boundaries). Due to the prior etching of Mn and O2 gettering by Zr remelting, only tiny amounts of residual oxides and sulfides are found in the material (below 0.1 vol% by image analysis of secondary electron images). Furthermore, the as-recrystallized microstructure is dominated by recrystallization twins as a result of the low SFE of CoCrFeMnNi. Atom probe tomography studies (not shown here) reveal the chemical homogeneity of the samples under investigation, down to an atomic length scale.
(a) XRD pattern and (b) BSE micrograph (orientation contrast) of the as-recrystallized microstructure of CoCrFeMnNi.

B. Mechanical characterization
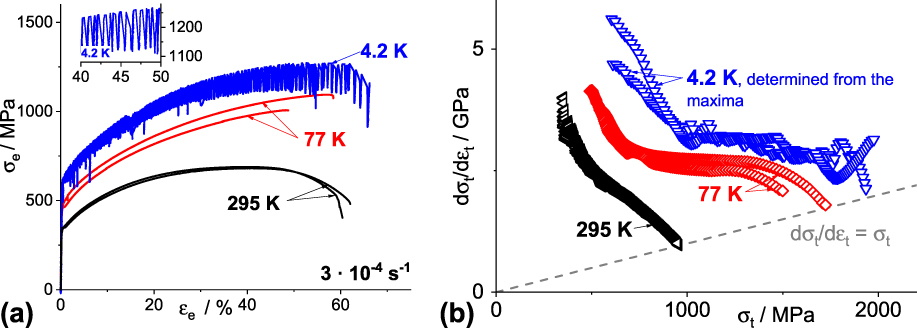
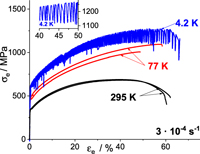
Figure 2 summarizes the tensile test results of CoCrFeMnNi at room temperature, 77, and 4.2 K in the form of engineering stress–strain curves [Fig. 2(a)] and true work-hardening with respect to true stress [Fig. 2(b)]. The following conclusions could be drawn: (i) The yield and ultimate tensile strength increase with decreasing temperature. (ii) Ductility remains high even at the lowest testing temperature of 4.2 K. (iii) Deformation appears serrated/discontinuous at 4.2 K. The former two results are in accordance with the published studies of Otto et al.Reference Otto, Dlouhý, Somsen, Bei, Eggeler and George10 and Laplanche et al.Reference Laplanche, Kostka, Horst, Eggeler and George17 and are consistent with the very high fracture toughness values observed at 77 K by Gludovatz et al.Reference Gludovatz, Hohenwarter, Catoor, Chang, George and Ritchie11 At room temperature, a rapidly decreasing work-hardening behavior is observed until the end of uniform elongation [Considère criterion depicted by the gray dashed line in Fig. 2(b)] is reached and necking occurs. Under these conditions, Otto et al.Reference Otto, Dlouhý, Somsen, Bei, Eggeler and George10 revealed that planar slip takes place on  $\left\langle {1\bar{1}0} \right\rangle \left\{ {111} \right\}$ systems. For tensile tests at 77 and 4.2 K, a pronounced plateau with a high level of work-hardening is observed at intermediate plastic strain. This plateau of sustained stable work-hardening ensures a higher uniform elongation, i.e., prolongs the strain prior to achieving instability and Considère criterion. Thus, this corresponds to a higher ductility at cryogenic temperature.
Mechanical response of CoCrFeMnNi under tensile load at room temperature, 77 and 4.2 K (two samples each): (a) engineering stress–strain response and (b) true work-hardening behavior. The Considère criterion in (b) is plotted as limiting (gray, dashed) line.

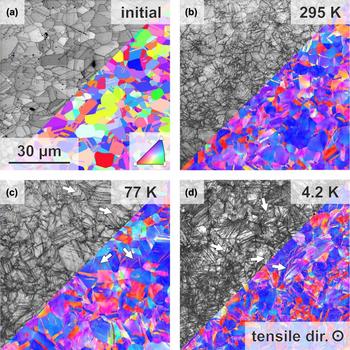
According to their detailed microstructure analyses by TEM on specimens of interrupted tensile tests, Laplanche et al.Reference Laplanche, Kostka, Horst, Eggeler and George17 come to the conclusion that deformation twinning and its contribution to dynamic grain refinement result in the stable work-hardening rate, as deformation twinning is observed over extended strain ranges at low temperatures. This is reasonable considering the Hall–Petch coefficients of CoCrFeMnNi to be 494 and 538 MPa µm1/2 at room temperature and 77 K,Reference Otto, Dlouhý, Somsen, Bei, Eggeler and George10 respectively. Indeed, Fig. 3 clearly reveals the significant impact of deformation twinning on the refinement of the microstructure during tensile deformation at 77 K [Fig. 3(c)] and 4.2 K [Fig. 3(d)] in comparison to the almost deformation twin-free microstructure seen subsequent to tensile testing at room temperature [Fig. 3(b)]. Deformation twins appear very fine (max. 30 nm at 44% tensile strain at 77 K according to Laplanche et al.Reference Laplanche, Kostka, Horst, Eggeler and George17). Thus, a fraction of the deformation twins cannot be correctly indexed by the automatic orientation determination during EBSD given that the twin width is in the order of the probe size. Nevertheless, image quality maps reveal further and thinner twinning sites (examples are indicated by arrows in Fig. 3 in the gray scale part of the images). The appearance of  $\left\langle {11\bar{2}} \right\rangle \left\{ {111} \right\}$ deformation twinning and, therefore, also the extent of dynamic grain refinement expected in fcc, Cu-type metals and alloys strongly depends on its orientation. Therefore, it correspondingly depends on initial texture and texture evolution during deformation.Reference Kauffmann, Freudenberger, Klauß, Schillinger, Sarma and Schultz45 As is typical for recrystallized texture after axisymmetric deformation like wire drawing or rotary swaging, the initial microstructure [Fig. 3(a)] develops weak and broad 〈111〉- and 〈110〉-fiber texture components.Reference Geissler, Freudenberger, Kauffmann, Krautz, Klauss, Voss, Eickemeyer and Schultz21 During the tensile loading of fcc metals, activation of
 $\left\langle {1\bar{1}0} \right\rangle \left\{ {111} \right\}$ slip systems leads to orientation change toward the ideal 〈100〉- and 〈111〉-fiber texture components [red and blue color-coded grains in Figs. 3(a)–3(d), respectively].Reference Kauffmann, Freudenberger, Klauß, Klemm, Schillinger, Sarma and Schultz33,Reference Kauffmann, Freudenberger, Klauß, Schillinger, Sarma and Schultz45,Reference Kauffmann, Freudenberger, Geissler, Yin, Schillinger, Sarma, Bahmanpour, Scattergood, Khoshkhoo, Wendrock, Koch, Eckert and Schultz46 Consequently, a sharp mixture of a minor 〈100〉- and a major 〈111〉-fiber texture component develops as can be seen in Figs. 3(b)–3(d). Typically, the 〈111〉-fiber texture component is the dominant texture component. In the case of tensile loading, deformation twinning is only possible for orientations in the vicinity of 〈111〉-axes or 〈110〉-axes parallel to the loading direction, whereas 〈100〉-oriented crystals/grains do not exhibit deformation twinning.Reference Geissler, Freudenberger, Kauffmann, Krautz, Klauss, Voss, Eickemeyer and Schultz21,Reference Blewitt, Coltman and Redman23,Reference Kauffmann, Freudenberger, Klauß, Klemm, Schillinger, Sarma and Schultz33,Reference Kauffmann, Freudenberger, Klauß, Schillinger, Sarma and Schultz45,Reference Kauffmann, Freudenberger, Geissler, Yin, Schillinger, Sarma, Bahmanpour, Scattergood, Khoshkhoo, Wendrock, Koch, Eckert and Schultz46 Thus, only a fraction of the entire microstructure undergoes the dynamic refinement as a result of deformation twinning. This holds true for the CoCrFeMnNi alloy even at the lowest test temperature of 4.2 K.
Orientation imaging microscopy (orientation by color-coding according to the inverse pole figure of the tensile direction; image quality as gray scale image) on cross sections of (a) the recrystallized initial state; following deformation at (b) room temperature (approx. eng. strain of 35%), (c) 77 K (approx. eng. strain of 47%), and (d) 4.2 K (approx. eng. strain of 57%). All cross sections from deformed samples are taken from the uniform elongation part after fracture. All micrographs have the same magnification.

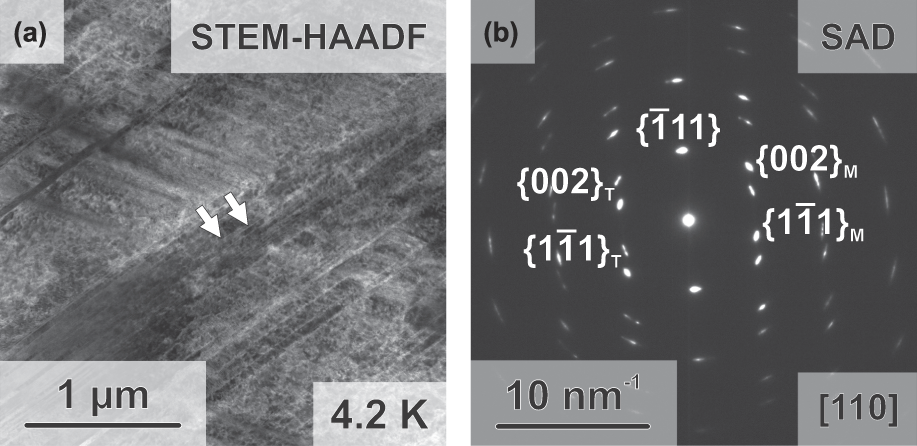
As already mentioned, Huang et al.Reference Huang, Li, Lu, Tian, Shen, Holmström and Vitos13 found a steady decrease in the SFE of CoCrFeMnNi down to below 5 mJ/m2 at 4.2 K. Accordingly, they state, with reference to Allain et al.,Reference Allain, Chateau, Bouaziz, Migot and Guelton14 that ε-martensite formation is likely to be expected. Nevertheless, comprehensive EBSD analyses on the microstructures, shown in Fig. 3(d) (tensile straining at 4.2 K up to about 57% engineering strain), allowing for indexing of the hexagonal ε-phase did not result in finding sufficient indications for its presence. The confidence index (CI) of the ε-phase data points in the EBSD maps are exclusively below 0.1, whereas roughly 80% of all γ-phase data points exhibit CIs greater than 0.1. Moreover, there is no significant correlation between the data points indexed as the ε-phase and positions of localized deformation. The absence of the ε-martensite is further substantiated by TEM-SAD investigations presented in Fig. 4(b). Only twin orientations are observed. Figure 4(a) shows the according microstructure as the STEM-HAADF image.
TEM investigations revealing refinement of the microstructure by mechanical twinning during tensile deformation at 4.2 K: (a) STEM-HAADF image (twin boundaries highlighted by arrows) and (b) TEM-SAD at the respective position highlighting the matrix and twin orientation. No indications for ε-martensite could be obtained.

The absence of ε-martensite in the investigated microstructures can be rationalized in the following ways: (i) Possible recovery of the martensite laths could have occurred during the heating up to room temperature prior to microstructure investigations. Since the microstructure originates from a deformation process at low temperature, complete recovery of athermal or deformation-strain induced martensite seems to be unrealistic. The same line of argumentation can be applied to a possible recovery due to beam damage during FIB lift-out prior to the TEM investigations. (ii) In certain cases, only diffuse stacking fault arrangements are formed by deformation in TWIP/TRIP steels, as observed by Borisova et al.Reference Borisova, Klemm, Martin, Wolf and Rafaja47 These should not be treated as compact aggregates of ε-martensite and would not be identified as such by EBSD.Reference Borisova, Klemm, Martin, Wolf and Rafaja47,Reference Martin, Ullrich, Šimek, Martin and Rafaja48 (iii) According to the reasoning provided in Ref. Reference Geissler, Freudenberger, Kauffmann, Martin and Rafaja49, an intrinsic SFE that is modeled without the introduction of an additionally estimated energy term for the interface energy of austenite and martensite (as has been done in the DFT calculations of Huang et al.,Reference Huang, Li, Lu, Tian, Shen, Holmström and Vitos13 in contrast to a concept for martensite nucleation as introduced by Olson and CohenReference Adler, Olson and Owen50,Reference Olson and Cohen51 ) is essentially determined by the Gibb’s free energy difference between austenite and martensite ΔG γ→ε. Consequently, even though this quantity might be very low, the formation of neither deformation-induced ε-martensite nor athermal ε-martensite is likely for a positive intrinsic SFE. An intrinsic SFE modeled based on a thermodynamic approach, as illustrated in Refs. Reference Allain, Chateau, Bouaziz, Migot and Guelton14 and Reference Saeed-Akbari, Imlau, Prahl and Bleck15, is thus probably an overestimationReference Geissler, Freudenberger, Kauffmann, Martin and Rafaja49 but it is often used to define the TRIP criteria, like in the case of Ref. Reference Allain, Chateau, Bouaziz, Migot and Guelton14. Consequently, in accordance with the presented experimental observations, this concept should not be applied to CoCrFeMnNi. Additionally, ΔG γ→ε has remained uncertain so far. (iv) An overestimation of the temperature-dependence of the chemical contribution to SFE in Ref. Reference Huang, Li, Lu, Tian, Shen, Holmström and Vitos13 would lead to a much lower SFE. The appearance of deformation twinning is, in that case, mainly driven by the increased yield strength seen at cryogenic temperatures and the suppressed dynamic recovery. These two effects can facilitate surpassing the critical stress for twinning with little to no drop in intrinsic SFE at cryogenic temperatures.
C. Initiation of the work-hardening plateau
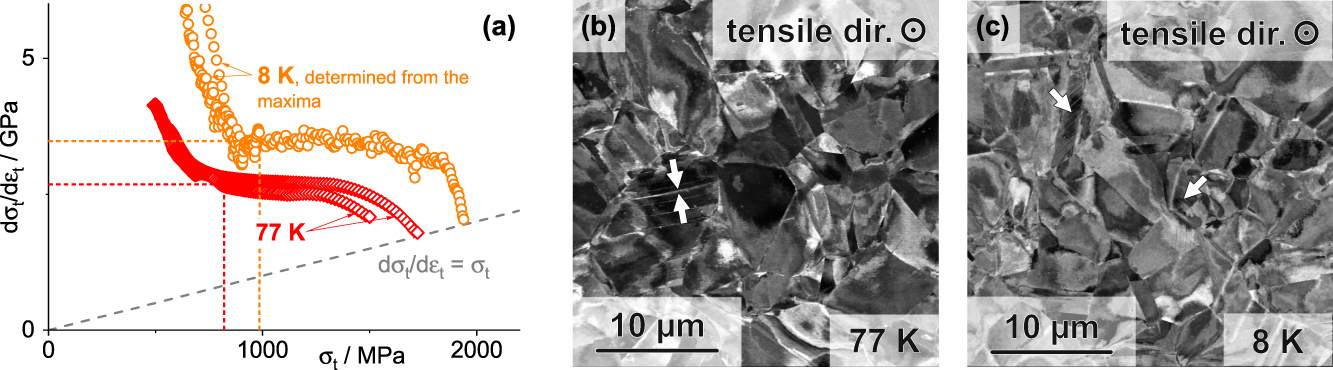
To assess the effect of twinning on the initiation of the work-hardening, we performed interrupted tensile tests with a similar strategy to the one used by Laplanche et al.Reference Laplanche, Kostka, Horst, Eggeler and George17 Figure 5(a) shows the true work-hardening data for tests performed at 77 K (without serrated plastic flow) and at 8 K (with serrated plastic flow, in vacuo). A detailed comparison of 4.2 and 8 K is provided in Sec. III.D. The subsequent tensile tests were interrupted right after the work-hardening plateau was attained, as indicated by dashed lines in Fig. 5(a) (σt = 820 MPa at 77 K and σt = 940 MPa at 8 K). Figures 5(b) and 5(c) show micrographs with BSE orientation contrast of cross sections from these interrupted tensile tests. Mechanical twins are indicated by white arrows in Fig. 5(b). The same is found for deformation at 8 K as well, as shown in Fig. 5(c). Evidently, onset stresses are lower than the interruption (true) stresses of 820 MPa and 940 MPa at 77 K and 8 K, respectively. Onset stress for deformation twinning determined on polycrystals generally has to be considered with some skepticism. The first twins will always appear in the vicinity of stress localization, for example, near triple lines [such as in Fig. 5(b)]. They are dependent on the elastic anisotropy and grain size of the material. Nevertheless, the findings are in accordance with the result by Laplanche et al. for room temperature and 77 K.Reference Laplanche, Kostka, Horst, Eggeler and George17 However, it should be noted that the critical twin stress values of only about 450–500 MPa, as stated in Refs. Reference Abuzaid and Sehitoglu19 and Reference Sun, Tian, Lin, Yang, Dong, Wang and Zhang20, seem to be unrealistic. In the case of the current tensile tests, stress increases from about 500 MPa up to the interruption point, corresponding to about 25% additional straining. Despite this, we see a scarcity of twins formed in consideration of the volume fraction of preferred grains (〈111〉 oriented with respect to the loading axis). Thus, it is debatable whether the initial deflection of the work-hardening rate toward the plateau value [Fig. 5(a)] is caused by the dynamic refinement effect of mechanical twinning. Only a minor (negligible) fraction of the entire microstructure is refined by deformation twinning. Of course, the probe size of backscattered electrons is rather big in comparison to TEM investigations in general. Nevertheless, the present images are based on a BSE diffraction contrast and the diffraction condition of grains which appear black is already changed by thin twin lamellae which are smaller than the actual probe size. Other reasons for deflection from the continuously decreasing trend than deformation twinning have to be discussed. For example, orientation hardening which takes place by rapid fiber texture development might play an important role here. While Schmid factor is high for single slip throughout the standard triangle, Schmid factor of the developing 〈111〉-fiber texture component (major component) is comparatively lower, with a value of only 0.272. Thus, flow stress naturally increases due to texture development.
Summary for tensile test interrupted at the beginning of the plateau: (a) True work-hardening response at 77 K (no serrated plastic flow) and 8 K (serrated plastic flow). Considère criterion is shown as gray, dashed line. (b) and (c) represent cross section micrographs with orientation contrast and mechanical twins highlighted by arrows (field of view is reduced to visualize the twins; probed volume is significantly larger without additional twins).

D. Serrated plastic flow
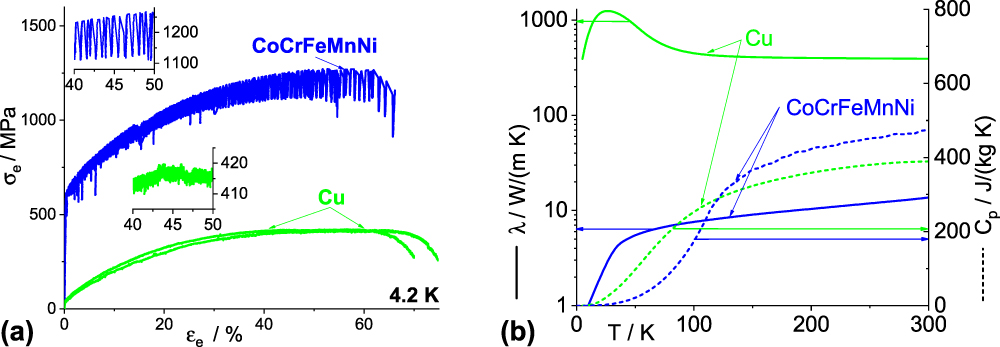
As already mentioned, plastic deformation of CoCrFeMnNi appears serrated at 4.2 K. To compare with a well-investigated material, the tensile test response of pure, recrystallized Cu is shown in Fig. 6(a) under the same experimental conditions and using exactly the same sample dimensions.
(a) Comparison of the tensile deformation behavior at 4.2 K of pure Cu and CoCrFeMnNi (two samples for each material) and (b) comparison of low temperature thermal conductivity and heat capacity of pure Cu, CoCrFeMnNi. Thermal conductivity of CoCrFeMnNi is taken from Ref. Reference Jin, Sales, Stocks, Samolyuk, Daene, Weber, Zhang and Bei35. Heat capacity at high temperature is taken from Ref. Reference Jin, Mu, An, Porter, Samolyuk, Stocks and Bei52. The dashed lines represent the specific heat capacity, while the solid lines represent the thermal conductivity. Insets in (a) show serrations in detail.

A striking difference is observed between the stress–strain curves of the HEA and Cu. The serrated plastic flow turns out to be much more pronounced in the case of the HEA: stress serration amplitude approaches 150 MPa in the case of the HEA as opposed to approx. 5 MPa in the case of pure Cu. At first glance, a strong impact of the solid solution is expected from that experimental result. However, the differences should not be overestimated by not considering all extrinsic and intrinsic factors involved in serrated plastic flow. The two materials possess distinctly different mechanical properties, namely yield strength, ultimate tensile strength, and work-hardening properties, since the underlying deformation mechanisms are different. When considering factors directly related to the serrated plastic flow—assuming significant extrinsic influences—the thermal conductivity and specific heat have to be considered as well. Figure 6(b) provides an overview (from our own measurements as well as from the literature) of thermal conductivity and heat capacity at low temperature for pure Cu and CoCrFeMnNi (heat capacity extrapolated using a T 3-dependence from slightly above 105 to 0 K). Both thermal conductivity and heat capacity typically drop at very low temperature. Thus, the adiabatic heating effect and the associated thermomechanical instability have to be taken into account when assessing the serrated plastic flow. It should be noted that while thermal conductivity of pure Cu in comparison to the alloy differs by several orders of magnitude, heat capacity of both materials is similar.
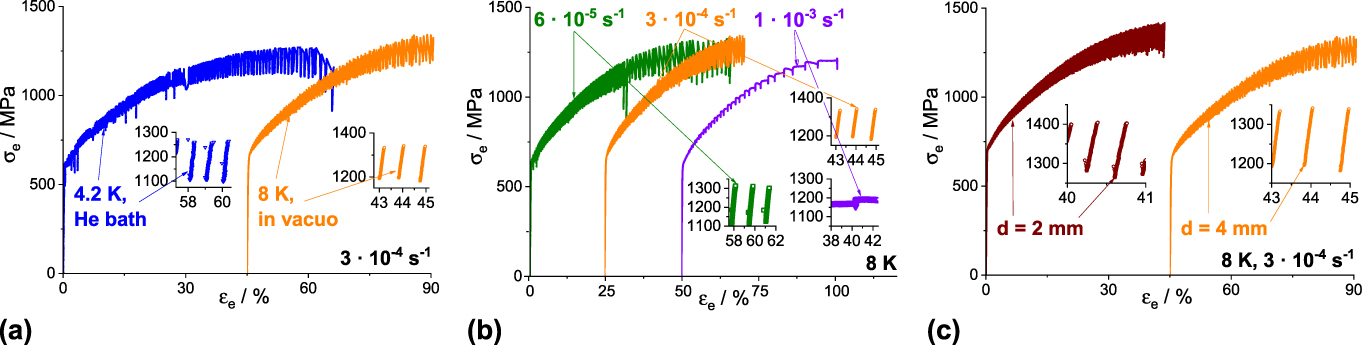
Additional experiments are thus necessary to quantitatively describe the appearance of serrations in CoCrFeMnNi as well as provide further insight into the nature of these serrations. Three sets of experiments were performed and are described in the following section: (i) The first set is a comparison of tensile tests performed in two different cryostats. In the first case, the sample was placed in a liquid He bath at 4.2 K. In the second case, the sample was placed in a vacuum cryostat cooled by gaseous He at 8 K. The sample dimensions (4 mm diameter) and the applied strain-rate (3 × 10⁻⁴ s−1) were kept constant for these experiments and two samples were tested for each condition. A significantly altered coupling to the cooling medium is to be expected in the case of thermomechanical instability of the tests. (ii) The second set of experiments consisted of three tensile tests at three different strain rates of 6 × 10⁻⁵, 3 × 10⁻⁴, and 1 × 10⁻³ s−1. The nominal test temperature (8 K) and sample dimensions (4 mm diameter) were kept constant; the tests were performed in the vacuum cryostat. Possible changes of the intrinsic deformation mechanisms as well as an altered interplay of thermal softening and coupling of the sample with the coupling medium is expected here. (iii) The final set of experiments is the deformation of samples with varying gauge diameters, namely 2 and 4 mm. The nominal test temperature (8 K) and the applied strain-rate (3 × 10⁻⁴ s−1) were kept constant; the tests were performed in the vacuum cryostat. Two samples were tested for each dimension. The interrupted tensile test at 8 K in Fig. 5 is used for the quantitative description of the serrations as well. The resulting engineering stress–strain curves of the three sets of experiments are summarized in Fig. 7. In the insets, examples of the appearing serrations are displayed. For better visibility of the serrations, only one curve is plotted per condition even though multiple trials were performed.
Engineering stress–strain curves of CoCrFeMnNi comparing (a) 4.2 K versus 8 K using different cryostats, (b) strain rates of 6 × 10⁻⁵, 3 × 10⁻⁴ versus 1 × 10⁻³ s−1, and (c) samples with 2 versus 4 mm gauge diameters.

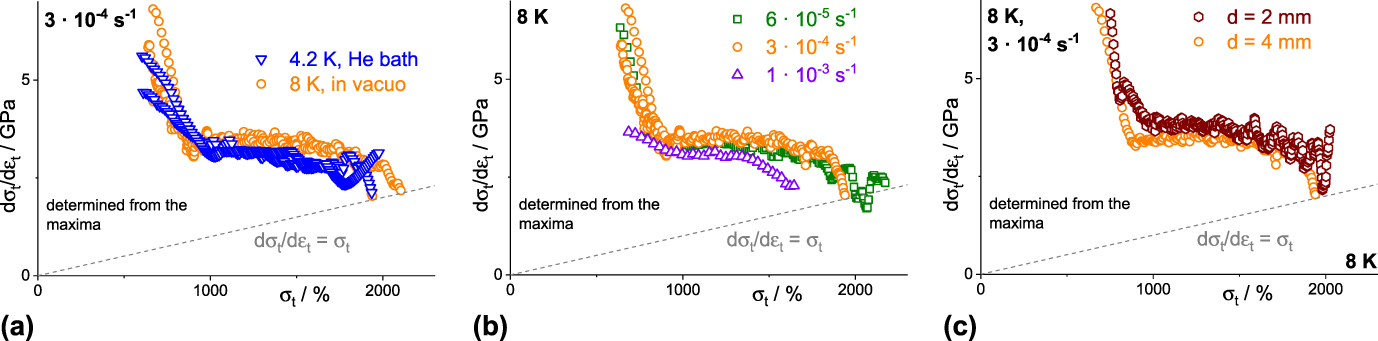
Before detailed (quantitative) characterization of the serrated plastic flow, the mechanical behavior and underlying mechanisms were investigated, in correspondence with the above mentioned changes of the experimental conditions. Despite the differences observed in the various stress–strain curves, the work-hardening behavior was similar in all cases as shown in Fig. 8. It has to be mentioned that for the evaluation of the work-hardening behavior, only stress maxima were considered. If temperature spikes appear during deformation, the stress maxima might correspond to the nominal test temperature under certain circumstances. The work-hardening curves essentially remain similar for all tested conditions, indicating that the underlying deformation mechanisms in all cases are the same or similar. Accordingly, the formerly discussed work-hardening plateau consistently appears under all conditions. Only in the case of the highest strain-rate of 1 × 10⁻³ s−1, the lower number of stress maxima leads to a determined work-hardening behavior that is not as reliable as in the other cases shown here.
Work-hardening curves of CoCrFeMnNi (true work-hardening versus true stress) comparing (a) 4.2 K versus 8 K using different cryostats, (b) strain rates of 6 × 10⁻⁵, 3 × 10⁻⁴ versus 1 × 10⁻³ s−1, and (c) samples with 2 versus 4 mm gauge diameters. Order and representation of the experimental conditions are the same as in Fig. 7.

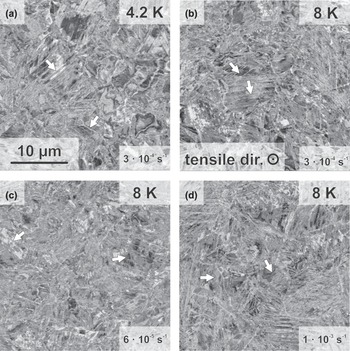
The similar deformation mechanisms established by the work-hardening curves was further verified by the microstructure post fracture. Figure 9 shows the micrographs of cross sections from the uniform parts of the fractured samples deformed in different cooling media [Figs. 9(a) and 9(b)] and at different strain rates [Figs. 9(b)–9(d)]. In all cases, significant dislocation activity (varying orientation contrast within the grains) and deformation twinning (indicated by arrows) can be observed. Nevertheless, the overall appearance and twin density seems to be comparable in all cases. Especially in the high strain-rate case, twin density is not significantly increased which might have been expected under these conditions.
Micrographs post fracture of sample deformed: (a) at 4.2 K and a strain rate of 3 × 10⁻⁴ s−1, (b) at 8 K and a strain rate of 3 × 10⁻⁴ s−1, (c) at 8 K and a strain rate of 6 × 10⁻⁵ s−1, and (d) at 8 K and a strain rate of 1 × 10⁻³ s−1. The arrows highlight deformation twins. The magnification is the same for each micrograph.

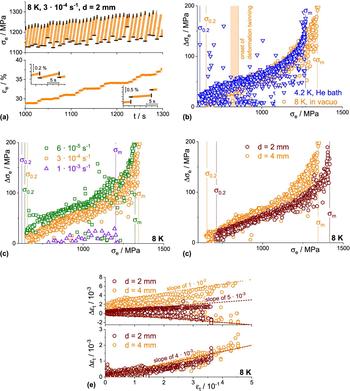
Considering that both the work-hardening behavior and the final microstructures, under the various conditions remain the same, the varying serration behavior can be discussed, as is done in the following part. To identify the individual events, time evolution of stress and strain during the tests was analyzed. As an example, Fig. 10(a) depicts a section of the serrations in a sample of 4 mm in diameter tested at a strain rate of 3 × 10⁻⁴ s−1 and 8 K in the vacuum cryostat. The shortest, repetitive events are stress drops which are indicated by vertical (maxima) and horizontal (minima) bars followed by periods of increasing stress. The stress drops typically occur very fast in about 0.1 s. Quantitative comparisons of the stress drop magnitude (Δσe) as a function of applied stress (σe) are shown for each experiment in Figs. 10(b)–10(d). Following yielding (σ0.2), an almost linear dependence on the applied stress is observed up to intermediate plastic strains. However, shortly before attaining ultimate tensile strength (σm), a slight deflection toward larger stress drops is observed. As has been pointed out before, the stress level for the initiation of deformation twinning has already been surpassed [shaded area in Fig. 10(a)]—accordingly deformation twinning does not affect the serration behavior. Even though cooling conditions were significantly altered by using two types of cryostats, no significant change of this general trend of Δσe versus σe is observed. However, scatter is considerably larger in the case of the liquid He cooling. Similar trends are also observed in the case of the two lower strain-rates and varying gauge diameters. As expected from the significantly different stress–strain curve, fast straining at 1 × 10⁻³ s−1 leads to significantly lower stress drop magnitudes. In addition, macroscopic stress drops under this condition take much longer than the mentioned 0.1 s. In summary, the stress drop magnitude seems to be a viable quantity of the serration behavior under most experimental conditions tested in this study. There seems to be an upper limit of strain-rate for consistent appearance of stress drops.
Analysis of the serration behavior: (a) example illustration of the evolution of engineering stress and strain over time of a sample with 4 mm in diameter tested at a strain rate of 3 × 10⁻⁴ s−1 and 8 K in the vacuum cryostat. (b) to (d) Magnitude of stress drops Δσe as a function of stress σe (both engineering). Order and representation of the experimental conditions is as in Figs. 7 and 8. Both yield strength σ0.2 and ultimate tensile strength σm are indicated as dashed lines. (e) True strain changes Δεt occurring during the stress drops (upper part) and occurring during the stress rise (lower part) as a function of total true strain εt for the experiments performed with different gauge diameters.

During the stress drops, total strain of the samples changes in two different ways. As an example, the upper part of Fig. 10(e) shows the true (to preserve additivity) strain changes (Δεt; strain at stress maximum minus strain at stress minimum) associated with each stress drop as a function of true strain (εt) for the samples with varying gauge diameters. The first type of strain change is negative and has small absolute magnitude which increases with increasing applied stress and strain. At the maximum stress drops of about 210 MPa, total true strain decreases by only about 1.8% from its former value, which might be related to (partial) elastic unloading of the sample during the stress drop. A quantitative description based on the elastic properties of the material is difficult due to the scatter as well as small magnitude of stress and strain change during these events. Nevertheless, this finding has important consequence for future analysis of serrated plastic flow since these stress drops cannot be identified using just the stress–strain response of the material—the serrations virtually appear at the same small strain increment and correspond to an elastic unloading and reloading. In contrast to the negative strain changes during the stress drops, there are periods during the test where the sample macroscopically elongates during the stress drops. While the negative strains in Fig. 10(e) are similar for the samples of different gauge diameters (this holds true for all other experiments as well with the exception of the high strain rate test; not shown here), the positive strain jumps are considerably larger in their absolute magnitude and differ by a factor of about two for the two tested gauge dimensions. The third type of strain change occurs in the time period between two stress drops: strain increases here in all cases. The amounts of strain covered in these periods are similar for the different gauge diameters as well, as shown in Fig. 10(e) (lower part) while the periods for the 2 mm sample are considerably shorter when compared to the 4 mm sample (in total 508 versus 314 of these periods are observed). Furthermore, the strain change is in a similar range as the presumably elastically caused unloading strains discussed above.
In the framework of an extrinsic theory, the serrated plastic flow is mostly driven by the thermomechanical instability of the test: It is assumed that local plastic deformation leads to an adiabatic heating of the sample which leads to a decreasing flow stress of the material.Reference Basinski24,Reference Basinski53 The stress accordingly decreases and significant plastic straining is observed. In the present investigation, most of the stress drops are, in contradiction to this extrinsic theory, not associated with a significant plastic deformation. Only few of the stress drops are associated with a macroscopic—most probably plastic—elongation of the sample. An additional indication which contradicts this simple picture of decreasing flow stress with increasing temperature is the often observed nonmonotonic dependence of strength with temperature in fcc metals and substitutional solid solutions at very low temperatures (temperature range is dependent on the material).Reference Parkhomenko and Pustovalov54 In some cases, a maximum strength occurs at a certain temperature, below which the strength decreases.Reference Parkhomenko and Pustovalov54 Multiple proposed models have been attributed to this anomaly, mainly in relation to thermal activation becoming less important and dynamic effects (e.g., due to a reduction of the dynamic drag constant in the equation of motion of dislocations) more essential for dislocation motion.Reference Parkhomenko and Pustovalov54 In the case of extrinsically driven serrations, the temperature of maximum strength has to be surpassed by the adiabatic heating to cause the stress drop. In the present investigations, indeed a lower yield strength is observed for the tests at 4.2 K in comparison to 8 K. Nevertheless, it should be mentioned that two different batches had to be used for these tests. Thus, further verification of these findings using unique batch material is necessary.
From the observations mentioned above, it is first clear that stress drops consistently appear similar during the entire test while the associated strain changes vary. Accordingly, all stress drops might be caused by one and the same phenomenon. For the strain changes, at least two different processes have to be distinctly considered. It has been stated previously that stress drops are the result of a dislocation avalanche movement subsequent to overcoming an obstacle of some sort. From the above shown experiments, it is not obvious why the associated strain change remains so small. This might be related to a strong localization of the individual events, which macroscopically counteracts the elastic unloading of the rest of the sample by the stress drop. The second type of strain change where the sample macroscopically elongates might also be triggered by dislocation avalanche motion, but in addition be associated with the movement of a band of localized deformation. That heating of the sample occurs during testing is without doubt shown in the literature.Reference Pustovalov22 Nevertheless, the timescales of the stress drops [time-scale in Fig. 10(a) and magnitudes in Figs. 10(b)–10(d)] and obvious plastic strain changes [time scales in Fig. 10(a) and magnitudes examples in Fig. 10(e)] do not support a strong impact of the heating or even a possible thermal softening for the present investigations. This might be different for the highest strain-rate presented in this publication since obviously the characteristics and time-scale for stress drops are completely different from all other tests. Future experiments have to definitively incorporate different kinds of temperature measurement techniques and additional methods of strain evaluation in addition to the proposed time-dependent analysis of stress and strain. Nevertheless, all data have to be interpreted on the basis of the time evolution over extended strain ranges to cover all types of individual events.
IV. CONCLUSIONS
In this contribution, we report on the mechanical response of CoCrFeMnNi HEA during tensile testing at temperatures ranging from room temperature down to 4.2 K. The following characteristics were observed:
(1) Yield strength increases while ultimate tensile strength increases even more with decreasing temperature. This is associated with a pronounced plateau of the work-hardening at intermediate stress level. The work-hardening plateau is reasoned by a dynamic refinement of the microstructure by mechanically formed twins. Nevertheless, only few twins appear at the initial stage of the plateau and deformation twinning does not seem to be responsible for the initial deflection of the work-hardening curve. Instead, lowering the Schmid factor of the operating slip systems might contribute significantly to the work-hardening.
(2) No significant indications for the formation of ε-martensite can be found using either EBSD or TEM-SAD.
(3) Deformation appears serrated/discontinuous at very low temperatures. The quantitative, time-, stress-, and strain-dependent analysis of the serrations yield the following results: (a) Stress drops consistently appear within short time and two types of associated strain changes of which one is slightly negative, whereas the other one corresponds to a significant elongation of the sample. (b) Between two drops, a rising period of stress is observed where strain is only slightly increasing. The influence of thermal softening by adiabatic heating of the sample seems to be small when considering the time scales involved.
ACKNOWLEDGMENTS
Financial support by the Deutsche Forschungsgemeinschaft (DFG) within the framework of the Priority Program “Compositionally Complex Alloys—High-Entropy Alloys (CCA-HEA)” (SPP 2006; grants no. KA 4631/1-1, WE 6279/1-1 as well as HE 1872/34-1) is gratefully acknowledged. AK thanks the Carl Zeiss Foundation for financial support in the form of a postdoc grant. The authors acknowledge the chemical analysis by ICP-OES conducted at the Institute for Applied Materials (IAM-AWP), Karlsruhe Institute of Technology (KIT). This work was partly carried out with the support of the Karlsruhe Nano Micro Facility (KNMF, www.knmf.kit.edu), a Helmholtz Research Infrastructure at Karlsruhe Institute of Technology (KIT, www.kit.edu). The authors thank Nadezda Bagrets, Stephan Laube, and Marten Swetik for experimental support.