Introduction
The ability to discriminate objects from their background on the basis of color contrast may well have been a primary driving force for the evolution of color vision in lower vertebrates (Walls, Reference Walls1963). However, very few studies of color contrast in vertebrate retinas have been reported. Recently, recordings of a local field potential of the inner retina yielded suggestive evidence for the encoding of color contrast in the absence of overt color opponency in zebrafish (Burkhardt, Reference Burkhardt2012). However, the significance and generality of these findings for vertebrate color vision are open to question since the properties of color coding in the zebrafish inner retina are largely unknown. Here, the question of color contrast is pursued in the goldfish retina since there is a wealth of neuronal evidence for color processing in goldfish (reviewed in Toyoda & Shimbo, Reference Toyoda, Shimbo, Toyoda, Murakami, Kaneko and Saito1999; Roberts & Loop, Reference Roberts and Loop2004) and particularly, for overt color opponency in color-coded ganglion cells (Wagner et al., Reference Wagner, MacNichol and Wolbarsht1960; Abramov & Levine, Reference Abramov and Levine1972; Beauchamp & Daw, Reference Beauchamp and Daw1972; Spekreijse et al., Reference Spekreijse, Wagner and Wolbarsht1972; Shefner & Levine, Reference Shefner and Levine1979; Macy, Reference Macy1981; Bilotta & Abramov, Reference Bilotta and Abramov1989; Vallerga & Djamgoz, Reference Vallerga and Djamgoz1991), including a subset of double-opponent ganglion cells responding to simultaneous color contrast (Daw, Reference Daw1967, Reference Daw1968).
Intracellular recordings from the inner goldfish retina were very unsatisfactory, despite the use of well-developed intracellular techniques (e.g., Burkhardt & Fahey, Reference Burkhardt and Fahey1999). Extracellular recordings from isolated retina preparations were not pursued in view of the uncertainties and lability of such preparations (Abramov & Levine, Reference Abramov and Levine1972). In contrast, the present report will show that a local extracellular field potential, the proximal negative response (PNR), provides a very sensitive and stable response in the intact retina preparation, thereby opening the way for quantitative study of color contrast encoding in the inner retina. Three hypotheses were considered: (1) That color contrast might be expressed via spectrally opponent signals. (2) That color contrast might be absent or very weak due to the dominance of spectrally non-opponent input at the level of the PNR. (3) That color contrast might be well developed without overt spectral opponency.
The essential approach was designed to distinguish responses to color contrast from those due only to achromatic contrast. By systematically varying the irradiance of a moving green bar to compare the response on red versus green backgrounds, it was found that the quantitative properties of the irradiance/response curves were distinctly different. This essential difference was confirmed under a range of conditions in a total of 32 retinas, yielding robust evidence for encoding of red/green color contrast. Bursts of small impulses from on/off neurons were routinely observed riding on, and varying with, the peaks of the PNR.
It is concluded that the color contrast encoding revealed in the present report is based on successive color contrast evoked by moving edges, occurs in the absence of overt color opponency, and clearly differs from previous findings in the goldfish retina for large field simultaneous color contrast mediated by color-opponent neurons (Daw, Reference Daw1967, Reference Daw1968). The quantitative results further suggest that the successive color contrast is functionally most important when achromatic contrast is low, as often occurs in natural environments.
Materials and methods
Goldfish (Carassius auratus) were obtained from commercial sources. Small fish about 6–7 cm standard length were preferred since the vitreous was less viscous and the smaller eye was easier to flatten (see below) compared with larger fish. Animals were anesthetized with a 0.05% solution of MS222 for 5–10 min prior to decapitation and pithing in accordance with a protocol approved by the IACUC of the University of Minnesota. The surgical procedure, performed under room light on light-adapted fish, was identical to that described in detail previously (Burkhardt, Reference Burkhardt2012) except the eye was not immersed when making radial cuts and flattening the retina. The retina was placed vitreal side up in the recording chamber. The intact retina preparation is used exclusively in the present report in contrast to isolated retina preparations used in most previous work in goldfish. The retina was superfused at about 1 ml/min with Ringers solution at room temperature (20–23°C.) The Ringers solution was composed of (in mM): 111 NaCl, 22 NaHCO3, 2.5 KCl, 1.5 MgCl2, 1.5 CaCl2, and 9 dextrose. The pH was regulated at about 7.5 by bubbling the superfusate with 98% O2 and 2% CO2. The retina typically remained in good physiological condition for 5 h or more.
Intraretinal recordings were made with glass micropipettes, pulled on a patch electrode puller to a tip dimension of 2–4 µm and then filled with Ringer solution. Electrodes had resistances ranging from about 2 to 5 Mohms. Recordings were digitized for analysis (band pass: 0 to 225 Hz). Baseline signal/noise was improved by a noise eliminator (“HumBug”; Quest Instruments, North Vancouver, BC, Canada) without distorting the response. Signal averaging was not used. All responses and plots in this report are representative and based on single measurements. White light stimuli were generated by an active-matrix liquid crystal display that was controlled by custom software. Steps of achromatic contrast of variable magnitude and optimal spatial dimensions were applied on a 2-mm background field of 200 cd/m2. The stimulus position could be varied in discrete steps of 15 µm and the diameter of circular spots in 10 discrete steps from 45 to 2000 µm. Stimuli were brought into sharp focus on the retina. Achromatic contrast is specified as the logarithm of the contrast ratio, defined as log10(S/B), where S is the retinal illuminance during the step and B is the background illuminance. Thus, steps that increase or decrease the background light level by the same factor differ only in sign: for example, 2× increases and 2× decreases are specified as contrasts of +0.3 and −0.3, respectively. For detailed discussion and advantages of this contrast metric, particularly for negative contrast, see Fahey and Burkhardt (Reference Fahey and Burkhardt2001).
For color contrast experiments, a Mitsubishi projector (MT 830; Mitsubishi Electric Corporation, Irvine, CA) with modified optics and custom software was used to generate green moving bars of variable irradiance on a red or green background field of 2000 µm in diameter. The bar was 1 mm long by 200 µm wide and moved in the direction of the axis of the long dimension over a track of about 2 mm at a velocity of 660 µm/s. A broadband filter (Kodak Wratten #58, 538 nm dominant wavelength) was inserted in the projector output to bring the irradiances of red and green backgrounds into approximate physiological equivalence, as discussed further in Results section. The spectral distributions were measured with a radiometer at the plane of the retina in 10 nm steps. The green light had a peak output at 550 nm, with half-bandwidth points at 544 and 555 nm and 1/10th bandwidth points at 527 and 579 nm. The red light had a peak output at 595 nm, with half-bandwidth points at 584 and 619 nm and 1/10th bandwidth points at 552 and 707 nm. The irradiance of the green bar was varied over a range of about 1.5 log units under computer control without producing significant changes in the spectral distribution. The overall irradiance level of the display was set by neutral metallic filters that kept the spectral distributions unaltered. Irradiance was directly measured at the plane of the retina in units of µW/cm2, as is appropriate for broadband lights and will be so specified throughout the subsequent text. A calculation of approximate photons levels is given in the legend of Fig. 4.
Results
Basic properties of the PNR of the goldfish retina
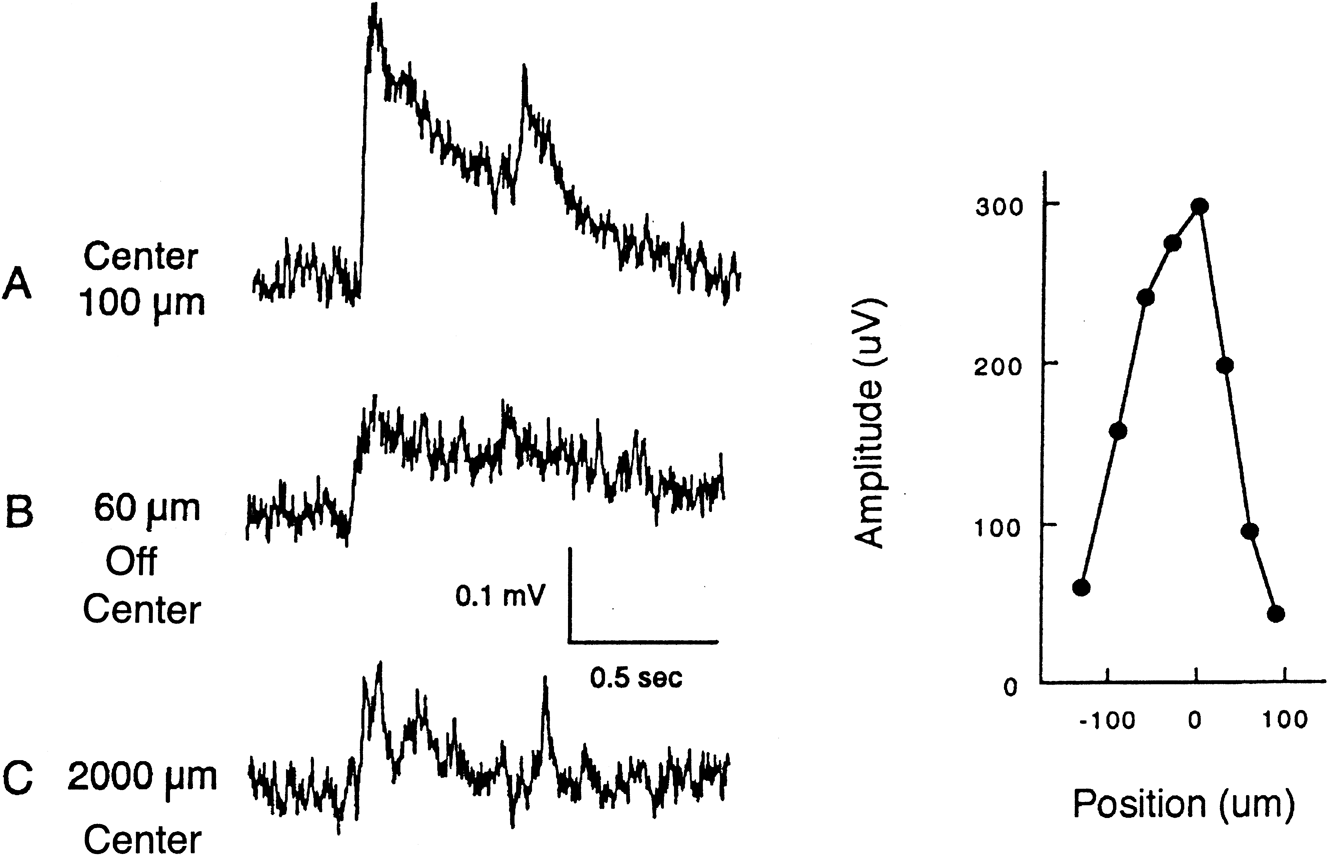
The basic properties of the PNR were similar to those described previously in other vertebrates (reviewed in Burkhardt, Reference Burkhardt2012). The response of largest amplitude was obtained by advancing the electrode into the proximal retina and stimulating with a small critically positioned spot of light (100–250 µm in diameter). Thus, as shown in Fig. 1, the vigorous response evoked by a 100 µm spot of white light is much reduced when the spot is displaced by only 60 µm or increased in diameter to 2000 µm.
Effect of stimulus position and size on the PNR. A. Response to an optimally centered spot of 100 µm diameter and 0.5 s duration for a contrast step of −0.15 of white light. B. Response to the same spot in A but displaced 60 µm from center. C. Response to a 2000 µm centered spot of −0.15 contrast. Graph at right: Peak amplitude to the spot of 100 µm diameter as a function of spot position. Measurements are from a series of single responses including the two top traces, A and B, of Fig. 1. The background for all responses is 200 cd/m2 and 2000 µm in diameter. Recording bandwidth: 0 to 225 Hz.

Responses to achromatic contrast steps of white light
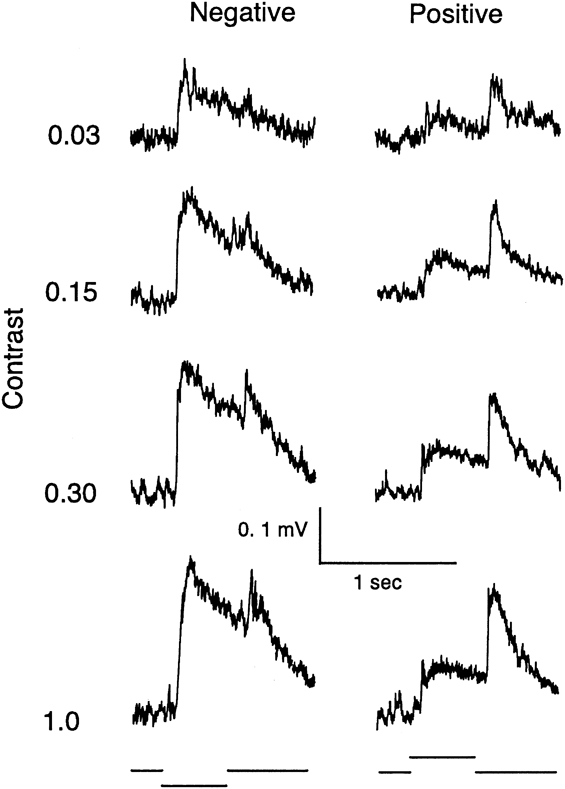
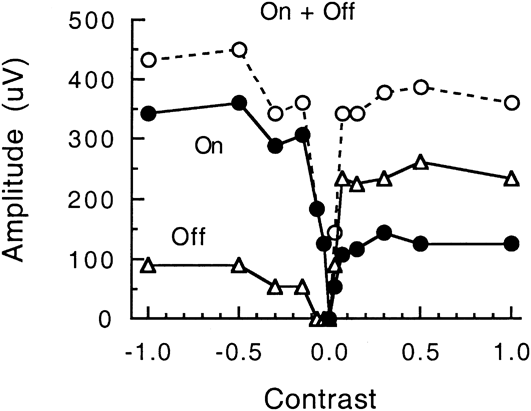
All results in this report were obtained with the electrode advanced to an optimum depth for recording a PNR of maximum amplitude, approximately 30 µm from the retinal surface and thus in a region near the proximal part of the inner nuclear layer. Fig. 2 shows representative responses to steps of negative and positive contrast of white light for a small optimally positioned spot of 100 µm in diameter. The responses were analyzed quantitatively based on measurements of the peak amplitude of the ON and OFF responses as a function of the magnitude of the contrast step. Fig. 3 shows a representative example. The curve for the ON response (filled circles) is quite asymmetrical and thus negative contrast dominant, reaching a maximum amplitude that is about 3× greater for negative than for positive contrast. The OFF response (open triangles) shows the reverse asymmetry. The maximum OFF response to negative contrast is smaller than that to positive contrast. The sum of the ON and OFF response amplitudes is shown by the open circles. The curve is V-shaped, a finding that will be important later when responses to color contrast are considered.
Responses to negative (left column) and positive contrast steps (right column) of white light for a centered spot of 100 µm in diameter. The background is 200 cd/m2. Contrast is specified as log10S/B (see text). Recording bandwidth: 0 to 225 Hz.
Plot of the complete contrast/response data for the recording of Fig. 2: peak amplitudes of the ON response (filled circles), OFF response (triangles), and the sum of the ON and OFF amplitudes (open circles). Measurements are from a series of single responses including those in Fig. 2. The stimulus is 100 µm in diameter on a background of 200 cd/m2 and 2000 µm in diameter. See text for statistical analysis of similar results from 12 preparations.
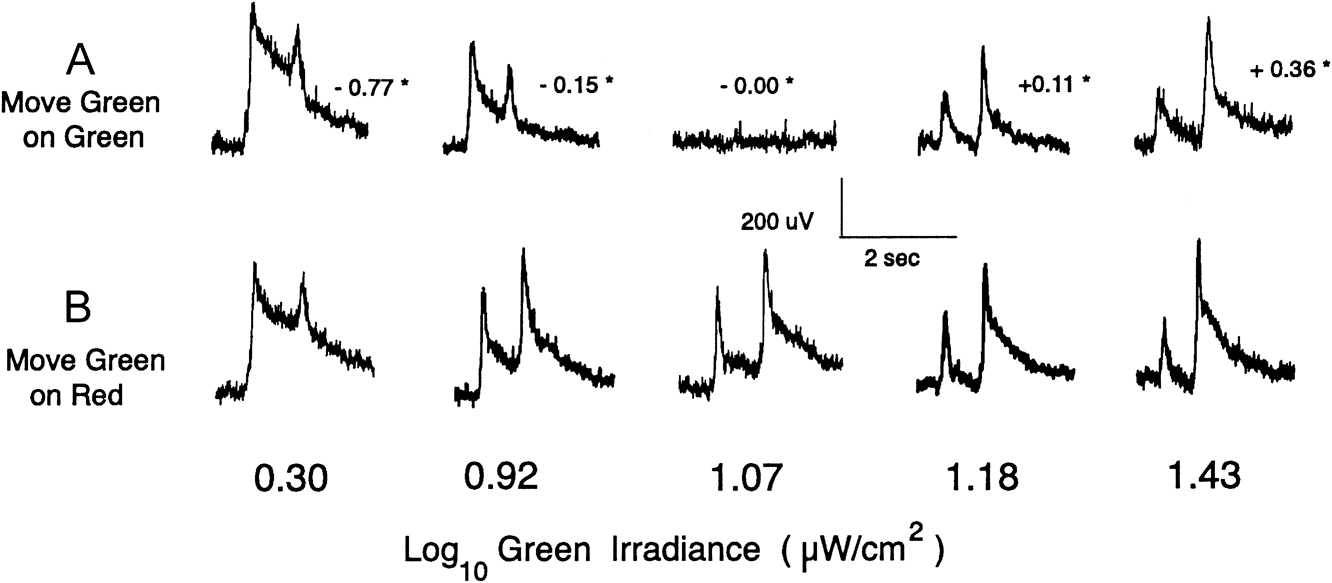
Responses to a moving 200 µm green bar on a green (A) and red (B) background field. The achromatic contrast of the green bar on green background is shown by the small numbers with asterisks near the five responses in A. Recording bandwidth: 0 to 225 Hz. The irradiances of the green and red backgrounds are log10 1.07 and 0.75 µW/cm2, respectively. Their calculated approximate photon levels were 2.77 × 10¹³ photons/s/cm2 and 1.51 × 10¹³ photons/s/cm2, for the green and red backgrounds, respectively.
Although the response varied in secondary details of waveform and maximum amplitude (range: ∼150 to 700 µV), the contrast/response curves for the ON response were fundamentally similar across preparations when analyzed by two statistics: C50n, the negative contrast required to evoke a half-maximal response and N/P, the ratio of the maximum responses evoked by negative and positive contrast. The mean values (n = 12) for c50n and N/P were 0.075 (±0.008 S.E.M.) and 2.75 (±0.42 S.E.M), respectively, on a background illuminance of 200 cd/m2. In preliminary tests, it was observed that responses to flashes of 430, 530, 630, and 680 nm were similar to those to white light. The relative spectral sensitivity at 630 nm was the highest, about twice that at 530 nm. The values given above for contrast responses to white light are statistically indistinguishable to those for zebrafish (Burkhardt, Reference Burkhardt2012).
Responses to color contrast to a moving stimulus
For humans and monkeys, the existence of responses to color contrast may be tested by presenting a stimulus of one color (e.g., green) on a background of another color (e.g., red) when the red and green lights are equated for luminance (Lee et al., Reference Lee, Pokorny and Smith1990; Legge et al., Reference Legge, Parish, Luebker and Wurm1990; Conway et al., Reference Conway, Hubel and Livingstone2002; Shapley & Hawken, Reference Shapley and Hawken2002). However, for animals other than a few primates, equal luminance for heterochromatic stimuli is uncertain or controversial. It is therefore necessary to distinguish responses to color contrast from those due to achromatic contrast. Thus, the approach taken in this report consists of presenting a green stimulus on either a red or a green background while systematically varying the irradiance of the green stimulus over a substantial and identical range on both backgrounds. In this way, responses to color contrast (green on red), if such exist, can be distinguished from responses to achromatic contrast (green on green). In the main condition, the red and green background fields were physiologically equated, within an experimental error of ±0.10 log unit, by measuring the response to a stimulus of fixed irradiance on a range of red and green background levels. The stimulus was a rectangular bar, 200 µm wide, and 1 mm long, moving in the direction of the long dimension at a velocity of 660 µm/s on a background field of 2000 µm in diameter. The values of these parameters are believed to be nearly optimal based on preliminary observations. Movement was a very effective stimulus parameter and is thought to be more biologically relevant than flashes of light. The bar generated distinct responses to the leading and trailing edge as it first moved into and then out of the center of the background field. The position of the narrow (200 µm) dimension of the bar was critical, as would be expected from the highly local nature of the PNR shown in Fig. 1. Thus, prior to all results described below, the position of the bar was carefully adjusted to evoke a maximum response.
Fig. 4 shows representative responses to the moving green bar on physiologically equated red and green background fields. Fig. 4A shows responses to five irradiance levels of the moving green bar. Since the bar and background are spectrally identical, the achromatic contrast of the stimuli can also be specified. The range of the achromatic contrast runs from −0.77 to +0.36, as is shown by the small numbers near the response waveforms in Fig. 4A. There is no response at an irradiance of 1.07 when the background is green but in Fig. 4B, there is a strong response at 1.07 green irradiance when the background is red. On the other hand, the pair of responses at the low irradiance of 0.30 is very similar as is the pair of responses at the high irradiance of 1.43. Since the responses to the green bar on green background are due solely to achromatic contrast, it follows that the paired responses at 0.30 and 1.43 on the red background are also largely due to achromatic contrast with little or no contribution from color contrast.
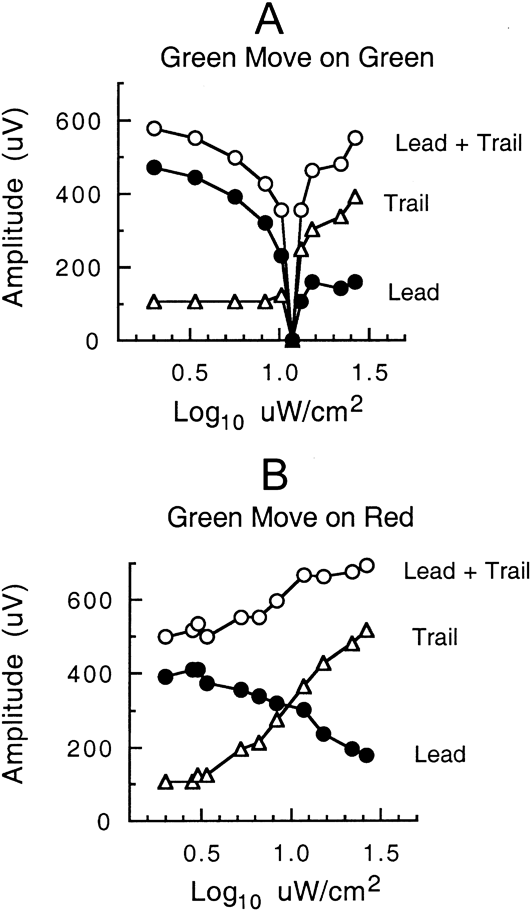
The results of this paradigm were analyzed quantitatively by plotting the peak amplitude as a function of the irradiance of the green bar. Fig. 5A shows measurements for the response to the leading and trailing edge of the green bar on the green background. Since the bar and background are spectrally identical, these responses are wholly due to achromatic contrast. The response is undetectable at zero contrast, as expected, and small for small contrasts around zero contrast. The plot of the sum of the leading and trailing responses is V-shaped, like the sum of the ON and OFF responses for achromatic contrast in Fig. 3.
Plot of the complete amplitude/response measurements for the recording of Fig. 4 based on the peak amplitude of the response to the leading (filled circles) and trailing edges (triangles) of the moving green bar. Open circles show the sum of the leading and trailing amplitudes. A: Green bar on green background of log101.07 µW/cm2. B: Green bar on red background of log100.75 µW/cm2. The backgrounds were physiologically equated to ±0.10 log unit (see text).
Fig. 5B shows the results for the green bar on the red background. The results are markedly different than those of Fig. 5A. The responses to the leading and trailing edge do not approach zero, whereas the sum of the responses remains elevated and is not V-shaped like that of Fig. 5A. As elaborated below, this difference is taken as evidence for the encoding of red–green color contrast.
The response to color contrast was studied over a wide range of conditions. Measurements were obtained in a total of 10 retinas with the background levels approximately matched in physiological effectiveness, as described above. The plots showed a pattern similar to that of Fig. 5. Hereafter, this will be referred to as the essential pattern to indicate that, despite secondary variations, the following features hold: (1) the curves tend to converge at extreme irradiances; (2) the responses to leading and trailing edges show null responses on the green background but do not approach zero on the red background; (3) the plot for the sum of the responses is V-shaped on the green background while remaining well elevated on red.
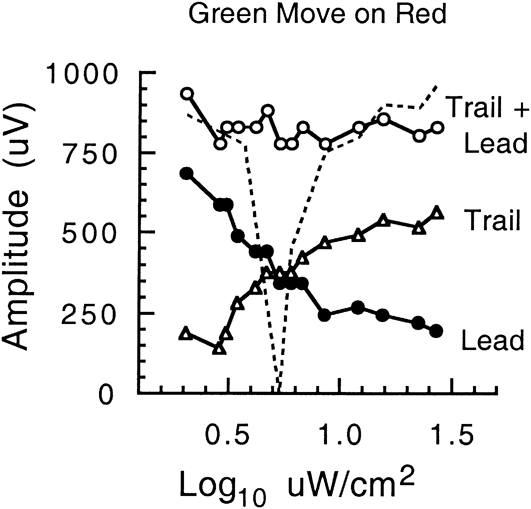
In additional tests (N = 8), the backgrounds were both reduced by 0.35 log unit. A representative result is shown in Fig. 6. The sum of the leading and trailing responses is shown by open circles for the case of green on red and by the dotted line for green on green. As expected, the null point for green on green is displaced by about 0.35 log unit to the left relative to that in Fig. 5. The sum of the green on red plot remains elevated and approximately flat with no hint of a null response. Thus, Fig. 6 conforms to the essential pattern.
Amplitude/response measurements on backgrounds reduced by 0.35 log unit relative to those in Fig. 5. Measurements from single (not averaged) responses. Filled circles and triangles show, respectively, the peak amplitude of the response to the leading and trailing edges of the moving green bar on a red background of log100.40 µW/cm2, whereas the open circles show the sum of the leading and trailing amplitudes. The dashed line shows the sum of the leading and trailing amplitudes for the green bar on green background of log100.72 µW/cm2. Leading and trailing responses to green on green, not shown for clarity, were similar in form to those in Fig. 5.
Taken together, Figs. 5 and 6 allow four comparisons of green on red versus green on green plots. Across all possible comparisons, the form of the green on red clearly differs from that of the green on green, providing evidence for independence from the specific level of background irradiance. A comparison of Fig. 6versus Fig. 5 also shows, as was confirmed in 8 retinas, that the essential pattern is maintained with smaller or larger step sizes of the bar irradiance.
In further tests (n = 9), the overall level of the display was varied in five levels spanning a range of about 1000×. The specific values were 2.09, 1.07 (as in Figs. 4 and 5), 0.72 (as in Fig. 6), −0.25, and −1.19 log µW/cm2 for the green background while the paired irradiances of red background were (as in Figs. 4–6), respectively 0.32 log unit lower. The shapes and differences of the irradiance/response curves conformed to the essential pattern, even though the maximum response amplitudes were reduced on the weaker backgrounds. In sum, the essential pattern was independent of light adaptation over a large range.
Across all conditions discussed above, a sample of 76 plots from a total of 32 retinas was analyzed. In 8 cases, plots were atypical: the responses for green on green showed the usual V-shape but the leading edge of the response to the green bar on red background was always larger than the response to the trailing edge. On the other hand, the vast majority (n = 68) conformed to the essential pattern, despite some secondary quantitative differences across retinas and conditions. Moreover, as a rule, repeated irradiance/response curves based on single responses were highly reproducible. In sum, the findings for the essential pattern of color contrast were robust.
Bursts of on–off nerve impulse activity were routinely observed riding on the ON and OFF peaks of the PNR. Although the impulses were too small for quantitative studies, it was evident that the timing and relative strength of the impulse discharges to leading and trailing edges tended to vary in parallel with the simultaneously observed PNR.
The case of responses to a red bar was investigated in 5 retinas. Although not studied extensively, the differences for color contrast (red on green) versus achromatic contrast (red on red) resembled that described above for green bars on a red versus green backgrounds. Of prime interest, the waveforms of the response to red on green were all negative in polarity and similar to those for green on red. Thus, overt color opponency was not apparent.
The effects of some additional variables for the moving green bar on green and red backgrounds were screened. These included 200 µm centered 0.5 flashes, a short bar of 100 µm moving at moderate and high velocity (2 mm/s), and a large 2 mm moving border. The essential pattern was still evident, although attenuated with these less than optimal stimuli.
Discussion
Basic properties of the PNR
The finding that the PNR is well developed in the inner retina of goldfish provided the foundation for the present report, opening the way for a quantitative analysis of the encoding of achromatic versus color contrast. Fig. 1 underscores the finding that the PNR is a highly localized index of retinal activity since it is best evoked by small, critically positioned spots of light. For flashes of optimal size and position, the PNR is very sensitive to achromatic contrast of white light. On average, the maximum ON response to negative contrast is about threefold larger than that to positive contrast and the complete contrast/response curve is strongly asymmetrical (Fig. 3). For achromatic contrast, the plot of the sum of the ON and OFF response is V-shaped (Fig. 3), a characteristic property that provides an important bridge to subsequent observations on color contrast.
Color contrast encoding
The primary rationale of the present work was to take advantage of the PNR as a means to investigate color contrast encoding in the retina of an animal, the goldfish, known to have well-developed color vision and prominent opponent color coding (Wagner et al., Reference Wagner, MacNichol and Wolbarsht1960; Daw, Reference Daw1968; Abramov & Levine, Reference Abramov and Levine1972; Beauchamp & Daw, Reference Beauchamp and Daw1972; Spekreijse et al., Reference Spekreijse, Wagner and Wolbarsht1972; Bilotta & Abramov, Reference Bilotta and Abramov1989). Three hypotheses were considered: (1) That color contrast might be expressed via spectrally opponent signals. (2) That color contrast might be absent or very weak due to the dominance of spectrally non-opponent input at the level of the PNR. (3) That color contrast might be well developed without overt spectral opponency. This report supports the third possibility.
The evidence for the encoding of color contrast at the level of the PNR was quantitative, robust, and extensive, in the form of some 68 recordings under varied conditions. As highlighted in Figs. 5 and 6, a green bar on red background evokes responses across the entire irradiance range of the green bar, whereas in the case of green on green, it evokes null and smaller responses over a midrange of irradiances. There was no evidence of overt color opponency in these results for the PNR or in concurrent observations of the impulse discharge of on/off neurons. Color opponency might well appear in the PNR under other stimulus conditions, an issue beyond the scope of the present report.
Since the green background and bar are spectrally identical, the responses in Figs. 4–6 must be due to an achromatic mechanism. It is suggested that the achromatic mechanism might be mediated by spectrally non-opponent ON and OFF bipolar cells whose output is subsequently transformed to generate contrast-rectified responses of ON/OFF neurons in the inner retina. This hypothesis is consistent with general evidence and models of inner retinal circuitry (for reviews, see Miller, Reference Miller, Schmidt and Worden1979; Burkhardt & Fahey, Reference Burkhardt and Fahey1999; Miller, Reference Miller2008; Wu, Reference Wu2010; Dowling, Reference Dowling2012). Bursts of on–off nerve impulse activity were routinely observed to cluster on the ON and OFF peaks of the PNR, supporting the conclusion that the PNR is correlated with the excitation of the on/off channel of the goldfish retina. On several grounds, it is believed that the PNR arises primarily from postsynaptic potentials of on/off amacrine and ganglion cells (for a detailed discussion see Burkhardt (Reference Burkhardt2012)). The much stronger ON response to negative contrast (Fig. 3) is presumably due to stronger input from OFF versus ON bipolar cells.
If only an achromatic system was driving the PNR, the response curve for the green bar on red background would be expected to be similar in form to that of the green bar on the green background. This was not observed. The curves differed significantly in level and shape. Hence, an additional mechanism is implicated. It comes into play at midrange bar irradiances, giving rise to elevated responses and thus the emergence of color contrast. Superficially, this may be viewed as due to selective chromatic adaptation induced by red versus green backgrounds but exactly how this might come about is uncertain. In broad outline, it seems likely that the mechanisms underlying the color contrast are initiated in the outer retina due to complex interactions between spectrally opponent and non-opponent bipolar cells differentially driven by input from L and M cones. A rich variety of spectrally opponent bipolar cells exist in the carp (Kaneko & Tachibana, Reference Kaneko and Tachibana1981; Toyoda & Shimbo, Reference Toyoda, Shimbo, Toyoda, Murakami, Kaneko and Saito1999; Shimbo et al., Reference Shimbo, Toyoda, Kondo and Kujiraoka2000) and presumably, in goldfish. However, in goldfish as in all other vertebrate retinas, the relative number, type, and weighting of spectrally opponent and non-opponent bipolar cells and how they interact to drive on–off neurons in the inner retina is not known. Independent of the detailed mechanism, the findings in the present report strongly suggest that the effects ultimately transmitted to the inner goldfish retina lead to the generation of on/off responses for color contrast without overt color opponency.
Two classes of color contrast have long been recognized: simultaneous contrast when spatially separated colors are presented simultaneously and successive contrast when one color follows another in time (Boring, Reference Boring1942; Graham & Brown, Reference Graham, Brown and Graham1965; Daw, Reference Daw2012). The paradigm in previous work in goldfish (Daw, Reference Daw1967, Reference Daw1968) was designed for large field simultaneous color contrast, whereas the present report, featuring a narrow moving green bar on a red background, is a paradigm for successive color contrast. As Helmholtz and many others have noted (Graham & Brown, Reference Graham, Brown and Graham1965), responses to successive contrast must be predominant in natural vision due to movement of edges and boundaries in the retinal image. The prominent peak deflections to leading and trailing movement in Fig. 4 imply that they are primarily evoked by the edges of the bar stimulus. These responses could provide effective signals for detecting spectral differences between objects and backgrounds without necessarily encoding color quality per se.
The present results in goldfish are in remarkably good agreement with recent findings in zebrafish (Burkhardt, Reference Burkhardt2012). For achromatic contrast, the mean quantitative data in the present report are statistically indistinguishable (P < 0.01) from those found in zebrafish (Table 1, Burkhardt, Reference Burkhardt2012). Like goldfish, the zebrafish has color opponent horizontal cells in the outer retina (Connaughton & Nelson, Reference Connaughton and Nelson2010). In the identical movement paradigm, both species show the essential pattern for color contrast without overt color opponency at the level of the PNR. These results to date thus raise the possibility that the encoding of successive color contrast by inner retinal circuitry may be conserved, at least across lower vertebrates.
A central finding of the present report, that the responses seem dominated by achromatic contrast at extreme stimulus irradiance levels, is compatible with observations in human vision that color contrast is absent or weak in the presence of strong achromatic contrast (Kirschmann, Reference Kirschmann1891; Boring, Reference Boring1942; Berliner, Reference Berliner1949; Alpern, Reference Alpern1964; Graham & Brown, Reference Graham, Brown and Graham1965; Gordon & Shapley, Reference Gordon and Shapley2006). This, in turn, suggests that there may be little functional utility or added value of color contrast when achromatic contrast is strong. On the other hand, the upshot of a body of studies of natural images (reviewed in Burkhardt et al., Reference Burkhardt, Fahey and Sikora2006) shows that, in nature, achromatic contrasts are typically quite low. Hence, under these conditions, color contrast may be critical for behavior and survival. The present findings (Figs. 4–6), along with similar findings in zebrafish (Burkhardt, Reference Burkhardt2012), thus resonate with the suggestion of Walls (Reference Walls1963) that the advantage provided by color contrast for object detection in the presence of low achromatic contrast may have been a driving force for the evolution of color vision in lower vertebrates.