Introduction
The nearctic leafhopper Scaphoideus titanus Ball (Hemiptera: Cicadellidae) was introduced into Europe in the late 1950s (Bonfils & Schvester, Reference Bonfils and Schvester1960) and is now widespread in many European countries from Portugal to Bulgaria (COST Action FA0807). This species is a grapevine specialist, and develops on both wild and cultivated grapevine (Vitis spp.). It is univoltine and overwinters in the egg stage, which is laid under the bark of wood 2 years of age or more (Vidano, Reference Vidano1964); eggs start to hatch in the middle of May and nymphs (which include five instars) are present until the end of July, whereas adults usually appear at the beginning of July and are observed until the middle of October (Vidano, Reference Vidano1964). S. titanus is an important pest, being the main vector of grapevine Flavescence dorée (FD), a disease caused by 16SrV phytoplasmas (subgroups C and D) (Malembic-Maher et al., Reference Malembic-Maher, Salar, Filippin, Carle, Angelini and Foissac2011). Nymphs from the 3rd instar on acquire phytoplasmas by feeding on infected plants (acquisition access period, AAP) and, following a latency access period (LAP) of 4–5 weeks, they become adults and able to transmit FD to healthy plants (IAP) (Bressan et al., Reference Bressan, Spiazzi, Girolami and Boudon-Padieu2005). Since FD causes great economic losses, insecticidal sprays against S. titanus are mandatory in Italy: the active ingredients include neonichotinoids, organophosphates, etofenprox, and natural pyrethrum, the last one in organic farming (Lessio et al., Reference Lessio, Albertin, Lombardo, Gotta and Alma2011a ). However, there are still many ecosystems suitable to the survival of S. titanus such as untreated vineyards, organic farming vineyards, abandoned vineyards, and woods or uncultivated areas colonized by wild grapevine (WGV, mainly from overgrown rootstocks: Vitis rupestris, V. riparia×berlandieri, etc.). The easiest way to assess the threat of these areas to viticulture by serving as reservoirs for this leafhopper is to apply mark–release–recapture (MRR) or mark–capture (MC) techniques.
Marking methods used in entomology include fluorescent dusts (Garcia-Salazar & Landis, Reference Garcia-Salazar and Landis1997; Takken et al., Reference Takken, Charlwood, Billingsley and Gort1998; Skovgärd, Reference Skovgärd2002), radioisotopes (Hagler & Jackson, Reference Hagler and Jackson2001), and immunomarking (Hagler & Jackson, Reference Hagler and Jackson2001; Jones et al., Reference Jones, Hagler, Brunner, Baker and Wilburn2006; Hagler & Jones, Reference Hagler and Jones2010). In MRR experiments, insects (obtained under laboratory conditions or captured in the field) are marked, released at a certain point in the field, and then recaptured, usually by means of traps. However, there are many drawbacks in applying MRR methods, both generally and especially concerning S. titanus. First of all, it is not possible to mark and release a quantity of insects as large as the effective population in the field. Moreover, the number of marked individuals recaptured is generally small, up to 8–10% (Zhou et al., Reference Zhou, Hoy, Miller and Nault2003; Lessio et al., Reference Lessio, Chiusano and Alma2008). In addition, the marker may affect the insects’ flight behavior to some extent. Finally, it is sometimes difficult to obtain a great amount of insects, especially concerning species such as S. titanus that have just one generation per year and an obligatory diapause, and therefore are difficult to rear continuously under laboratory conditions. The application of a marker directly on the host plants overcomes these problems, and it has been possible since the development of immunomarkers detectable with ELISA techniques. The first immunomarking method available was based on vertebrate proteins, such as chicken or rabbit immunoglobulin G (IgG) (Hagler, Reference Hagler1997; Blackmer et al., Reference Blackmer, Hagler, Simmons and Cañas2004, Reference Blackmer, Hagler, Simmons and Henneberry2006), but it has not been much used because of too expensive. The development of low-cost markers, such as food proteins such as cow milk, soya milk, or chicken egg whites, widened the possibility of using MC techniques in entomology on the large-scale experiments (Jones et al., Reference Jones, Hagler, Brunner, Baker and Wilburn2006). A recent study compared the performances of so-called first (IgGs) and second (food proteins) generation markers, and found that egg whites have a longer persistence compared to IgGs, whereas no difference was observed in the insects’ mortality (Slosky et al., Reference Slosky, Hoffmann and Hagler2012). For these reasons (large-scale marking of field-borne insect populations, low-cost, and high reliability of the markers), this novel MC technique was applied in this research to track the dispersion of S. titanus adults from wild to cultivated grapevine in Northwestern Italy. The markers used were cow milk and chicken egg whites.
Materials and methods
Large-scale field marking and sampling of S. titanus
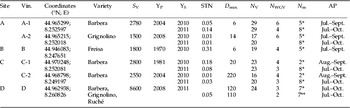
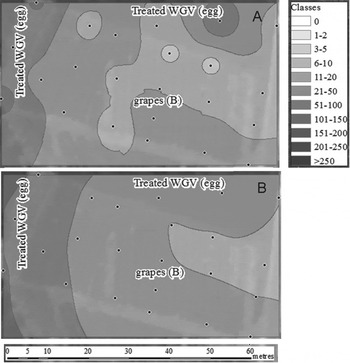
Field studies were conducted during 2010 and 2011 in the district of Portacomaro (province of Asti), Piedmont, Italy. Four experimental sites, called A, B, C, and D, were set up; each site consisted of one or two vineyards (A-1 and A-2 for site A, etc.) which were set from 5 to 330 m far from woods colonized by WGV. Concerning insecticides, vineyard B received two sprays with Etofenprox on 26 June and 25 July, whereas all others were sprayed with Thiamethoxam and Chlorpirifos-methyl on the first and second date, respectively. In the middle of June, before the first spray, the presence of S. titanus nymphs was assessed by visual inspection according to a sequential sampling plan with a fixed-precision level of 75%, based on Green's equation (Lessio & Alma, Reference Lessio and Alma2006) (table 1).
Main features of the experimental sites and marker applications.

Sites consisted in vineyards and stands of wild grapevine. All vineyards (Vin.) were treated with Thiametoxam (approx. 26 June) and Chlorpirifos-methyl (approx. 25 July), except vin. B that was treated twice with Etofenprox on the same dates; S V, size of vineyards, in m2; YP, year of planting; YS, year of study; STN, density of S. titanus nymphs/five leaves per plant in the vineyard, calculated with a sequential sampling plan (Lessio & Alma, Reference Lessio and Alma2006). D min, minimum distance in meters from stands of wild grapevine (WGV); N WGV, number of traps on stands of WGV (in site D there were two separate stands of WGV); N V, number of traps in vineyards; N m, number of markers’ application during the season; *, egg; **, milk; AP, application period of markers during the season.
The markers used were albumin (pasteurized chicken egg whites: Eurovo SRL, S. Maria in Fabiano Lugo, province of Ravenna, Italy, approximate cost 5.00 €/l), and casein (sterilized ultra-high temperature (UHT) whole fat cow milk: by Centrale del latte di Torino, Italy, approximate cost 0.50 €/l), henceforth referred to as egg and milk, which have a greater reliability compared to soya milk (Jones et al., Reference Jones, Hagler, Brunner, Baker and Wilburn2006). The markers were used as tap water solutions at a ratio (volume/volume) of 10 and 20% for egg and milk, respectively. No water softener and/or wetting agent were added, as they do not significantly improve insect marking in the field (Boina et al., Reference Boina, Meyer, Onagbola and Stelinski2009). The markers were applied every 10–20 days from 8 July to 10 September (table 1) using a hand jet sprayer with a 15-liters tank, at a rate of 4000 liters/ha, directly onto WGV. When two separate WGV stands were present in the same site, a different marker on each of them was applied; otherwise, only egg was applied, which is more detectable than milk (Jones et al., Reference Jones, Hagler, Brunner, Baker and Wilburn2006). The daily amount of rainfall (mm) was recorded from a meteorological station set at the same distance (2 km) from each of the experimental sites.
Yellow sticky traps (20 cm×30 cm) were placed in the vineyards at a distance of 15–20±2 m from each other on the vine row, and 5–6±0.5 m between rows, depending on the plot size (for larger plots, the distances were increased in order to cover evenly the whole plot size), and directly on stands of WGV, at a distance of 15–20±2 m from each other (table 1; figs 3–6) to capture marked S. titanus adults; each trap was geo-referenced with a Garmin® GPS receiver and the distance between traps was confirmed by measuring with a graduated tape. Eight to 19 days after each marker application, captured adults were carefully removed from the traps directly in the field using a wooden toothpick (using a new one every time to prevent cross-contamination), placed into sterilized 1.5 ml microcentrifuge tubes (one insect/tube), and stored at −20 °C before analyses. The traps were placed at the beginning of July and replaced after each insect removal up to the middle of October, which represents the window of S. titanus adults’ presence in Northwestern Italy (Lessio & Alma, Reference Lessio and Alma2004b ).
Laboratory analyses
An indirect ELISA was performed to detect protein markers acquired by the leafhoppers; when egg and milk were used in the same sampling site, insects were analyzed so as to detect both markers at once. Commercially available antibodies for chicken egg albumin such as rabbit anti-egg (RAE; C6534, Sigma-Aldrich, St. Louis, MO, USA) and bovine casein such as sheep anti-casein (SAC; antibodies-online GmbH, Aachen, Germany) were used. The secondary antibodies used for the chicken egg albumin and bovine casein assays were peroxidase conjugated donkey anti-rabbit IgG (H+L) (DAR) (31,458; Pierce Biotechnology, Rockford, IL, USA) and peroxidase conjugated rabbit anti-sheep IgG (H+L) (RAS) (31480; Pierce Biotechnology, Rockford, IL, USA), respectively.
Reagents included: Tris-buffered saline (pH 8.0) +0.3 g l−1 sodium ethylenediamine tetra acetate (TBS–EDTA; Sigma-Aldrich, St. Louis, MO, USA); phosphate-buffered saline +20% bovine serum (PBS–BS; Sigma-Aldrich, St. Louis, MO, USA); phosphate-buffered saline + 20% bovine serum +1300 ppm Silweet L-77 (PBSS–BS 20; Silwet, Chemtura Manufacturing, Manchester, UK); phosphate-buffered saline +30% bovine serum +1300 ppm Silweet L-77 (PBSS–BS 30); phosphate-buffered saline +0.09% Triton X-100 (PBST) (Triton-X-100; Sigma-Aldrich, St. Louis, MO, USA); phosphate-buffered saline +2.3 g l−1 sodium dodecyl sulfate (PBS–SDS); sulfuric acid (H2SO4) 2 N; and immuno-pure ultra TMB substrate (Pierce Biotechnology, Rockford, IL, USA).
For the chicken egg assay, the primary antibody was diluted 1:4000 (2 μl in 8.0 ml) in PBSS–BS20, whereas the secondary one was diluted 1:6000 (1.4 μl in 8.4 ml) in PBSS–BS20. For the casein assay, the primary antibody was diluted 1:500 (16 μl in 8.0 ml) in PBSS–BS30, whereas the secondary one was diluted 1:1500 (5.4 μl in 8.1 ml) in PBSS–BS20. The following protocol, slightly modified after Jones et al. (Reference Jones, Hagler, Brunner, Baker and Wilburn2006), was applied: 1 ml TBS–EDTA was added to the 1.5 ml microcentrifuge tube with the insect, vortexed for 2–4 s and left in stand-by mode for 3 min. From each tube, three 80 μl aliquots (replicates) were taken and placed into individual wells of a 96-well microplate (Nunc Polysorp, Nalge Nunc, Naperville, IL, USA) (to minimize contamination during washings, six wells between the last sample and the negative and blank controls were left empty); the micro-plate was then covered with aluminum foil and incubated at 37 °C for 2 h. (at the end of this step, the leafhoppers were sexed by observing the external genitalia with a stereomicroscope and then discarded). The plate was then emptied and washed five times with 300 μl PBST using a LT-3000 micro-plate washer (Labtech International Ltd., Uckfield, UK). Then 300 μl PBSS–BS (for egg) or 300 μl PBS–BS (for milk) were added, and the plate was incubated at 37 °C for 1 h. Afterwards, it was washed two times with 300 μl PBST, added with 80 μl of the first antibody (RAE for egg and SAC for milk) and incubated at 37 °C for 30 min. The plate was then emptied, washed five times with 300 μl PBST, added with 80 μl of the second antibody (DAR for egg and RAS for milk), and incubated at 37 °C for 2 h. After incubation, the plate was washed three times with 300 μl PBS–SDS and three times with 300 μl PBST. Then 80 μl TMB were added and the plate was incubated at room temperature (25 °C) in the dark on a shaker for 10 min. The reaction was then stopped by adding 80 μl of 2 N H2SO4 and the plate was scanned with an LT-4000 micro-plate reader (Labtech International Ltd., Uckfield, UK) at wavelengths of λ=450 and 492 nm (reference standard).
Positive standards consisted in adults of Euscelidius variegatus (Kirschbaum) (Hemiptera: Cicadellidae) reared on oat (Avena sativa L.) under laboratory conditions. Potted plants of either oat or broad bean (Vicia faba L.) were sprayed with the markers using a hand vaporizer, and then placed into insect-proof cages, made of net and Plexiglas (20 cm×20 cm×40 cm), in a climatic chamber (T=23±2 °C, RH=60%, L:D=16:8 h). Afterwards, 90 E. variegatus adults were put into each cage; 7 days later, the leafhoppers were removed, killed by freezing, and preserved at −20 °C before analyses; some untreated leafhoppers were used as negative controls, and extraction buffer alone served as blank control.
Each sample (=insect) was associated with three values of optical density (ODS) for each wavelength. The mean ODS at 450 was subtracted from the mean at 492: ODS(450–492)=ODS450–ODS492; and the same equation was applied to the optical densities of the negative control: ODN(450–492)=ODN450–ODN492; and blank: ODB(450–492)=ODB450–ODB492. Finally, the corrected (blanked) optical densities for each sample and for the negative control were obtained as ODCS=(ODS450–492)–(ODB450–492) and ODCN=(ODN450–492)–(ODB450–492), respectively. A sample was considered marked when the ODCS was greater than the mean ODCN added plus four times its standard deviation (SD): ODCS>ODCN+4SD, providing additional protection against false positives (Jones et al., Reference Jones, Hagler, Brunner, Baker and Wilburn2006).
Data analyses
The dispersion of S. titanus adults from WGV to the vineyards was studied by fitting an exponential model: N (r)=a exp (−br), where N is the percentage of marked individuals caught at the minimum distance r from the treated area (5±1.5 m step), weighted by the number of traps displayed at the same distance r (being P i the number of positive specimens captured on the total number of traps t i placed at the ith minimum distance r from the treated WGV, the grand total is T=ΣP i /t i ; and, subsequently, N=P i /T is the percentage of marked individuals per trap at the ith distance r); a is a scaling parameter that estimates the number of S. titanus collected at r=0; and b is the spatial scale parameter that models the rate of variation in the insects captured. The exponential model was chosen to verify if marked S. titanus would decrease at increasing distances from the source (treated WGV) following an exponential decay pattern. For the same reason, for each regression we calculated the median dispersal index r 0.5 (i.e., the distance where 50% of the marked individuals are found) using the negative half-life equation: r 0.5=ln(2)/b (Northfield et al., Reference Northfield, Mizell, Paini, Andersen, Brodbeck, Riddle and Hunter2009).
In order to assess differences in dispersal between genders, regression equations were obtained separately for females and males and the homogeneity of the regression test was evaluated (Sokal & Rohlf, Reference Sokal, Rohlf, Sokal and Rohlf1995). The influence of rainfall and time elapsed between the marker's application and insect sampling (independent variables) on the percentage of positive individuals captured on traps placed within the treated points (dependent variable) was studied by applying a weighted least-square (WLS) linear regression, using the total number of insects captured as the weight variable (Sokal & Rohlf, Reference Sokal, Rohlf, Sokal and Rohlf1995). All regression analyses were carried out with the SPSS 20.0® statistical package (http://www.spss.it). All percentage data were previously arcsin square-root transformed.
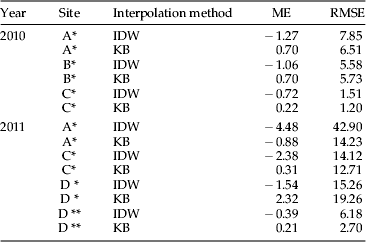
To detect the pathways of S. titanus adults from WGV to vineyards, spatial interpolation of the marked insects captured was performed by applying Inverse Distance Weighting (IDW) and Kernel interpolation with barrier (KB), both available in the ArcMap toolbox of ArcGIS Desktop 10.1 (http://esri.com). The choice of these two models rather than others was made in order to detect a movement pattern of S. titanus based solely on a line-of-sight distances between sampling points (IDW), to another one that might be influenced by the presence of breaklines (KB). The IDW is a deterministic method, based on the Euclidean distance between sampling points (Bartier & Keller, Reference Bartier and Keller1996). It is easy and rapid to use, and is appropriate for aggregated data, as it highlights the hot spots (Tillman et al., Reference Tillman, Northfield, Mizell and Riddle2009). The generic IDW equation is: z x,y =Σz i w i/Σw i , where z x,y is the value to be estimated, z i is the control value for the ith sample point, and w i =(d x,y,i ) – β is the weight that states the contribution of each z i in determining z x,y , where d is the distance between sampling points z x,y and z i , and β is defined by the user (the greater the value of β, the smaller the reciprocal influence of the sampling points; in this research β=2, which is the most widely used, was chosen). Kernel interpolation is used to determine the ‘utilization distribution’ (UD) of a resource by an animal (Sheather & Jones, Reference Sheather and Jones1991; Benhamou & Cornélis, Reference Benhamou and Cornélis2010). The Kernel density estimate f^ h of a univariate density f based on a random sample X 1,…, X n of size n is: f^ h (x)=n −1 Σh −1 K[h− 1 (x−X i )], where K is the kernel function and h is the bandwidth, a smoothing parameter (Sheather & Jones, Reference Sheather and Jones1991). Kernel interpolation with barriers (KB) is a variant that uses a non-Euclidean distance rather than a line-of-sight approach, so that the shortest distance between two points within the defined search neighborhood is used to connect them; in this case, the exponential equation, which was used during the regression analysis (whereas no transfer function is needed to apply the IDW method) was the Kernel function, whereas the bandwidth was calculated as a default by ArcMap. Barriers were represented by crops or natural vegetation stands between the treated WGV and vineyards; however, they were considered partially open, as some movements within non-grapevine ecosystems may occasionally occur. The interpolation maps obtained were tested for accuracy via cross-validation: the mean prediction error: ME=[Σ j=1,n (x^ i −x i )/n], and the root-mean-square error: RMSE=sqrt[Σ j=1,n (x^ i −x i )2/n], where x^ i is the predicted value, x i the observed value, and n the sample size, were calculated. Both ME and RMSE are given in the same units of measure of the data: an ideal model should have an ME equal 0, and an RSME as small as possible. While RMSE gives an estimate of the error as a whole, ME mainly provides an estimate of the bias: that is, positive and negative ME values indicate that the model over or underestimates the data, respectively (Rhodes et al., Reference Rhodes, Liburd and Grunwald2011).
Results
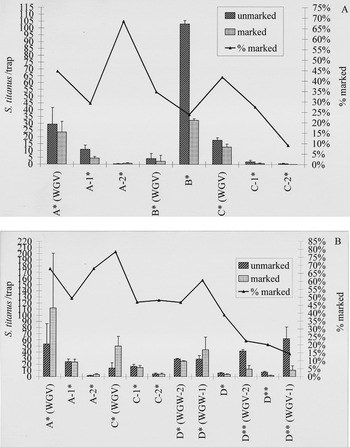
In total, 1675 and 3901 S. titanus adults were captured in 2010 and 2011, respectively. The flight peak occurred between the first 10 days of August and the beginning of September. 4881 insects were analyzed by detecting egg alone (1664 in 2010 and 3217 in 2011), and 536 were screened for both egg and milk (all in 2011). Without considering differences in sites and position of traps, egg-positive individuals were 32 and 55% in 2010 and 2011, respectively (mean 43%). In 2010, the rate of egg-marked adults captured on WGV and in vineyards ranged from 36 to 44 and 9 to 68%, respectively (fig. 1A). However, the minimum value of 9% refers to vineyard C-2, placed at a minimum distance of 220 m from the treated WGV, where few insects were captured. In vineyard B (minimum distance from WGV: D min.=6 m), although many insects were captured, few of them resulted marked (<25%) (table 1). In 2011, egg-marked adults in WGV and vineyards were 46–78 and 38–68%, respectively (fig. 1B). Milk was only used in site D in 2011 in one stand of WGV (D min.=110 m), whereas a second stand (D min.=120 m) was sprayed with egg: 97 (18%) of the 536 tested leafhoppers were milk-positive, and 82 of them were captured on milk-sprayed WGV; 206 (38%) were egg-positive, and 131 were captured on egg-treated WGV (fig. 1B); finally, 58 (11%) of them were positive for both egg and milk at the same time. The ODS values of positive specimens calculated on five plates chosen at random (mean±SE) were 0.67±0.09 for egg, and 0.56±0.19 for milk; positive reference standards (E. variegatus maintained on treated broad bean or oat) scored 2.26±0.03 for milk and 2.28±0.06 for egg, whereas negative controls (untreated E. variegatus) were 0.01±0.00.
Captures of Scaphoideus titanus adults on stands of wild grapevine (WGV) and in vineyards within the different experimental sites, and rate of marked specimens (*, egg; **, milk). (A) 2010; (B) 2011.

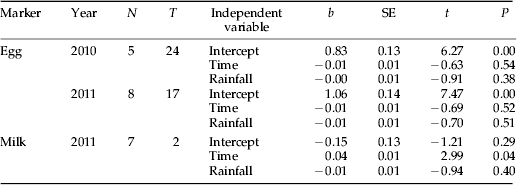
Rainfall occurred eight times both in 2010 (min. 1.4 mm, max. 35 mm, total amount 125 mm), and 2011 (min. 0.4 mm, max. 31 mm, total amount 67 mm). Neither rainfall nor time between applications influenced the rate of egg-marked S. titanus; on the other hand, milk-marked specimens were negatively related to time (table 2).
Results of weighted least-square (WLS) regression of marked S. titanus as a function of rainfall and time.

Dependent variable, rate of marked S. titanus (previously arcsin square root transformed) collected on traps placed on wild grapevine (WGV) at each observation, without considering differences between experimental sites; N, number of observations during the season; T, number of traps observed; independent variables, rainfall occurred (mm) and time elapsed (days) between marker's application on WGV and insects' collection; weight variable, total insects captured (marked + unmarked) on traps placed on WGV at each observation.
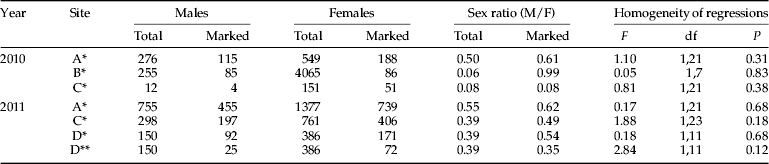
The sex ratio (M/F) was generally female biased, both for total (0.39–0.55) and marked (0.35–0.99) individuals; site C in 2010 represents an exception; it has been investigated only since the first week of August, and the sex ratio was 0.08 for both total and marked insects. Egg-marked specimens ranged from 33 to 66% for males, and 18 to 54% for females; whereas milk-marked males and females were 17 and 19% of the total captured, respectively. The homogeneity of regression test between the distribution of marked males and females as a function of distance of capture from the treated point was never significant within different experimental sites and years (table 3). Therefore, the exponential models were fitted to the experimental data (and the subsequent median dispersal indexes calculated) without taking gender into account.
Sex ratios observed, and homogeneity test for exponential regression of marked S. titanus males and females captured at different distance from wild grapevine (WGV).

Dependent variable, rate of marked S. titanus males and females (marked/total) previously arcsin square-root transformed; independent variable: distance from treated WGV. *, egg; **, milk; df, degrees of freedom.
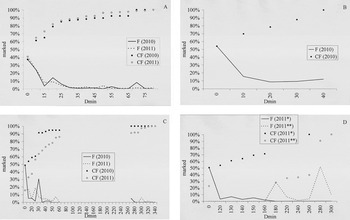
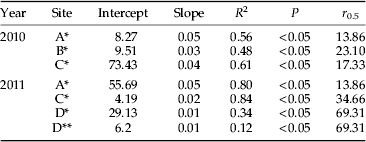
Exponential regression analyses provided a significant fit of marked S. titanus adults as a function of the minimum distance from the treated point, although in site D low R 2 values were obtained; the subsequent median dispersal indexes ranged from 14 to 70 m within the different experimental plots (table 4). The cumulative distribution functions show how the main captures (80%) occurred within 20–30 m from WGV (fig. 2A, B); however, there was also evidence of long-range dispersal up to 320 m (fig. 2C, D). In site A, captures decreased asymptotically after 25–30 m, although a slight increase was observed between 65 and 70 m (fig. 2A), whereas in site B (investigated only during 2010) they were almost constant with increasing distance (fig. 2B). In site C, in 2010 there was a clear point break (increase) at a distance of 30 m, and thereafter captures did not increase anymore; but this site has only been observed since the beginning of August in 2010. In the second vineyard (C-2), further from the treated zone, only a single marked specimen was captured. In 2011, the trend was smoother with a constant decrease in captures up to 60 m (maximum distance of the first vineyard, C-1, from WGV); up to 10% of the total marked insects were found in the second vineyard (C-2) (fig. 2C). In site D, 70% of the egg-marked adults were captured on treated WGV and a cumulative 30% in the vineyard, 120–160 m far, without any clear break point; on the other hand, only 60% of the milk-marked specimens were captured at the treated point, and 40% were found in the vineyard at a distance of 100–220 m (fig. 2D).
Frequencies (F) and cumulative frequencies (CF) of marked Scaphoideus titanus adults as a function of minimum distance (D min) from treated stands of wild grapevine (WGV) in the different experimental sites: (A) site A (vineyards A-1 and A-2 +1 WGV); (B) site B (vineyard B +1 WGV); (C) site C (vineyards C-1 and C-2 +1 WGV close to C-1); (D) site D (vineyard D +2 WGV); *, egg; **, milk.

Results of exponential regression of marked S. titanus adults as a function of minimum distance from wild grapevine (WGV).

Dependent variable, percentage of marked S. titanus captured during the whole season at the same minimum distance from treated wild grapevine (WGV), weighted by the number of traps placed at the same distance; independent variable, minimum distance from treated WGV (see text for details). *, egg; **: milk; r 0.5, mean dispersal index (in m).
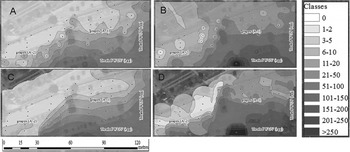
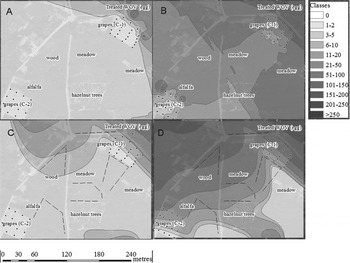
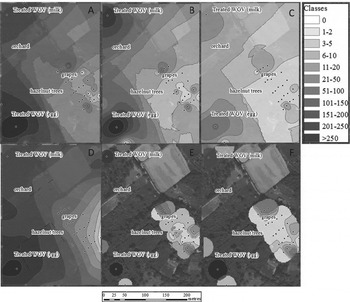
On the whole, both IDW and KB interpolation methods indicated a clear clustering of marked adults on the edges of the experimental vineyards. In many cases, when WGV was distributed along two edges, the clustering was much more evident if the European grapevine rows were parallel rather than perpendicular to the edge, e.g., sites A (fig. 3), and C, concerning the first vineyard (C-1) close to WGV (fig. 4). Site B, only studied in 2010, showed almost the same pattern (fig. 5); however, these results should be considered carefully because of the small size of the vineyard. In site D, egg and milk-marked individuals showed almost the same pattern independent of the interpolation method used (fig. 6). On the other hand, in site C, the long-distance dispersal from the WGV to vineyard C-2 had a different pattern depending upon the interpolation method used: IDW produced a more uniform map, whereas KB showed how the possible ecological corridors are displaced along the rows (fig. 4). On the whole, the cross-validation results showed lower RMSE values for KB rather than for the IDW (with the exception of sites B and D, concerning egg-marked specimens), indicating a better interpolation power of the first model compared to the second. The ME was generally positive for KB (overestimation) and negative (underestimation) for IDW; however, KB always had a lower absolute value (the only exception was represented by egg-marked specimens in site D) (table 5). Insects marked with both egg and milk were too few in number to perform a cross-validation.
Interpolation maps of marked Scaphoideus titanus captures in site A. IDW, inverse distance weighting; KB, kernel interpolation with barriers. (A) IDW, 2010; (B) IDW, 2011; (C) KB, 2010; (D) KB, 2011. Dots represent the position of yellow sticky traps (sampling points).

Interpolation maps of marked Scaphoideus titanus captures in site C, IDW, inverse distance weighting; KB, kernel interpolation with barriers. (A) IDW, 2010; (B) IDW, 2011; (C) KB, 2010; (D) KB, 2011. Dots represent the position of yellow sticky traps (sampling points).

Interpolation maps of marked Scaphoideus titanus captures in site B. IDW, inverse distance weighting; KB, kernel interpolation with barriers. (A) IDW, 2010; (B) KB, 2010. Dots represent the position of yellow sticky traps (sampling points).

Interpolation maps of marked Scaphoideus titanus captures in site D, obtained with Inverse distance weighting (IDW) or kernel interpolation with barriers (KB). (A) IDW, egg, 2011; (B) IDW, milk, 2011; (C) IDW, egg + milk, 2011; (D) KB, egg, 2011; (E) KB, milk, 2011; (F) KB, egg + milk, 2011. Dots represent the position of yellow sticky traps (sampling points).

Results of cross-validation analysis on the interpolation maps of marked S. titanus adults.

*, egg; **, milk; IDW, inverse distance weighting; KB, kernel interpolation with barriers; ME, mean error; RMSE, root-mean-square error.
Discussion
The marking method proposed, used in large-scale application on S. titanus, was quite reliable with egg, as up to 78% of the insects captured on the traps placed into the treated WGV were marked; on the other hand, milk had a poorer performance (22%). These data are in accord with Jones et al. (Reference Jones, Hagler, Brunner, Baker and Wilburn2006), who obtained roughly 70 and 23% of marked Cydia pomonella L. in apple orchards treated with egg and milk, respectively; whereas Boina et al. (Reference Boina, Meyer, Onagbola and Stelinski2009) obtained higher rates of Diaphorina citri Kuwayama marked with egg (88%) and milk (80%). In this research, one of the main problems was to treat properly the WGV canopy, as it develops up to 6 m above ground level in certain places and is sometimes very dense and difficult to reach. In order to study the movement of S. titanus during the entire period of the adults’ presence in the field, the markers were applied constantly but sometimes with a longer time lapse between application and the insects’ removal from traps; otherwise, it would get too time-consuming. A higher rate of positive individuals was found in 2011, probably because of a lower rainfall. However, concerning egg, there was no influence of rainfall or time after the marker's application on the rates of positive individuals. On the other hand, the time between application and removal did affect the rate of milk-marked S. titanus. In other researches, the rate of marked individuals decreased along with time after application and the amount of (simulated) rainfall (Jones et al., Reference Jones, Hagler, Brunner, Baker and Wilburn2006; Boina et al., Reference Boina, Meyer, Onagbola and Stelinski2009). Under laboratory conditions, 68–100 and 27–88% of true bugs retained the albumin marker when exposed to plants containing a 10- and 11–20-day-old residual treatment, respectively (Hagler & Jones, Reference Hagler and Jones2010).
In addition, direct egg treatment of Hippodamia convergens Guérin-Méleville allowed the detection of egg proteins on 100% of the individuals up to 26 days after marking (Slosky et al., Reference Slosky, Hoffmann and Hagler2012). The problem with marking plants is that insects must get into contact with the marker before it dries up or is washed off. In addition, direct marking of S. titanus adults would not be reliable because of the difficulty in obtaining a very big number of specimens, and this leafhopper may not be released into vineyards as it is subject to compulsory pest management. However, the data set obtained (30–50% of egg-marked specimens out of more than 5000 captured) seemed big enough to analyze and interpret the movement patterns of this leafhopper vector.
S. titanus adults are therefore capable of both short and long-range dispersal from wild (WGV) to cultivated grapevine. This behavior was previously theorized both in Italy (Pavan et al., Reference Pavan, Mori, Bigot and Zandigiacomo2012) and in the USA (Beanland et al., Reference Beanland, Noble and Wolf2006) by comparing captures in traps placed at different distances from potential S. titanus sources: the results of the present MC experiments clearly demonstrate how these movements actually occur. Most of the individuals seem to cover short distances: when WGV is close to the edge of the vineyards, up to 80% of the marked individuals are captured within 30 m. However, long-distance flight is also possible: S. titanus captures on the local scale are spatially related up to 200 m, whereas at greater distances they seem to depend on local factors, mainly pest management strategies (Lessio et al., Reference Lessio, Borgogno Mondino and Alma2011b ). The results of this research confirm this aspect, as some movements occurred up to over 200 m. In vineyard B, although many insects were captured, there were a few marked specimens (<25%) probably because of a high residential population of S. titanus; in fact, pest management in this site was different from (and probably less effective with respect to) the others. Concerning site D, in the vineyard, the majority of marked adults was captured in the Northwest corner, suggesting how the infestation may have mainly originated from the second uncultivated area, treated with milk; however, this area may also have recruited adults from other areas, as suggested by the double-marked individuals, and milk-marked adults being captured in the egg-treated zone and vice versa. On the whole, the Kernel with barriers (KB) interpolation method showed smaller errors (RMSE and absolute ME values) compared to IDW: the first model, which derives partially from the exponential regression (used as a transfer function in the Kernel interpolation process) is therefore more accurate than the latter (due to lower RMSE values), and its overestimation of observed data (ME>0) has a lower absolute value than the underestimation given by IDW (ME<0). These differences suggest how the movement patterns of S. titanus adults may not depend solely on their distance from sources but also on ecological corridors or natural barriers. It seems therefore that this leafhopper is less likely to perform direct long-distance flights, whereas it rather moves along more roundabout pathways. S. titanus adults have a crepuscular flight activity, which makes them not rely on the wind for dispersal (Lessio & Alma, Reference Lessio and Alma2004b ), and this may be in accord with an active wandering movement rather than a passive wind-borne transport. Moreover, marked adults were generally clustered along the same row of cultivated grapevine rather than on different rows; this is in accord with the fact that they move mainly along the same row, and captures on the same row are more spatially related (Lessio et al., Reference Lessio, Borgogno Mondino and Alma2009b ). Males and females showed no differences in dispersal from wild to cultivated grapes. Usually, males of S. titanus start to fly earlier than females; however, in the late part of the season the presence and flight activity of females increases, whereas males tend to decrease (Lessio et al., Reference Lessio, Tedeschi, Pajoro and Alma2009a ). This long-range dispersion of females may have a consequence during the next year, resulting in a higher population of S. titanus in vineyards because of egg-laying.
As WGV may also host 16SrV phytoplasmas (Lessio et al., Reference Lessio, Tedeschi and Alma2007), incoming S. titanus adults may also be capable of transmitting FD to cultivated grapevine: in fact, symptomatic grapes are often clustered at the edges, consistent with S. titanus coming in from outside (Pavan et al., Reference Pavan, Mori, Bigot and Zandigiacomo2012). Within this frame, pest management strategies against S. titanus in NW Italy should be revisited, as the main problem seems to be adults entering the vineyards in the late part of the season; at present, PM focuses on a first spray against nymphs at the end of June, a second one against adults at the middle-end of July, and a further one after harvest if necessary (Lessio et al., Reference Lessio, Albertin, Lombardo, Gotta and Alma2011a ). It is perhaps necessary to change this calendar, using a more persistent active ingredient in the late part of the season to protect grapes from inoculation; for instance, neonicotinoids are much more efficient than organophosphates in preventing transmission (Saracco et al., Reference Saracco, Marzachì and Bosco2008).
Other strategies should be directed toward avoidance: the first action to be applied should be to erase WGV as a source of S. titanus; however, such an action must not be done when adults (both males and females) are present, as it may cause an increase of their movement onto European grapevine. The same problem occurs when dealing with Hyalesthes obsoletus Signoret, the vector of Stolbur phytoplasmas causing Bois Noir (Weber & Maixner, Reference Weber and Maixner1998), which lives on weeds and only occasionally feeds on grapes as an adult (Alma et al., Reference Alma, Arnò, Arzone and Vidano1987): if weeds are erased, adults are compelled to move onto grapevine; for example, in Israel, where H. obsoletus has two generations per year, the second generation is more likely to move to grapes if its host plant is harvested or dries up because of summer heat (Orenstein et al., Reference Orenstein, Zahavi, Nestel, Sharon, Barkalifa and Weintraub2003). Another means of preventing leafhoppers from entering the vineyard may be the use of insect-proof fences (nets). These devices were successfully used in Israel against some Diptera (Vernon & MacKenzie, Reference Vernon and MacKenzie1998; Päts & Vernon, Reference Päts and Vernon1999; Bomford et al., Reference Bomford, Vernon and Päts2000). A 5 m high screen barrier was successfully evaluated in Californian citrus orchards and nurseries against Homalodisca vitripennis (=coagulata) (Say), a vector for Xilella fastidiosa causing Pierce's disease (Blua et al., Reference Blua, Campbell, Morgan and Redak2005). Such a protective device against S. titanus should be at least 2.5 m, as high as the flight boundary layer of this leafhopper (Lessio & Alma, Reference Lessio and Alma2004a ). Moreover, the screen should be provided with an overhang to avoid insects crossing it by walking on it (Bomford et al., Reference Bomford, Vernon and Päts2000). On the other hand, plantation of trees had inconsistent effects in limiting invasion into vineyards by Graphocephala atropunctata (Signoret), another vector for X. fastidiosa (Daugherty et al., Reference Daugherty, Gruber, Almeida, Anderson, Cooper, Rasmussen and Weber2012).
In conclusion, the presence of wild grapevines in grapevine-growing areas must be addressed with an integrated pest management strategy that includes: area-wide sprays and use of suitable active ingredients to prevent such a transmission as much as possible; avoidance of new grapevine plantations in regions with a high presence of WGV; destruction of WGV whenever possible, which would decrease the pathways available to this leafhopper; and the development of new tools such as physical barriers to avoid the entrance of S. titanus adults into vineyards from outside.
Acknowledgements
We are grateful to Edoardo Sala and Francesca Martina for the help given in field collections and laboratory analyses. Meteorological data were kindly provided by ‘Regione Piemonte Direzione Agricoltura, Settore Fitosanitario – Sezione Agrometeorologica’. This work was realized within the frame of the ‘FLADO’ research project, supported by ‘Regione Piemonte, Servizi di Sviluppo Agricolo’.