The secondary sex ratio (SSR) – the number of male live births for every 100 female live births – is one of the most fundamental demographic indicators of human survival. It is the product of primary sex ratio (i.e. sex ratio at conception, estimated as 130 at the second gestational month) and the sex ratio of fetal survival rate in the gestation periods. The reported SSR is approximately 105 in many human populations (United Nations Statistics Division, n.d.). As fetal deaths occur more frequently in males than in females (Davis et al., Reference Davis, Webster, Stainthorpe, Chilton, Jones and Doi2007), the sex ratio of fetuses declines steadily from the stage of conception to delivery.
Natural variability in the SSR has been reported in association with socio-demographic attributes (Norberg, Reference Norberg2004; Mathews & Hamilton, Reference Mathews and Hamilton2005), behavioural patterns (Fukuda et al., Reference Fukuda, Fukuda, Shimizu, Andersen and Byskov2002; Yang et al., Reference Yang, Lee, Chang, Chung, Tsai, Ko and Ko2008; Bulik et al., Reference Bulik, Holle, Gendall, Lie, Hoffman, Mo, Torgersen and Reichborn-Kjennerud2008; James, Reference James2008), pregnancy conditions (Chacon-Puignau & Jaffe, Reference Chacon-Puignau and Jaffe1996; Davis et al., Reference Davis, Gottlieb and Stampnitzky1998) and exposure to environmental chemicals (Mocarelli et al., Reference Mocarelli, Gerthoux, Ferrari, Patterson, Kieszak and Brambilla2000; Alexopoulos & Alamanos, Reference Alexopoulos and Alamanos2007). Wartime SSR was reported to increase during and after the World Wars, a suggested reason for which was earlier fertilizations due to higher coital rates (James, Reference James2009). Recent papers have reported declines in SSR after war (Zorn et al., Reference Zorn, Stare and Meden-Vrtovec2002), terrorism (Catalano et al., Reference Catalano, Bruckner, Marks and Eskenazi2006) or earthquake (Fukuda et al., Reference Fukuda, Fukuda, Shimizu and Møller1998), probably because of parental psychological stress. These bodies of research suggest that adverse environments, either physical or psychological, are associated with decreased SSR.
For a more general understanding of SSR determinants in moderately adverse environments (Obel et al., Reference Obel, Henriksen, Secher, Eskenazi and Hedegaard2007; Ruckstuhl et al., Reference Ruckstuhl, Colijn, Amiot and Vinish2010), this study analysed municipality-level vital statistic records in Japan collected between 1998 and 2002. Specifically, high- and low-SSR clusters were identified using spatial-scan statistics (Kulldorff, Reference Kulldorff1997).
There are 3355 municipalities in Japan (median population size: 7652, interquartile range: 4372.75–17833). Municipalities are one of the three levels of Japanese government (i.e. national, prefectural and municipal). Municipal male and female newborn data from 1998 to 2002 were obtained from Vital Statistics of Japan (National Statistics Centre, n.d.). The birth data were linked to the area centroid of each municipality boundary using a geographical information system.
Spatial-scan statistics were employed to identify municipalities with significantly different SSRs than would be expected under assumptions of equitable and even rates. SaTScan software was used (http://www.satscan.org/), which identifies geographical units that share extraordinary values with neighbouring units. A circular search window iteratively moves through the map, comparing the average of the attributes inside and outside a window with changing size. The diameter of the window changes from 0 until it contains 50% of the target population, and the clusters are geographically exclusive. The software computes likelihood ratio for the alternative hypothesis that there is an increased risk of ‘event’ inside the circles, which is male birth in this research, and allows the determination of the combination of location and window size at which likelihood ratio is the largest (defined as most likely cluster). Monte Carlo simulation of 999 random replications of the data set is then used to obtain the distribution of likelihood ratios to calculate statistical significance of the most likely cluster. The ‘Bernoulli model’, in which the number of male births was treated as ‘case’ and that of female births as ‘control’, was applied to identify clusters with a significant SSR (Kulldorff, Reference Kulldorff1997).
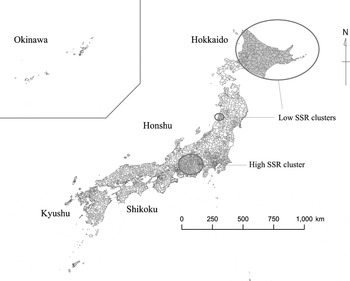
One high-SSR cluster, which included 195 municipalities, and two low-SSR clusters, which included a total of 162 municipalities, were identified 738, 775 and 769 times in 999 simulation runs, respectively (Fig. 1), but none of the clusters was detected more than 950 times (probability of type I error less than 0.05).
Explorative analyses were further conducted by comparing demographic attributes between the high-SSR and low-SSR clusters to examine whether there were environmental factors having an impact on SSR across municipalities. As for the clusters detected more than 500 times in 999 simulation runs, the SSR of the high cluster was 107.6, whereas the SSR of the low clusters was 102.4. The median values of birth reports were 238 (interquartile range: 104.5–641.5) for municipalities included in the high-SSR cluster, and 246.5 (144.75–512.75) for those in the low-SSR clusters, while that of all the Japanese municipalities was 432 (186–1325.5).
High- and low-SSR clusters in Japan. These clusters were detected more than 500 times in 999 SaTScan simulation runs.

The following attributes were compared between the high- and low-SSR clusters on the basis of previous reports: rate of low-birth-weight infants (Rondó et al., Reference Rondó, Ferreira, Nogueira, Ribeiro, Lobert and Artes2003), rate of spontaneous abortions (Nepomnaschy et al., Reference Nepomnaschy, Welch, McConnell, Low, Strassmann and England2006), divorce rate (Booth & Amato, Reference Booth and Amato1991) and unemployment rate (Catalano, Reference Catalano2003). In addition, several other attributes that were available in the vital statistics for the period of time were also compared between the high- and low-SSR clusters to explore demographic attributes associated with the SSR: reproductive attributes (birth rate, total fertility rate, infant mortality, neonatal mortality, perinatal mortality and rate of artificial abortion); adult health attributes (mortality rate (male and female) and life expectancy at birth (male and female)); and a demographic attribute (marital rate). The attributes data were downloaded from the Portal Site of Official Statistics of Japan and were originally collected by the Ministry of Health, Labour and Welfare (National Statistics Centre, n.d.). The government provided total fertility rate and life expectancy at birth estimated by Bayesian correction on age-specific fertility and mortality rates. Secondary health care unit data, including respective municipality, were referred to as prior distribution.
The statistical analysis of the groups was performed with R statistical software (version 2.15.0). An analysis of covariance (ANCOVA) was conducted to test the difference in the attribute variables between high-SSR and low-SSR clusters after controlling for the effect of different population sizes in municipalities. The following population size variables were used as covariates: total population (for birth rate and unemployment rate); male population (for male mortality rate and male life expectancy at birth); female population (for total fertility rate, female mortality rate and female life expectancy at birth); or the number of newborns in the municipality (for low-birth-weight infants, infant mortality rate, perinatal mortality rate, rate of spontaneous abortion, rate of artificial abortion, martial rate and divorce rate). The Bonferroni correction was applied.
All data were log-transformed before analyses. Some municipalities did not have cases of infant death, neonatal death, perinatal death, spontaneous abortion or artificial abortion; 1 was added to all data in order to allow them to be log-transformed.
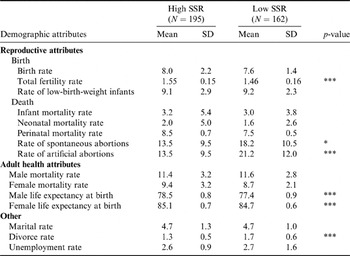
Table 1 shows the results of an ANCOVA. The values of the following attributes were higher in low-SSR than in high-SSR clusters: rate of spontaneous abortion, rate of artificial abortion and divorce rate. Values of the following were lower in high-SSR clusters: male life expectancy, female life expectancy and total fertility rate. When the same analysis was applied to high- and low-SSR groups in the absence of clustering, none of the ANCOVA was statistically significant (data not shown). Specifically, after omitting municipalities whose SSR was less than the 10th percentile or greater than the 90th percentile as outliers, the demographic attributes of the 203 highest and 162 lowest SSR municipalities were compared. The numbers of municipalities in each group were defined based on the numbers of municipalities included in the original analysis, which was conducted in the presence of suggested clusters (not exactly the same due to ties).
Comparison of demographic attributes between high-SSR clusters and low-SSR clusters suggested in the simulation

The clusters were detected more than 500 times in 999 Monte Carlo simulation runs using SaTScan software.
*p<0.05; **p<0.01; ***p<0.001. Statistical significance was calculated after Bonferroni correction; p-values from ANCOVA were multiplied by 15.
The analyses were conducted under the assumption that the SSR decreases with moderate physically or psychologically adverse conditions. The findings of the present study were consistent with this assumption, as higher divorce rates, an indicator of psychological stress, were observed in low-SSR clusters. Additionally, higher rates of spontaneous and artificial abortion and shorter life expectancy (male and female) were observed in the low-SSR compared with high-SSR clusters. Lower total fertility rate was also observed in low-SSR clusters, probably because these clusters are less favourable for childbearing.
In conclusion, a municipality-level analysis indicated that SSR was not geographically clustered in Japan. However, further analyses for the ‘potentially’ high- and low-SSR clusters indicated that certain demographic attributes of municipalities were associated with SSR. Further studies are needed to investigate the association between municipality-level SSR and moderately adverse physical or social environments in Japan.