


Introduction
Stunting remains a major global public health concern, with an estimated 149 million children under 59 months affected.(1) In South Africa, approximately 27% of young children are stunted,(2) with especially high rates in the Eastern Cape Province (ECP).(Reference Kubeka and Modjadji3–Reference Said-Mohamed, Micklesfield, Pettifor and Norris5) In 2020, stunting in ECP was estimated at 24.8% among infants (6–11 months) and 30.9% among children (12–24 months).(2) A study conducted in the rural OR Tambo District Municipality reported 24% of children under five were stunted.(6)
Poor infant and young child feeding (IYCF) practices, including low exclusive breastfeeding (EBF), early introduction of solid foods and low dietary diversity (DD), contribute directly to stunting.(Reference Kubeka and Modjadji3,Reference Massyn, Padarath and Peer4) In the Amathole District, low EBF rates (46.9%) and early complementary feeding have been documented.(Reference Kang, Heidkamp and Mako-Mushaninga7,Reference Osborne, Budge and Bunders-Aelen8) Traditional practices include early feeding of soft porridge made from roasted home-grown maize. Focus group discussions showed that mothers/caregivers believe this strengthens infants, leading to its introduction within weeks after birth.(Reference Osborne, Budge and Bunders-Aelen8,Reference Stroink, Belonje and Budge9) However, unfortified home-grown maize can contribute to micronutrient deficiencies when diets lack diversity. According to WHO guidelines, minimum DD is defined as consumption of at least five of eight food groups in 24 h.(10)
Socio-economic status, such as low maternal education, unemployment, and poor sanitation, may further undermine optimal feeding. Identifying these baseline conditions is essential for designing contextually appropriate interventions. This study, therefore, aims to identify socio-demographic status, anthropometric status, IYCF practices, and DD among infants and young children (0–24 months) in rural Amathole District, ECP. The data inform a culturally specific nutrition education program using behaviour-modification strategies in an effort to improve IYCF.
This situational analysis aligns with global and national priorities for food security and nutrition. During South Africa’s 2025 G20 Presidency, leaders endorsed the Ubuntu Approaches on Food Security and Nutrition, which are grounded in the principles of solidarity and inclusion.(11) It is anticipated that the findings of this analysis will provide the contextual evidence needed to ultimately inform the development of a culturally specific education program, based on the Health Belief Model and tailored for smallholder farming communities. The values of Ubuntu, the education program will aim to support subsistence farming families and promote IYCF practices within the cultural beliefs, available resources and food systems of the rural ECP.
Methods
This study is based on a cross-sectional, quantitative study design. 178 mothers/caregivers-infant/young child (IYC) pairs residing in the Amathole District, ECP were included. Caregivers were defined as individuals who reside in the area and who are primarily responsible for the child’s care, for at least the last six months. Snowball sampling was performed due to the low population density and poor infrastructure. Data collection occurred in five villages, approximately 135 km from East London, within Mnquma Municipality, where approximately 94% of the population speaks isiXhosa and settlement density is low.(Reference Ngumbela, Khalema and Nzimakwe12–14)
Three fieldworkers, trained in standardised procedures, collected data in isiXhosa. A structural socio-demographic questionnaire (capturing education, employment, income, water, and sanitation), a qualitative 24-h dietary recall, and measured anthropometry were used to inform the situational analyses.
A total of 178 mother/caregiver-and-infant pairs (0–23 months of age) were included in the study (N = 178). Trained and standardised fieldworkers administered the socio-demographic and qualitative 24-h recall in face-to-face interviews. Interviews were conducted in isiXhosa. The fieldworkers used standardised prompts to conduct the 24-h recalls, and all information regarding food, beverages, and breast milk consumed during the previous 24-h was reported. Information obtained from the 24-h recalls was used to determine dietary diversity scores (DDS). For children aged 6-23 months (n = 105), consumption across eight WHO food groups: breast milk, grains, roots and tubers; pulses, legumes, nuts and seeds, dairy, flesh foods, eggs, vitamin-A-rich fruits/vegetables, and other fruits/vegetables was considered a high variety.(10) Each group consumed in the past 24 h was scored, with the maximum DDS being 8, and the acceptable DDS being ≥5 groups. EBF and early introduction of complementary feeding were explored in the 0–5-month-old group (n = 73).
Anthropometric measurements were recorded in light clothing and without shoes, according to the WHO and UNICEF standards.(15) Infants were weighed using a digital baby scale (Seca 334), while older children who could already stand independently were weighed using a portable flat scale (Seca 876). The clothes and nappies of all infants and young children were removed before weighing them. Weight was measured to the nearest 100 g with a portable scientific scale (Seca 876, Seca 334), and scales were calibrated once a week. The height of young children aged 12 months and above was measured to the nearest 0.1 cm using a Seca 213 stature metre, while the recumbent length of infants younger than 12 months was measured with a baby length-measuring mat. Height was converted to length by adding 0.7 cm. All measurements were taken twice, and a third measurement was taken when two measurements differed by more than 1 cm. Weight-for-age (WAZ), length-for-age (LAZ) and weight-for-height (WHZ and WHZ) z-scores were computed via WHO Anthro 1.0.(16) MUAC was measured for all infants and young children between the ages of 6–24 months. The MUAC was measured by removing all clothing from the left arm of the child and bending the elbow to 90° (palm facing up). The acromion and the olecranon process were marked with a black marker, and the midpoint between the two landmarks was marked with a black marker. The MUAC was measured by letting the arm hang and wrapping the tape around the midpoint of the arm. The tape measure was flat against the skin, without pulling too tight. The tape measure was a non-stretch tape. MUAC was measured to the nearest millimetre (0.1 cm). MUACs < 115 mm indicated severe acute malnutrition, and circumferences ≥115 mm and <125 mm indicated moderate malnutrition.
Data were analysed using SPSS v. 27. Continuous variables were assessed for normality (Shapiro–Wilk test) and reported as means ± SD or medians and ranges. Categorical variables were summarised with frequencies and percentages. Anthropometric measures were used to determine WAZ, LAZ, and WLZ. In situations where the socio-demographic information was incomplete, Z-scores were implausible, and/or the 24-h recall was not completed, the data were removed and indicated as missing or incorrect data.
This study was conducted according to the guidelines laid down in the Declaration of Helsinki, and all procedures involving participants were approved by the Health Research Ethics Committee (HREC) of North-West University (NWU-00207-14-A1). Written informed consent was obtained from all participants, and verbal goodwill permission was obtained from the traditional leaders.
Results
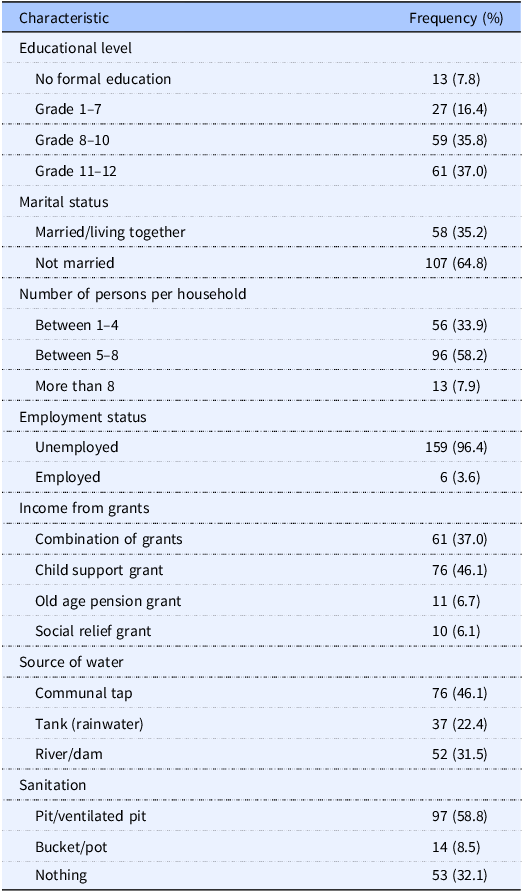
Socio-demographic data were available for 165 mother/caregiver-infant/child pairs (Table 1). Of these, 49 (29.7%) participants were caregivers rather than biological mothers. The majority of caregivers were unmarried (64.8%) and had not completed grade 12 (52.2%). Unemployment was high (96.4%), and most households depended on government grants. Although almost 80% had limited electricity, many lacked safe water and sanitation.
Socio-demographic characteristics of participants

Table 1. Long description
The table presents socio-demographic data for 165 mother/caregiver-infant/child pairs. It has 10 rows and 2 columns. The columns are labeled ‘Characteristic’ and ‘Frequency (%)’. The characteristics include educational level, marital status, number of persons per household, employment status, income from grants, source of water, and sanitation. Each characteristic is broken down into specific categories with corresponding frequencies. For example, under educational level, 13 participants (7.8 percent) have no formal education, 27 (16.4 percent) completed grades 1-7, 59 (35.8 percent) completed grades 8-10, and 61 (37.0 percent) completed grades 11-12. Marital status shows 58 participants (35.2 percent) are married/living together, and 107 (64.8 percent) are not married. Household size indicates 56 households (33.9 percent) have 1-4 persons, 96 (58.2 percent) have 5-8 persons, and 13 (7.9 percent) have more than 8 persons. Employment status reveals 159 participants (96.4 percent) are unemployed, and 6 (3.6 percent) are employed. Income from grants includes 61 participants (37.0 percent) receiving a combination of grants, 76 (46.1 percent) receiving a child support grant, 11 (6.7 percent) receiving an old age pension grant, and 10 (6.1 percent) receiving a social relief grant. Source of water shows 76 participants (46.1 percent) use a communal tap, 37 (22.4 percent) use a tank (rainwater), and 52 (31.5 percent) use a river/dam. Sanitation methods include 97 participants (58.8 percent) using a pit/ventilated pit, 14 (8.5 percent) using a bucket/pot, and 53 (32.1 percent) using nothing.
Anthropometric measures were included for 178 IYC (92 boys and 81 girls) with a mean age of 10.0 ± 7.3 months. Stunting (LAZ, <−2 SD) was observed in 36 children (20.9%); most stunted children (56%) were aged 12–24 months. Underweight (WAZ, <−2 SD) was rare (2.3%), but 14.5% were overweight. Two children were moderately wasted (WLZ, <−2 SD and >−3 SD), and 6 (3.5%) had MUAC < 115 mm, and 11.1% had a MUAC between 115 and 125 mm.
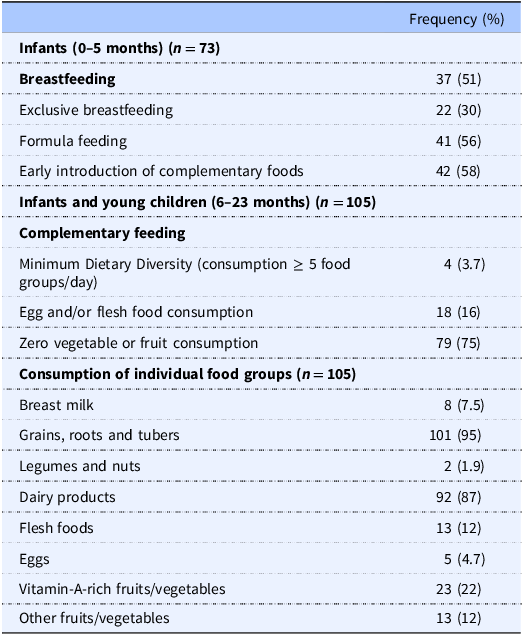
Feeding practices and DDS results are shown in Table 2. Among infants 0–5 months (n = 73), only 30% were exclusively breastfed, and 58% had early introduction of complementary foods (mainly home-grown maize porridge or commercial infant cereal). The mean age of introducing complementary feeding was 3.6 (±1.5) months.
Feeding practices and dietary diversity scores of infants and young children

Table 2. Long description
A table comparing feeding practices and dietary diversity scores of infants and young children. The table has two main sections: one for infants aged 0-5 months and another for infants and young children aged 6-23 months. The first section includes data on breastfeeding, exclusive breastfeeding, formula feeding, and early introduction of complementary foods. The second section focuses on complementary feeding, including minimum dietary diversity, egg and/or flesh food consumption, and zero vegetable or fruit consumption. It also lists the consumption of individual food groups such as breast milk, grains, legumes, dairy products, flesh foods, eggs, vitamin-A-rich fruits/vegetables, and other fruits/vegetables. Row 1: Infants (0-5 months) (n = 73), Breastfeeding, 37 (51 percent). Row 2: Infants (0-5 months) (n = 73), Exclusive breastfeeding, 22 (30 percent). Row 3: Infants (0-5 months) (n = 73), Formula feeding, 41 (56 percent). Row 4: Infants (0-5 months) (n = 73), Early introduction of complementary foods, 42 (58 percent). Row 5: Infants and young children (6-23 months) (n = 105), Complementary feeding, Minimum Dietary Diversity (consumption ≥ 5 food groups/day), 4 (3.7 percent). Row 6: Infants and young children (6-23 months) (n = 105), Complementary feeding, Egg and/or flesh food consumption, 18 (16 percent). Row 7: Infants and young children (6-23 months) (n = 105), Complementary feeding, Zero vegetable or fruit consumption, 79 (75 percent). Row 8: Consumption of individual food groups (n = 105), Breast milk, 8 (7.5 percent). Row 9: Consumption of individual food groups (n = 105), Grains, roots and tubers, 101 (95 percent). Row 10: Consumption of individual food groups (n = 105), Legumes and nuts, 2 (1.9 percent). Row 11: Consumption of individual food groups (n = 105), Dairy products, 92 (87 percent). Row 12: Consumption of individual food groups (n = 105), Flesh foods, 13 (12 percent). Row 13: Consumption of individual food groups (n = 105), Eggs, 5 (4.7 percent). Row 14: Consumption of individual food groups (n = 105), Vitamin-A-rich fruits/vegetables, 23 (22 percent). Row 15: Consumption of individual food groups (n = 105), Other fruits/vegetables, 13 (12 percent).
In the 6–23-month group (n = 105), only 4 children (3.7%) met the WHO-defined minimum DD (≥5 food groups). Breast milk consumption was low (7.5%), while grains, roots, and tubers were nearly universal (95%). However, consumption of eggs (4.7%), flesh foods (12%), and fruits and vegetables was limited. Although most of the children reportedly consumed dairy products (87%), it was mostly from infant formula.
Discussion
This baseline report identifies socio-demographic factors and feeding challenges in rural ECP villages. The prevalence of stunting in this homogeneous, subsistence-farming population underscores chronic undernutrition, despite the prevalence of overweight. The stunting prevalence of 20.9% is, however, lower than the national 27%.(2) This double burden reflects a complex nutritional landscape shaped by poverty, limited education, and constrained access to healthy and diverse diets.
Multiple studies have demonstrated strong associations between low maternal education and household income and suboptimal dietary practices, including low DDS.(Reference Kang, Heidkamp and Mako-Mushaninga7–10) These socio-economic vulnerabilities substantially constrain caregivers’ ability to implement optimal infant feeding practices. From grade 8 onwards, the schools in the rural areas are situated in towns, and thus mothers of school-going age are often not available to provide breast milk. In this context, low EBF rates and the early introduction of maize-based porridges are long-standing Xhosa cultural practices.(Reference Osborne, Budge and Bunders-Aelen8,Reference Stroink, Belonje and Budge9,Reference Tshalibe, Rheeder and Alberts17–Reference Zhao, Yu and Tan19) The widely held belief that maize porridge increases infant strength and health further embeds this behaviour,(Reference Osborne, Budge and Bunders-Aelen8,Reference Stroink, Belonje and Budge9) despite potential micronutrient inadequacy. In addition, this population is mostly subsistence farmers and thus the maize porridge consumed is typically unfortified and contaminated with mycotoxins.(Reference Tshalibe, Rheeder and Alberts17) Another reason for low EBF rates is the phenomenon of ‘dirty wind’ (umoya omdaka). It is believed that this traditional illness is caused by an evil spirit and the infant is exposed to this spirit through breastmilk.
In this study, DDS were low, with most children consuming only two food groups in the preceding 24 h. Mostly maize and dairy were consumed, with the latter predominantly from formula milk. Consumption of eggs, meat, legumes, and fruits/vegetables was low, supporting previous reports from this area.(Reference Zhao, Yu and Tan19,Reference Sayed and Schönfeldt20) Furthermore, the Xhosa’s belief that wealth is portrayed by the number and type of animals on the farm results in a low animal protein intake, as infrequently as once a week.
The observed socio-demographic and dietary intake, with associated challenges, indicates the need for a culturally specific education program. The program we intend to develop from this data will be informed by behaviour-change theory (specifically, the Health Belief Model)(Reference Alyafei and Easton-Carr21) to address perceived infant and young child feeding practices, and the benefits of DD, while promoting self-efficacy through locally relevant strategies.(Reference Alyafei and Easton-Carr21)
Moreover, it is anticipated that this new program will align closely with the 2025 G20 global policy momentum,(11) as it will be culturally specific. By embedding local culture, behaviour-change theory, and global solidarity principles (Ubuntu) into the education program, we hope to foster sustainable improvements in feeding practices, reduce mycotoxin exposure, and contribute to food system resilience in line with other international commitments such as the Sustainable Development Goals.(22)
Conclusion
This situational analysis presents baseline data on socio-demographic characteristics, anthropometric status, and IYCF practices in rural, maize-subsistence farming communities of the Amathole District, in the ECP of South Africa. The prevalence of stunting, low EBF, early maize introduction, and low DDS emphasise gaps in child nutrition and food safety.
These findings guided the development of the new culturally specific, behaviour-informed nutrition education program, based on the Health Belief Model and aligned with Ubuntu principles of interdependence and solidarity. Importantly, this initiative resonates with the 2025 G20 Ubuntu Approaches Declaration, which calls for inclusive, resilient food systems that support subsistence farmers, resulting in increased food safety and security.
The report is the first of a four-paper series and describes the process used to develop the new nutrition education program. The program addresses both local needs based on global policy frameworks.
Data availability statement
Data are available upon request.
Acknowledgements
The authors sincerely thank the mothers/caregivers and children who participated in this study, as well as our fieldworkers who helped collect the data.
Author contributions
The study was initiated by MJL (principal supervisor) and H-MB, who led a larger project from which this study emerged. LHN assisted in the analysis and interpretation of the findings. VM was responsible for drafting the first version of the manuscript. MJL, LHN, and H-MB provided critical review and assisted in revising the paper through the writing process. All authors read and approved the final version.
Financial support
The project was funded by the National Research Foundation (NRF) (grant number CSUR13100150603). The funding source was not involved in the project conception, design, data collection, data analysis, interpretation, results, or conclusions.
Competing interests
The authors have declared that they have no conflicts of interest.

 Open access

