Introduction
Cystic echinococcosis (CE) is a zoonotic disease caused by the larvae of Echinococcus granulosus sensu lato (s.l.) when the parasite colonizes its intermediate host (Wen et al., Reference Wen, Vuitton, Tuxun, Li, Vuitton, Zhang and McManus2019). This disease is characterized by fibrous cysts arising from excessive accumulation of the extracellular matrix (ECM), probably secreted in part by hepatic stellate cells (HSCs) (Tsuchida and Friedman, Reference Tsuchida and Friedman2017; Lembarki and El Benna, Reference Lembarki and El Benna2018; Atmaca et al., Reference Atmaca, Gazyagci, Terzi and Sumer2019). As CE progresses, fibrous capsules induce an obstruction of the bile duct and vessels, which ultimately lead to liver failure (Beschin et al., Reference Beschin, De Baetselier and Van Ginderachter2013).
The liver harbours numerous immune cells and is extraordinarily rich in natural killer (NK) cells, which accounts for ~30–50% of total lymphocytes (Heymann and Tacke, Reference Heymann and Tacke2016). NK cells are effector lymphocytes of the innate immune system, which potentially prevent disease progression and formation of tissue lesions (Kubes and Jenne, Reference Kubes and Jenne2018). Additionally, NK cells alleviate liver fibrosis through NKG2D-dependent cytotoxicity and interferon-γ (IFN-γ)-related apoptosis of HSCs, a phenomenon that has been observed in both experimental animal models and patients (Zheng et al., Reference Zheng, Sun and Tian2018). Nitric oxide synthase 2 (NOS2) up-regulated by IFN-γ, produced NO, which has a deleterious effect in the liver during hepatic hydatidosis (Amri et al., Reference Amri, Aissa, Belguendouz, Mezioug and Touil-Boukoffa2007). Thus, there is a need to explore mechanisms by which CE influences NK cells in the liver.
Transforming growth factor-β (TGF-β1) is the most extensively investigated subtype in liver fibrogenesis and is considered an effective profibrotic cytokine (Dewidar et al., Reference Dewidar, Meyer, Dooley and Meindl-Beinker2019; Kisseleva and Brenner, Reference Kisseleva and Brenner2020). TGF-β blocks the effector function of NK cells by inhibiting the mammalian target of rapamycin (mTOR) activation, induced by either IL-2 or IL-15 (Viel et al., Reference Viel, Marcais, Guimaraes, Loftus, Rabilloud, Grau, Degouve, Djebali, Sanlaville, Charrier, Bienvenu, Marie, Caux, Marvel, Town, Huntington, Bartholin, Finlay, Smyth and Walzer2016), which may limit the anti-fibrotic effect of NK cells.
Moreover, TGF-β can also induce senescence, a situation where the cell cycle undergoes a state of arrest due to continuous exposure to stressful conditions (He and Sharpless, Reference He and Sharpless2017). In vitro studies have revealed that TGF-β potentially promoted the secretion of the senescence-associated secretory phenotype (SASP)-related cytokines (including TGF-β) and induced the senescence in hepatocytes, which relied on macrophage-derived TGF-β. In addition, targeting TGF-β signalling with SB525334 could reduce the senescence of hepatocytes (Bird et al., Reference Bird, Müller, Boulter, Vincent, Ridgway, Lopez-Guadamillas, Lu, Jamieson, Govaere, Campbell, Ferreira-Gonzalez, Cole, Hay, Simpson, Clark, Hedley, Clarke, Gentaz, Nixon, Bryce, Kiourtis, Sprangers, Nibbs, Van Rooijen, Bartholin, McGreal, Apte, Barry, Iredale, Clarke, Serrano, Roskams, Sansom and Forbes2018).
As space-occupying lesions, CE may trigger hepatocytes to undergo senescence and promote the activation of HSCs, thus exacerbating liver fibrosis. A previous study reported continuously higher levels of serum TGF-β1 in CE compared to the control (Liu et al., Reference Liu, Abudounnasier, Zhang, Liu, Wang, Yan, Ding, Wen, Yimiti and Ma2016), implicating that TGF-β may be a potential target for the treatment of CE-associated liver fibrosis.
In this study, we speculated that TGF-β played a crucial role in CE-related liver fibrosis and employed a mouse model to assess the effect of CE on liver NK cells. Further, the therapeutic potential of pirfenidone, a pyridone compound that regulates the TGF-β1 synthesis (Seniutkin et al., Reference Seniutkin, Furuya, Luo, Cichocki, Fukushima, Kato, Sugimoto, Matsumoto, Uehara and Rusyn2018), and SB525334, a potent and selective inhibitor of the TGF-β1 receptor (ALK5) (Bird et al., Reference Bird, Müller, Boulter, Vincent, Ridgway, Lopez-Guadamillas, Lu, Jamieson, Govaere, Campbell, Ferreira-Gonzalez, Cole, Hay, Simpson, Clark, Hedley, Clarke, Gentaz, Nixon, Bryce, Kiourtis, Sprangers, Nibbs, Van Rooijen, Bartholin, McGreal, Apte, Barry, Iredale, Clarke, Serrano, Roskams, Sansom and Forbes2018), were evaluated.
Materials and methods
Human tissue
We collected four impaired liver specimens from CE patients during surgery. At the same time, we also collected tissues from patients with liver haemangioma as normal controls. Tissue samples, obtained from sites >2 cm away from the lesion, were regarded as normal controls and confirmed by the pathologist. Liver tissues of five patients with hepatic haemangioma were collected. All the subjects signed a written informed consent form to participate in the study.
Protoscoleces collection and culture
Sheep liver infected with Echinococcus granulosus sensu lato were obtained from a slaughterhouse in Changji, Xinjiang province, China. First, hydatid fluid containing protoscoleces was extracted from cysts using a 50 mL sterile syringe, then transferred to a sterile console. Afterwards, the protoscoleces were cleaned with sterile phosphate-buffered saline (PBS) (Gibico) until the colour changed to white. Clean protoscoleces were cultured in the RPMI-1640 medium (Gibco, containing L-glutamine and supplemented with 8% fetal bovine serum (BI) and 100 U mL−1 penicillin/streptomycin). All protoscoleces were incubated at 37°C under humidified conditions with 5% CO2.
Animal models and medication
C57BL/6 mice were purchased from the Xinjiang Medical University Experimental Animal Centre. The mice ranged from 8 to 12 weeks old (and weighed 18–20 g) at the beginning of the experiments. They were reared in standard conditions devoid of pathogenic bacteria with equal day and night periods. First, mice were anaesthetized with 0.5% pentobarbital sodium salt (Sigma) and fixed on a surgical table. Next, the abdominal skin and peritoneum were disinfected with 75% ethanol and incised with eye scissors. Finally, suspension of protoscoleces and PBS or PBS alone was injected into the Glisson capsule using a 1 mL syringe. The peritoneum and abdominal skin were sutured sequentially with a triangular needle (No. 0, 3/8). Pathological changes in the liver of mice infected with Echinococcus granulosus sensu lato were observed. Liver tissues were extracted on days 30, 60, 90, 120 and 150 post-infection. Notably, we used a total of 60 mice.
While detecting the expression of receptors on the surface of mouse liver NK cells, we used four mice in each of the control and experimental groups. Besides, mouse liver lymphocytes were extracted at 7, 14, 21, 30, 60 and 90 days, respectively, using a total of 72 mice. In the administration stage, 12 model mice were used in both the control and experimental groups, whereby we used a total of 48 animals.
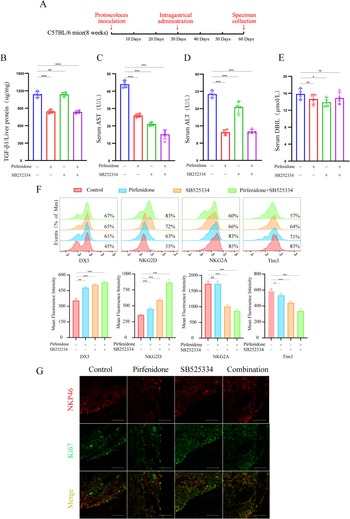
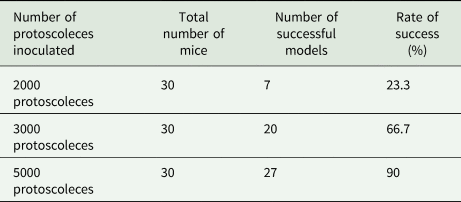
SB525334 (10 mg kg−1; MedChemExpress) and pirfenidone (300 mg kg−1; MedChemExpress) were administered using the oral gavage once a day in 0.5% methyl ether cellulose (the solvent consisted of 10% polyethylene glycol 400, 5% dimethyl sulfoxide and 85% saline). After feeding for a month, the mice inoculated with the protoscoleces were started to administer, in which the used number of protoscoleces was 5000. Subsequently, liver tissue and peripheral blood were extracted from the mice after one month of medication (descriptive design in Fig. 1A). As for the time to start medication, we choose one month after infection as a large amount of loose ECM was deposited around the lesions (Fig. 2D), which could be attributed to better observe the treatment effect. Moreover, the success rate in the 3000 protoscoleces modelling group was 66.7%, whereas that in the 5000 protoscoleces group was 90% (Table 1). Therefore, we choose to inoculate the number of protoscoleces as 5000 to observe the effect of treating CE.
Combination of pirfenidone and SB525334 altered the expression of NK cells’ receptors in mice with CE. (A) Mice were inoculated with 5000 protoscoleces, and pirfenidone and SB525334 were administered one month after infection. Samples were collected after one month of medication. (B) Only the pirfenidone and combination medication groups showing decreased secretion of TGF-β in CE liver tissues. (C) and (D) Compared to the other groups, serum ALT and AST levels are the lowest in the combined medication category. Similar results are evident with the levels of serum DBL. (E) Only SB525334 can reduce the secretion of DBL in the plasma of CE mice. (F) The three treatments elevate the expression of NK cell surface receptors DX5 and NKG2D and reduce the expression of NK cell surface receptor TIM3. Both SB525334 and combined medication can reduce the expression of the NKG2A receptor on the surface of NK cells, but pirfenidone cannot. (G) Proliferative index Ki67of NK cells was an evident increase in the combined drug group compared to both the individual drugs and control groups. Data are representative of one of three independent experiments (n = 3–4 mice per group). One-way ANOVA was used for analysis in (B)–(F), bars represent the mean ± s.e.m. (ns, not significant; *P < 0.05, **P < 0.01, ***P < 0.001).

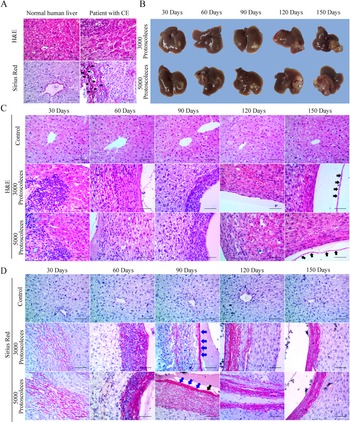
Morphological characteristics of liver and fibrosis in CE patients and mouse models (A) H&E staining showing how hepatocytes were disarranged, cell volume decreased, and the nucleus shrank in the course of CE, compared to the normal human liver tissues. Sirius red staining shows the massive fibrous tissue deposited around the CE-related focus. The red strip indicated by the black arrow was the position of collagen deposition. (B) In CE mouse liver, there is an increase in semi-transparent vesicles. The number and volume of the vesicles are high in both the 3000 and 5000 protoscoleces groups. (C) H&E staining showing that lymphocyte infiltration initially increased but later decreased. Additionally, the lesion area progressively expanded in both the 3000 and 5000 protoscoleces groups. The germinal layer was indicated with short black arrows. (D) Sirius red staining showing the rise of collagen fibres constantly in both number and density during CE in both the 3000 and 5000 protoscoleces groups. The laminated layer was indicated with short blue arrows.
Note: Images for all the sections were taken using a microscope at 40× magnification. Scale bars, 50 μm.

The success rate of modelling with different inoculation number of protoscoleces

Animal tissue harvesting and serum analysis
Mice were anaesthetized with 0.5% pentobarbital sodium salt, then blood was extracted through cardiac puncture. Afterwards, they were euthanized using CO2 before the liver tissue was harvested. Commercial kits were used for serum analysis [ALT (Elabscience), AST (Elabscience), DBL (Direct bilirubin, Nanjing Jiancheng), IL-15/IL-15R (Multi-Science)] according to the manufacturers’ instructions.
Isolation of hepatic lymphocytes
First, the extracted liver was cut into small pieces, then ground continuously on a 200-gauge stainless steel mesh. Using PBS, the mesh was rinsed until the whole tissue was suspended in the solvent. Thereafter, the tissue homogenate was centrifuged at 600 g, the supernatant discarded, and the pellet re-suspended in 40% percoll (GE Healthcare). Finally, the cell suspension was gently overlaid on 70% percoll and centrifuged at 600 g for 30 min at room temperature (Zhou et al., Reference Zhou, Peng, Li, Qu, Wang, Wu, Ye, Dong, Wei, Sun and Tian2019). Hepatic lymphocytes were extracted from the interphase and rinsed twice with PBS.
Flow cytometry analysis
Hepatic lymphocytes were washed with PBS containing 2% BSA. Then, using FACS Aria III flow cytometer (BD Biosciences), we detected the expression of each surface antigen. Unstained and isotype control groups were used as references for the staining category. NK cells were gated as NK1.1 + CD3− and the data was processed in FlowJo V10. 5.3. Antibodies including the NK1.1 monoclonal antibody (clone:PK136, PE-Cyanine7, eBioscience), CD3 monoclonal antibody (clone:17A2, FITC, eBioscience), NKG2D monoclonal antibody (clone:CX5, PE, eBioscience), NKG2AB6 monoclonal antibody (clone:16a11, PE, eBioscience), TIM3 monoclonal antibody (clone:RMT3-23, PE, eBioscience) and CD49b monoclonal antibody (Integrin α2) (clone:DX5, PE, eBioscience) were used.
Histological analysis
Human and mouse liver tissues were fixed in 4% polyoxymethylene for 24 h and embedded in paraffin. Afterwards, tissue sections were deparaffinized, stained with haematoxylin–eosin (H&E), and examined under a light microscope. Furthermore, 4-μm-thick paraffin sections were stained with H&E (Solarbio) to examine the general morphology or with Sirius red (Solarbio) to assess collagen deposition. β-Galactosidase staining kit was used to detect the activity of SA-β-gal based on the manufacturer's protocol (Solarbio). Briefly, liver tissue was fixed in 4% polyoxymethylene (Biosharp) for 4 h then soaked in the β-galactosidase staining solution for 24 h in a constant shaker at 37°C. Thereafter, stained tissue was embedded in paraffin, sliced, and counterstained with eosin. Images of all the stained sections were taken using the microscope camera system (ZESS, Axio Imager 2).
Immunohistochemistry and immunofluorescence
Experiments were performed following the procedures recommended on the Abcam official website (https://www.abcam.cn/protocols). The antibodies included the anti-α smooth muscle actin rabbit monoclonal antibody (#ab124964, clone:EPR5368, Abcam), anti-p53 mouse monoclonal antibody (#ab26, clone:PAb 240, Abcam) and goat anti-mouse IgG H&L (HRP) (#ab205719, Abcam).
Notably, the difference between the immunohistochemistry and immunofluorescence protocol was the conjugation of the secondary antibodies and the application of DAPI Fluoromount-GTM (Southern Biotechnology). Antibodies used included; anti-p53 mouse monoclonal antibody (#ab26, clone:PAb 240, Abcam), anti-p21 mouse monoclonal antibody (#AP021, clone F-5, Beyotime), anti-cytochrome P450 2D6 rabbit polyclonal antibody (#DF4758, affinity), anti-TGF-β1 rabbit polyclonal antibody (#ab92486, Abcam), anti-NKp46 rabbit polyclonal antibody (#orb13333, Biorbyt), anti-F4/80 rat monoclonal antibody (#14-4801-82, clone:BM8, eBioscience), anti-Ki-67 rat monoclonal antibody (#14-5698-82, clone:SolA15, eBioscience), goat anti-rat IgG (H + L) secondary antibody (#A18866, FITC, Invitrogen), goat anti-rabbit IgG (H + L) secondary antibody (#37670, Rhodamine, Invitrogen) and goat anti-mouse IgG (H + L) highly cross-adsorbed secondary antibody (#A16079, FITC, Invitrogen). Sections were scanned using the ZEISS Laser Scanning Microscope (LSM 800, ZEISS).
Immunoblotting and ELISA
Whole mouse liver tissue was grounded using the tissue homogenizer and re-suspended in lysis buffer (containing RIPA, PMSF, and protease inhibitor cocktail at a ratio of 100:1:1) for 30 min. All procedures were performed at 4°C. After centrifuging the tissue homogenate at 600 g, the supernatant consisted of the required protein mixture whose concentration was determined using the NanoDrop 2000 (Thermo Fisher Scientific). Then, equal amounts of total protein (~20 μg) were electrophoresed in 8–15% SDS–polyacrylamide gels (Solarbio) and transferred onto an Immobilon-P PVDF (Millipore, 0.22 and 0.45 μm). Protein bands were visualized on the ChemiDoc XRS + imager (Bio-Rad). The following antibodies were used and diluted according to the manufactures’ recommendations: anti-p53 rabbit polyclonal antibody (# AF0879, affinity), anti-p21 mouse monoclonal antibody (#AP021, clone F-5, Beyotime), anti-CDKN2A/p16INK4a rabbit monoclonal antibody (#ab108349, clone:EPR1473, Abcam), anti-α smooth muscle actin rabbit monoclonal antibody (#ab124964, clone:EPR5368, Abcam), anti-TGF-β receptor I rabbit polyclonal antibody (#ab31013, Abcam), anti-TGF-β receptor II rabbit polyclonal antibody (#ab186838, Abcam), anti-collagen I rabbit monoclonal antibody (#ab6308, clone:COL-1, Abcam), anti-collagen III rabbit polyclonal antibody (#ab7778, Abcam), anti-MMP1 rabbit polyclonal antibody (#ab137332, Abcam), anti-TIMP1 monoclonal antibody (#MA1-773, clone:EPR5368, Thermo Fisher Scientific), goat anti-mouse IgG H&L (HRP) (#ab205719, Abcam), goat anti-mouse IgG H&L (HRP) (#ab205719, Abcam) and anti-β-actin mouse mAb (#AM4302, clone:AC-15, Cell Signalling Technology).
The ELISA kit (Multi-Science) was used to detect the secretion of cytokine TGF-β1 in liver tissue protein. The concentration of protein mixtures was adjusted to 50 μg μL−1. All procedures were performed according to the manufacturer's instructions. Finally, we determined the optical density using the Thermo Scientific Varioskan LUX.
Statistical analysis
One-way analysis of variance (ANOVA) was used to assess significance when there were more than two groups. All statistical data were analysed using the IBM SPSS Statistics 20, whereas GraphPad Prism 8.3.0 (538) was utilized to generate diagrams. All data are presented as the mean ± standard error of the mean (s.e.m.). Statistical significance levels were set at *P < 0.05, **P < 0.01 and ***P < 0.001.
Results
Echinococcus granulosus sensu lato causes the infiltration of lymphocytes and the formation of dense fibrous tissue
HE and Sirius Red staining were used for histomorphology. The H&E staining results showed that more lymphocytes were infiltrated in the liver of CE patients compared to the normal samples. Sirius red staining revealed that substantially more collagen was deposited in CE liver tissues compared to the normal samples (Fig. 2A). Moreover, mouse models were used to systematically and comprehensively evaluate the entire process involved in the course of liver infection. We thus injected 3000 and 5000 protoscoleces, respectively, into the Glisson capsule. Within an infection period of 90 days, a limited progression of CE vesicles at the site of injection was reported. However, when the focus was expanded to the surrounding areas as the infection progressed, the results showed that CE was a prolonged and progressive disease (Fig. 2B).
Furthermore, H&E staining revealed that a substantial amount of lymphocytes infiltrated around lesions in the 3000 and 5000 protoscoleces groups after 30 days of infection. However, the number of lymphocytes infiltrated around the lesions continuously decreased with the progression of CE. Scattered lymphocytes and closely arranged fibroblasts could be seen around the injured areas after 120 and 150 days of infection. The H&E staining results also showed that the degree of inflammatory response assumed a downward trend, whereas tissue congestion presented was pronounced 120 days after infection (Fig. 2C).
On the other hand, the Sirius Red stained liver sections revealed the formation of loose collagen fibrils 30 days post-infection. Afterwards, the fibrous tissue increased, became denser, and eventually formed a monolayer (Fig. 2D).
Echinococcus granulosus sensu lato alters the expression of NK cells surface receptor in the liver of the mouse model
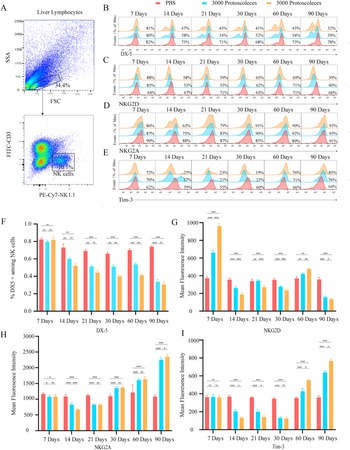
To evaluate the impact of CE on NK cells in the liver, gate NK1.1+ CD3 was selected as the NK phenotype (Fig. 3A). NK cells can be classified into two subsets based on the expression of CD49 a and DX5: DX5+ CD49a− cells are considered circulating or conventional NK cells, whereas DX5− CD49+ cells are classed as liver-resident NK cells (Peng et al., Reference Peng, Wisse and Tian2016). Our work showed that the proportion of circulating conventional NK cells decreased in both the 3000 and 5000 protoscoleces groups at 14 days after infection but was later steadily maintained at low levels and reached the lowest point on the 90th day (Fig. 3B), which was highlighted in a bar chart (Fig. 3F). This appeared to be the consequence of a steady rise, in the infected groups between days 14 and 90, of a novel population of DX (low/negative) NK1.1+ cells. Cells with this phenotype are usually considered to be liver-resident NK cells. It may be that the in situ immune response of the liver induced a reactivity increase of the liver-resident NK cells.
Up-regulated activating receptors and down-regulated inhibitory receptors in NK cells from mice with CE (A) NK cells detected from extracted liver lymphocytes through flow cytometry and NK1.1+ CD3− chosen as the gate. (B) A histogram showing the percentage of DX5+ NK cells, which reveals a continuous decrease in the proportion of DX5+ NK cells in the liver in both the 3000 and 5000 protoscoleces groups compared to the controls. (C) A histogram depicting the distribution of intensity in fluorescence; the expression of activating receptor NKG2D in NK cells increased on day 7 after infection but remained at low levels afterwards in both the 3000 and 5000 protoscoleces groups, compared to the control. (D) and (E) Histograms displaying the distribution of intensity in fluorescence; the expression of the inhibitory receptor TIM3 and NKG2A initially decreased and then increased in both the 3000 and 5000 protoscoleces groups, compared to the control. (F)–(I) To intuitively highlight the change in trend, bar graphs corresponding to (B)–(E), respectively, were drawn. Data are representative of one of three independent experiments (n = 3–4 mice per group). One-way ANOVA was used for analysis in (E)–(I), bars represent the mean ± s.e.m. (ns, not significant; *P < 0.05, **P < 0.01, ***P < 0.001).

NKG2D is a marker for NK cell activation. It triggers apoptosis in HSCs by interacting with ligands on their surface to alleviate liver fibrosis (Fasbender et al., Reference Fasbender, Widera, Hengstler and Watzl2016). In this study, NKG2D expression reached its peak on the 7th day, but then presented a decreasing trend except on the 60th day in both the 3000 and 5000 protoscoleces groups. On the 90th day, the expression of NKG2D reached its lowest point in both groups, indicating the diminished ability of NK cells to limit liver fibrosis (Fig. 3C and G).
Previous reports show that the expression of NKG2A has an inhibitory effect on NK cell's effector function (Andre et al., Reference Andre, Denis, Soulas, Bourbon-Caillet, Lopez, Arnoux, Blery, Bonnafous, Gauthier, Morel, Rossi, Remark, Breso, Bonnet, Habif, Guia, Lalanne, Hoffmann, Lantz, Fayette, Boyer-Chammard, Zerbib, Dodion, Ghadially, Jure-Kunkel, Morel, Herbst, Narni-Mancinelli, Cohen and Vivier2018). Herein, we revealed that NKG2A expression declined in CE 7–21 days after infection, compared to the controls in both the 3000 and 5000 protoscoleces groups. However, the expression of NKG2A was continuously up-regulated between days 30 and 90 in both groups (Fig. 3D and H).
TIM-3 is considered a receptor that exerts inhibitory effects on the function of NK cells (Li et al., Reference Li, Zhou, Tao, Wang, Jiang, Zhang, Piao, Fu, Li and Du2016) and hinders NK cell-mediated cytotoxicity (Ndhlovu et al., Reference Ndhlovu, Lopez-Vergès, Barbour, Jones, Jha, Long, Schoeffler, Fujita, Nixon and Lanier2012). Also, it was reported that blocking the TIM-3 pathway could enhance the ability of NK cells to produce IFN-γ (Cheng et al., Reference Cheng, Ren, Zhao, Wang, Zhou, Li, Moorman and Yao2015). In the present research, we showed that the inhibitory signal TIM-3 was gradually down-regulated between the 7th and 30th day but was up-regulated between the 60th and 90th day in both the 3000 and 5000 protoscoleces groups (Fig. 3E and I).
Echinococcus granulosus sensu lato boosts the secretion of cytokines IL-15 and TGF-β1
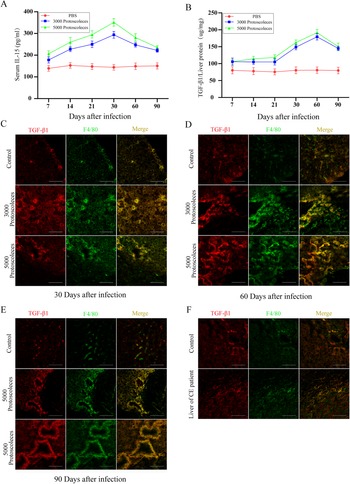
Previous reports demonstrated that IL-15 could impede liver fibrosis (Jiao et al., Reference Jiao, Ooka, Fey, Fiel, Rahmman, Kojima, Hoshida, Chen, de Paula, Vetter, Sastre, Lee, Lee, Bansal, Friedman, Merad and Aloman2016), while TGF-β exerted the inverse effect (Zhang et al., Reference Zhang, Han, Zhang, Zheng, Hu, Yao, Cui, Shu, Si, Li, Shi, Chen, Han, Chang, Yao, Han and Hong2017). In this study, there were higher levels of IL-15 secretion from day 7 with maximum levels on day 30 in both experimental groups, compared to the control. However, a downward trend in the secretion levels of IL-15 in CE was observed afterwards in both groups, although the levels were persistently higher than that of the control group during the entire duration of infection (Fig. 4A).
Increased secretion of IL-15 and TGF-β in the mouse liver with CE. (A) Secretion of IL-15 in serum at peak on the 30th day after infection and is maintained at high levels 90 days after infection in both the 3000 and 5000 protoscoleces groups, compared to the control. (B) The secretion of TGF-β in liver tissues at a maximum of 60 days after infection and is up-regulated within 90 days of infection in both the 3000 and 5000 protoscoleces groups, compared to the control. (C)–(F) Immunofluorescence showing that TGF-β1 mainly originated from macrophages in both mouse and human liver after developing CE.
Note: Images for all the sections were taken using a microscope at 40× magnification. Scale bars, 50 μm. Data in (A) are representative of one of three independent experiments (n = 3–4 mice per group), bars represent the mean ± s.e.m.

Similar to findings from previous studies (Liu et al., Reference Liu, Abudounnasier, Zhang, Liu, Wang, Yan, Ding, Wen, Yimiti and Ma2016), the secretion levels of TGF-β1 were continuously higher than that of the control group and reached a peak on the 60th day after infection (Fig. 4B). Given that elevated secretion of TGF-β in the liver mainly occurred between days 30 and 90 post-infection, immunofluorescence was used to verify this excessive secretion was mainly derived from the macrophages in both patients and mice with CE (Fig. 4C–F).
Echinococcus granulosus sensu lato induces the activation of HSCs and senescence in hepatocytes
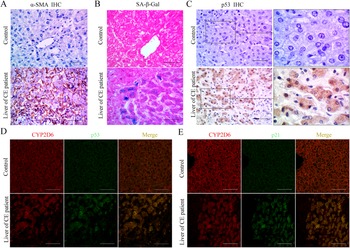
Immunohistochemical staining revealed that α-SMA was over-expressed in the liver tissue sections of CE patients. Our work showed that α-SMA, a marker of activated HSCs, is expressed mainly around the region near the CE-induced lesion (Fig. 5A). Also, senescent hepatocytes induce the activation of hepatic stellate cells (Guo, Reference Guo2017). In this study, we used liver tissues from CE patients to explore the presence of senescent hepatocytes during infection. Generally, cell senescence arises due to the alteration of lysosome activity and involves the expression of senescence-associated-β-galactosidase (SA-β-Gal), which is a marker of cell senescence. Previously, senescent hepatocytes were reported to express similar genes, including p53 (TRP53) and p21 (WAF1) (Hernandez-Segura et al., Reference Hernandez-Segura, Nehme and Demaria2018). Herein immunofluorescent staining revealed that markers of senescence, including SA-β-Gal (Fig. 5B), p53 (Fig. 5C and D) and p21 (Fig. 5E) were up-regulated during infection.
CE patients showed hepatocytes senescence and the activation of HCSs. (A) The high expression of α-SMA showing that activation of HSCs is enhanced in CE patients. (B) Increased activity of SA-β-galactosidase, implying that several hepatocytes became senescent during CE. (C) Immunohistochemistry demonstrating elevated expression of the hepatocyte senescence marker p53 was up-regulated in CE patients. (D) and (E) Immunofluorescence confirming that there was an increase in the expression of the senescence markers p21 and p53 in CE patients.
Note: All of the figures were obtained from a microscopic imaging system at 40× magnification except for figure C, where a magnification of 100× was used. Scale bars, 50 μm.

Pirfenidone and SB525334 relieve the dysfunction of NK cells in CE mouse models
Upon introducing the inhibitor, ELISA results showed that only a combination of pirfenidone and medication (pirfenidone + SB525334) reduced the secretion of TGF-β in liver tissues in the CE mouse model. However, SB525334 exerted no such effect (Fig. 1B).
Liver function was assessed by testing such markers as serum ALT, AST and direct bilirubin (Pareek et al., Reference Pareek, Godavarthi, Issarani and Nagori2013). Compared with the control group, all the medication groups can reduce the secretion of AST and ALT in the serum (Fig. 1C and D). For the secretion of DBIL, only the SB525334 medication group reduced the expression (Fig. 1E). To sum up, those results suggested that inhibitors had no detrimental effect on liver function.
Moreover, flow cytometry revealed changes in the expression of receptors on the surface of NK cells. In the pirfenidone medication group, there was an increase in the expression of the activating receptor NKG2D and a down-regulation of the inhibitory receptor TIM3. However, no effect on the expression of the inhibitory receptor NKG2A was reported. In contrast, the SB525334 medication group showed an increase in the expression of the activating receptor NKG2D and a down-regulation of both the inhibitory receptors TIM3 and NKG2A. A combination of both drugs effectively merged the efficacy of the two inhibitors. Notably, all three medications could up-regulate the expression of DX5. However, there was no statistical difference in the therapeutic effect of combined medication and individual drugs (Fig. 1F). Further, combined medication could significantly elevate the expression of proliferation index Ki67 in NK cells compared to the individual drugs (Fig. 1G).
Pirfenidone and SB525334 reduce hepatocyte senescence in CE mouse models
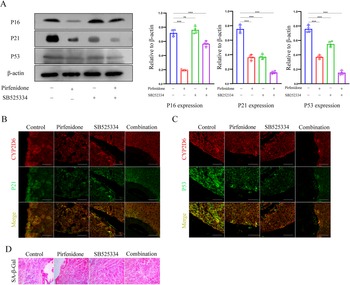
Senescent cells are characterized by an up-regulated expression of proteins p16, p21 and p53, which mediate irreversible growth arrest (He and Sharpless, Reference He and Sharpless2017). Here, similar results were obtained from the western blotting technique. Pirfenidone inhibited the expression p16, p21, p53 although SB525334 merely reduced the expression of p21 and p53. Of note, a combination of pirfenidone and SB525334 showed better results on curbing senescence in hepatocytes (Fig. 6A). Besides, combined medication could significantly lower the expression of ageing-related markers compared to a single medication (Fig. 6B–D).
Combination of pirfenidone and SB525334 reduced the senescence of hepatocytes in mice with CE. (A) Both pirfenidone and combined medication potentially reduced the expression of p16, p21 and p53 (markers of hepatocyte ageing). However, SB525334 could only reduce the expression of p21 and p53. (B) and (C) Immunofluorescence showing that combined medication could reduce the expression of p21 and p53 more effectively compared to both individual drugs and controls. (D) SA-β-Gal staining revealing that combined treatment could more effectively alleviate senescence in hepatocytes compared to the individual drugs. All the images were obtained from a microscopic imaging system at 40× magnification. Data are representative of one of three independent experiments (n = 3–4 mice per group). One-way ANOVA was used for analysis in (A), bars represent the mean ± s.e.m. (ns, not significant; *P < 0.05, **P < 0.01, ***P < 0.001).

Pirfenidone and SB525334 relieve CE-associated fibrosis in mouse models
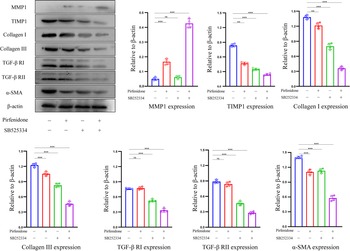
Collagen, a major component of the ECM, is degraded by matrix metalloproteinases (MMPs). However, tissue inhibitors of metalloproteinases (TIMPs) present an inhibitory effect on MMPs (Roeb, Reference Roeb2018). In this study, pirfenidone promoted the production of MMP1 and lowered the expression of TIMP1. Contrarily, SB525334 down-regulated the expression of TIMP1 but exerted no effect on the expression of MMP1. However, a combination of pirfenidone and SB525334 substantially reduced the expression of TIMP1 and elevated the expression of MMP1. Based on these findings, the combination medicine altered the composition of enzymes and this may greatly have impacted the deposition of ECM.
Compared to the control group, combined medication was superior to each of the individual medications in reducing the production of collagen I and III. Pirfenidone did not affect the expression of TGF-β receptors I and II. Also, combined medication more effectively reduced the expression of TGF-β receptors I and II compared to SB525334. Concerning markers of HSCs activation, a combination of pirfenidone and SB525334 had a more potent effect than the individual drugs in curbing the expression of α-SMA (Fig. 7).
The combination of pirfenidone and SB525334 could be relieving CE-related liver fibrosis. Using inhibitors of the TGF-β signalling pathway, immunoblot experiments highlight the expression of fibrosis-related proteins in the liver tissues of CE mice treated with different groups of drugs. Data are representative of one of three independent experiments (n = 3–4 mice per group). One-way ANOVA was used for analysis, bars represent the mean ± s.e.m. (ns, not significant; *P < 0.05, **P < 0.01, ***P < 0.001).

Discussion
CE is a globally prevalent disease that has detrimental impacts on human health and wellbeing (Wen et al., Reference Wen, Vuitton, Tuxun, Li, Vuitton, Zhang and McManus2019). There is a need to elucidate changes in the pathology of CE to provide potential treatment strategies. Through CE examination in the liver tissues, this study revealed a decrease in infiltrated lymphocytes and an increase in both the quantity and density of collagen fibres. Thus, a decrease in the inflammatory response and an increase in fibrous tissue are the main changes that occur during infection.
Besides, histological examination revealed that the fibrous tissue around the hydatid cysts changed from loose to dense, whereas the amount of fibrous tissue continuously increased in the course of infection. These fibrous cysts which resulted from excessive deposition of ECM (Tsochatzis et al., Reference Tsochatzis, Bosch and Burroughs2014), might lead to immune escape by hindering the host's immune response against the parasite (Tamarozzi et al., Reference Tamarozzi, Mariconti, Neumayr and Brunetti2016). We, therefore, concluded that the main treatment strategy would be to inhibit fibrosis as well as reduce the infiltration of lymphocytes around the cysts. We have elaborated these results based on two aspects, anti-fibrosis, and pro-fibrosis.
NK cells possess anti-fibrotic properties since they facilitate the clearance of activated HSCs through NKG2D-dependent cytotoxicity and IFN-γ-related apoptosis (Cordero-Espinoza and Huch, Reference Cordero-Espinoza and Huch2018). NK cells preferentially reverse senescence in activated HSCs in vitro and in vivo, thereby inhibiting the progression of fibrosis (Schrader et al., Reference Schrader, Fallowfield and Iredale2009). Also, NK cells generally perceive changes in their surroundings through a group of innate-receptors. Based on their effects on the function of NK cells, they can be classified as inhibitory and activating receptors. By combining the receptors, integrated signals give rise to cytotoxicity and cytokine production (Long et al., Reference Long, Kim, Liu, Peterson and Rajagopalan2013). Moreover, activated NK cells tend to show elevated levels of active receptors and reduced quantities of inhibitory receptors (Martinet and Smyth, Reference Martinet and Smyth2015).
Generally, the dysfunction of NK cells is characterized by up-regulating inhibitory receptors and down-regulating receptors in some chronic diseases (Zheng et al., Reference Zheng, Sun and Tian2018). In the present work, we reported an increase in the inhibitory receptors Tim-3 and NKG2A, while the activating receptors-NKG2D-decreased. Therefore, NK cells may enter a state of dysfunction. Also, TIM-3 pathway blockade could enhance the ability of NK cells to produce IFN-γ.
IL-15 is a secretory cytokine that plays an essential role in the survival and proliferation of NK cells (Anton et al., Reference Anton, Peterson, Hollander, Dorward, Arora, Traba, Rajagopalan, Snapp, Garcia, Waldmann and Long2020). Previous reports showed that the IL-15/IL-15 receptor α could not only act on HSCs to reduce collagen production, but also prime NK cells to remove activated HSCs (Jiao et al., Reference Jiao, Ooka, Fey, Fiel, Rahmman, Kojima, Hoshida, Chen, de Paula, Vetter, Sastre, Lee, Lee, Bansal, Friedman, Merad and Aloman2016). However, TGF-β blocks the effector function of NK cells by inhibiting the activation of mTOR which is induced by IL-2 or IL-15 (Viel et al., Reference Viel, Marcais, Guimaraes, Loftus, Rabilloud, Grau, Degouve, Djebali, Sanlaville, Charrier, Bienvenu, Marie, Caux, Marvel, Town, Huntington, Bartholin, Finlay, Smyth and Walzer2016). Although the increased secretion of IL-15 was reported in this study, continuously high levels of TGF-β could ultimately hinder the effector function of NK cells. Therefore, we speculated that excess macrophage-derived TGF-β inhibited the anti-fibrotic effect of NK cells in the course of CE infection.
The role of TGF-β in liver fibrosis is based on the fact that it effectively stimulates the activation of HSC as well as ECM secretion (Dewidar et al., Reference Dewidar, Meyer, Dooley and Meindl-Beinker2019). Combined with activated TGF-β, type II receptors recruit and phosphorylate type I receptors. This transmitted signal then leads to phosphorylation of SMAD2/3 proteins. Then, pSMAD2/3 binds to Smad4 and transfers to the nucleus, promoting the expression of related genes (Distler et al., Reference Distler, Gyorfi, Ramanujam, Whitfield, Konigshoff and Lafyatis2019). In liver fibrosis, type IV collagen and the laminin of a constituent ECM shift towards types I and III collagen (Tsuchida and Friedman, Reference Tsuchida and Friedman2017) and are the main changes in pathological fibrous tissues (Roeb, Reference Roeb2018). Through Sirius Red Staining, we revealed that types I and III collagen were the main components surrounding the cysts. Also, TGF-β could inhibit the secretion of IFN-γ and expression of NKG2D on NK cells, hence reducing the anti-fibrotic function of NK cells (Fasbender et al., Reference Fasbender, Widera, Hengstler and Watzl2016). Consequently, it was concluded that the TGF-β pathway may be crucial in liver fibrogenesis.
Senescent hepatocytes may be alternative pro-fibrotic mediators of CE-related liver fibrosis. Senescence is characterized by permanent DNA damage and activation of the SASP. SASP mediates the expression of interleukin-1α (IL-1α) and TGF-β (He and Sharpless, Reference He and Sharpless2017), which can induce and maintain the senescent phenotype in cells (Tominaga and Suzuki, Reference Tominaga and Suzuki2019). Additionally, in vitro studies show that TGF-β may promote the secretion of SASP-related cytokines and enhance senescence in hepatocytes (Albright et al., Reference Albright, Salganik, Craciunescu, Mar and Zeisel2003). Moreover, in vivo studies using a hepatocyte-specific senescence model showed that senescent hepatocytes substantially enhanced the secretion of macrophage-derived TGF-β that could result in further senescence hence forming a feedback loop. However, SB525334, an inhibitor of the TGF-β signalling pathway could reverse this feedback loop (Bird et al., Reference Bird, Müller, Boulter, Vincent, Ridgway, Lopez-Guadamillas, Lu, Jamieson, Govaere, Campbell, Ferreira-Gonzalez, Cole, Hay, Simpson, Clark, Hedley, Clarke, Gentaz, Nixon, Bryce, Kiourtis, Sprangers, Nibbs, Van Rooijen, Bartholin, McGreal, Apte, Barry, Iredale, Clarke, Serrano, Roskams, Sansom and Forbes2018). Senescent hepatocytes also boost the activation of HSCs (Guo, Reference Guo2017). In the present study, a substantial number of hepatocytes became senescent and the secretion of macrophage-derived TGF-β was maintained at a high level. It is, therefore, possible that there was some positive feedback in the course of CE. Based on this evidence, it is highly likely that TGF-β is an essential factor in the progression of CE-related liver fibrosis.
Furthermore, we selected pirfenidone and SB525334 as inhibitors of the TGF-β pathway. Of note, pirfenidone is a pyridone chemical compound and is approved by the Food and Drug Administration (FDA) for the treatment of idiopathic pulmonary fibrosis. More importantly, pirfenidone reduces collagen production related to the TGF-β signalling pathway (Lopez-de la Mora et al., Reference Lopez-de la Mora, Sanchez-Roque, Montoya-Buelna, Sanchez-Enriquez, Lucano-Landeros, Macias-Barragan and Armendariz-Borunda2015). On the other hand, SB525334 inhibits the TGF-β receptor I (ALK5) and was shown to restore hepatocellular senescence in acute liver injury (Bird et al., Reference Bird, Müller, Boulter, Vincent, Ridgway, Lopez-Guadamillas, Lu, Jamieson, Govaere, Campbell, Ferreira-Gonzalez, Cole, Hay, Simpson, Clark, Hedley, Clarke, Gentaz, Nixon, Bryce, Kiourtis, Sprangers, Nibbs, Van Rooijen, Bartholin, McGreal, Apte, Barry, Iredale, Clarke, Serrano, Roskams, Sansom and Forbes2018). A combination of pirfenidone and SB525334 could not only reduce TGF-β secretion but also inhibited the TGF-β signalling pathway.
Besides, in vivo studies showed that pirfenidone could alleviate the progression of liver fibrosis in humans (Flores-Contreras et al., Reference Flores-Contreras, Sandoval-Rodriguez, Mena-Enriquez, Lucano-Landeros, Arellano-Olivera, Alvarez-Alvarez, Sanchez-Parada and Armendariz-Borunda2014). Similarly, we revealed that pirfenidone reduced the secretion of TGF-β1, restricted the activation of hepatic stellate cells, and the production of collagen. To some extent, the decreased levels of TGF-β might partially reverse senescence in hepatocytes and restored both liver and NK-cell functions.
MMPs are the primary enzymes in the degradation of collagen and are mainly produced by macrophages. However, tissue inhibitors of metalloproteinases (TIMP) family, secreted by HSCs reversibly inhibits the activity of MMPs (Gandhi, Reference Gandhi2017). Therefore, the ratio of MMP-to-TIMP determines the progression of liver fibrosis (Bonnans et al., Reference Bonnans, Chou and Werb2014). In this study, it was shown that the levels of MMP1 increased, whereas that of TIMP1 decreased, this was favourable for fibrogenesis. However, upon administration of pirfenidone and SB525334, the ratio of MMP1-to-TIMP1 assumed a reverse trend. Further, a combination of both drugs had the most potent effect on restricting the production of collagen. Besides, a combination of pirfenidone and SB525334 could not only reduce the secretion of TGF-β but also inhibited the TGF-β signalling pathway. The markers related to hepatocyte senescence and activated HCSs were down-regulated. Notably, only pirfenidone reduced the expression of p16 and the secretion of TGF-β1 while, no statistically significant difference was observed in SB525334, compared to the control group. Furthermore, the expression of activation and inhibitory receptors on NK cells showed some extent of a reverse trend. Compared to the control group, the therapeutic effect of combined medication was better than that of the individual drugs. This may be attributed to the combined medication, which could reduce the secretion of TGF in serum as well as block the TGF-β signalling pathway.
In conclusion, the present study, using a mouse model, conducted a complete and systematic analysis of the occurrence and development of CE in Echinococcus granulosus sensu lato infected liver. Notably, pirfenidone and inhibition of TGF-β have been revealed to reduce senescence in hepatocytes, restore the function of NK cells, and relieve CE-associated fibrosis. This process is therapeutically feasible and provides a baseline for the treatment of CE-related fibrosis. However, treatments aimed at the TGF-β pathway may result in an unwanted increase in inflammation or side effect since this signalling pathway plays an essential role in adult tissue homeostasis through regulating cell proliferation (Hata and Chen, Reference Hata and Chen2016). So, studies are warranted to validate their effectiveness and feasibility in patients with CE-related liver fibrosis.
Supplementary material
The supplementary material for this article can be found at https://doi.org/10.1017/S0031182021000287
Acknowledgements
The authors sincerely thank the offered experimental platform from Shihezi University School of Medicine and the financial support from the National Natural Science Foundation of China. We are also extremely grateful for the technical support provided by the corporation of Abcam.
Financial support
This work was supported by the ‘National Natural Science Foundation of China’ (Grant/Award Number: 82060297, 81760371 and 81760570), the ‘XPCC youth science and technology innovation leading talent project’ (Grant/Award Number: 2018CB017), and ‘XPCC science and technology key project’ (Grant/Award Number: 2019AB031).
Conflict of interest
The authors declare that no conflicts of interest exist.
Ethical standards
Ethical approval to conduct both human and animal experiments was granted by the First Affiliated Hospital of Shihezi University, Xinjiang, China (Approval Number: A2017-068-01). Consent was given by the China Clinical Trial Registry, registration number: ChiCTR1900024122. All animal experiments were conducted following the procedural guidelines of animal welfare and ethical review treaties.