1. Introduction
There are two broad models for the origin of silicic magmas (Barbarin, Reference Barbarin1999; Riley et al. Reference Riley, Leat, Pankhurst and Harris2001; Wenner & Coleman, Reference Wenner and Coleman2004). The first model invokes a derivation of silica magma from a basaltic parent by fractional crystallization or a combined process of assimilation and fractional crystallization (Waight, Wiebe, & Krogstad, Reference Waight, Wiebe and Krogstad2007; Shellnutt & Jahn, Reference Shellnutt and Jahn2010). The second model assumes that the silicic magma was generated by partial melting of crustal rocks typically triggered by heat from basaltic magma (Huppert & Sparks, Reference Huppert and Sparks1988; Annen & Sparks, Reference Annen and Sparks2002). The second model is suggested for large silicic magma reservoirs because the fractional crystallization process would require a large volume of a basaltic parental magma. The second model is also used to account for significant compositional variations within large silicic magma bodies (Hyndman, Reference Hyndman1984; Altherr et al. Reference Altherr, Holl, Hegner, Langer and Kreuzer2000; Shellnutt, Jahn & Zhou, Reference Shellnutt, Jahn and Zhou2011). In the case of partial melting, magma heterogeneity may reflect a heterogeneous crustal source. The relative roles of fractional crystallization, crustal assimilation and partial melting during the chemical and physical evolution of the large volumes of silicic magma such as those of granitic plutons and batholiths is debated (Petford et al. Reference Petford, Cruden, McCaffrey and Vigneresse2000; Riley et al. Reference Riley, Leat, Pankhurst and Harris2001; Wenner & Coleman, Reference Wenner and Coleman2004; Waight, Wiebe & Krogstad, 2007).
The Late Devonian South Mountain Batholith (SMB) of Nova Scotia is a composition granitic complex that consists of at least 11 individual plutons ranging in composition from granodiorite to biotite monzogranite to leucomonzogranite to leucogranite. Most of these plutons have been extensively studied, largely because of their economic potential (e.g. U and Sn mineralization). There is general agreement that fractional crystallization was an important process during the formation of the SMB; however, there is debate regarding the extent of upper crustal assimilation of Meguma Supergroup rocks (Eberz et al. Reference Eberz, Clarke, Chatterjee and Giles1991; Dostal & Chatterjee, Reference Dostal and Chatterjee1995, Reference Clarke, Fallon and Heaman2010; Clarke, MacDonald & Tate, Reference Clarke, MacDonald and Tate1997; Clarke, MacDonald & Erdmann, Reference Clarke, MacDonald and Erdmann2004). Clarke, MacDonald & Erdmann (Reference Clarke, MacDonald and Erdmann2004) have suggested that up to 33% crustal assimilation is required to explain the isotopic variability within the SMB, whereas Dostal, Chatterjee & Kontak (Reference Dostal, Chatterjee and Kontak2004) and Dostal & Chatterjee (Reference Dostal and Chatterjee2010) have suggested that a lower amount of crustal assimilation occurred. Glazner (Reference Glazner2007) reported that > 25% crustal assimilation is unlikely to occur in lower energy magma systems such as hydrous granodiorite and would likely be limited to a much lower amount of assimilation. Therefore, it is uncertain if substantial amounts (e.g. ~ 33%) of crustal assimilation can in fact be responsible for some of the chemical variability observed within the SMB.
We present new whole-rock and trace element data of the Salmontail Lake, Scrag Lake and Davis Lake plutons along with previously published data of the SMB in order to assess the relative roles of fractional crystallization and crustal assimilation using the program MELTS. The petrological software MELTS uses experimentally determined major element, temperature, pressure and oxygen fugacity (f O2) calibrations in order to constrain processes (e.g. fractional crystallization) that occur within magmatic systems (Ghiorso & Sack, Reference Ghiorso and Sack1995; Smith & Asimow, Reference Smith and Asimow2005). We apply MELTS modelling to evaluate the effectiveness of fractional crystallization under thermodynamically constrained conditions (e.g. pressure, f O2) in producing the most evolved granites of the SMB and try to determine if substantial amounts (e.g. ~ 33%) of crustal assimilation are required to explain the geochemical variability within the SMB.
2. Geological setting
The Meguma Terrane of southwestern Nova Scotia is composed of the Cambro-Ordovician Meguma Supergroup, Siluro-Devonian White Rock and Torbrook formations and the Late Devonian (~ 375 Ma) South Mountain Batholith (SMB) (Waldron et al. Reference Waldron, White, Barr, Simonetti and Heaman2009). The Meguma Supergroup consists of metapelites of the Halifax Group, which is comformably overlain by metapsammites of the Goldenville Group (Keppie & Dallmeyer, Reference Keppie and Dallmeyer1987; Waldron et al. Reference Waldron, White, Barr, Simonetti and Heaman2009). The White Rock and Torbrook formations comprise metavolcanic and metasedimentary rocks. The Devonian and older rocks were deformed during Mid- to Late Devonian time as they were accreted to the margin of Laurentia at ~ 400 Ma (i.e. Acadian Orogeny). The rocks experienced peak metamorphic conditions of lower greenschist to upper amphibolite facies (Keppie & Muecke, Reference Keppie and Muecke1979; Keppie & Dallmeyer, Reference Keppie and Dallmeyer1995; Hicks, Jamieson & Reynolds, Reference Hicks, Jamieson and Reynolds1999).
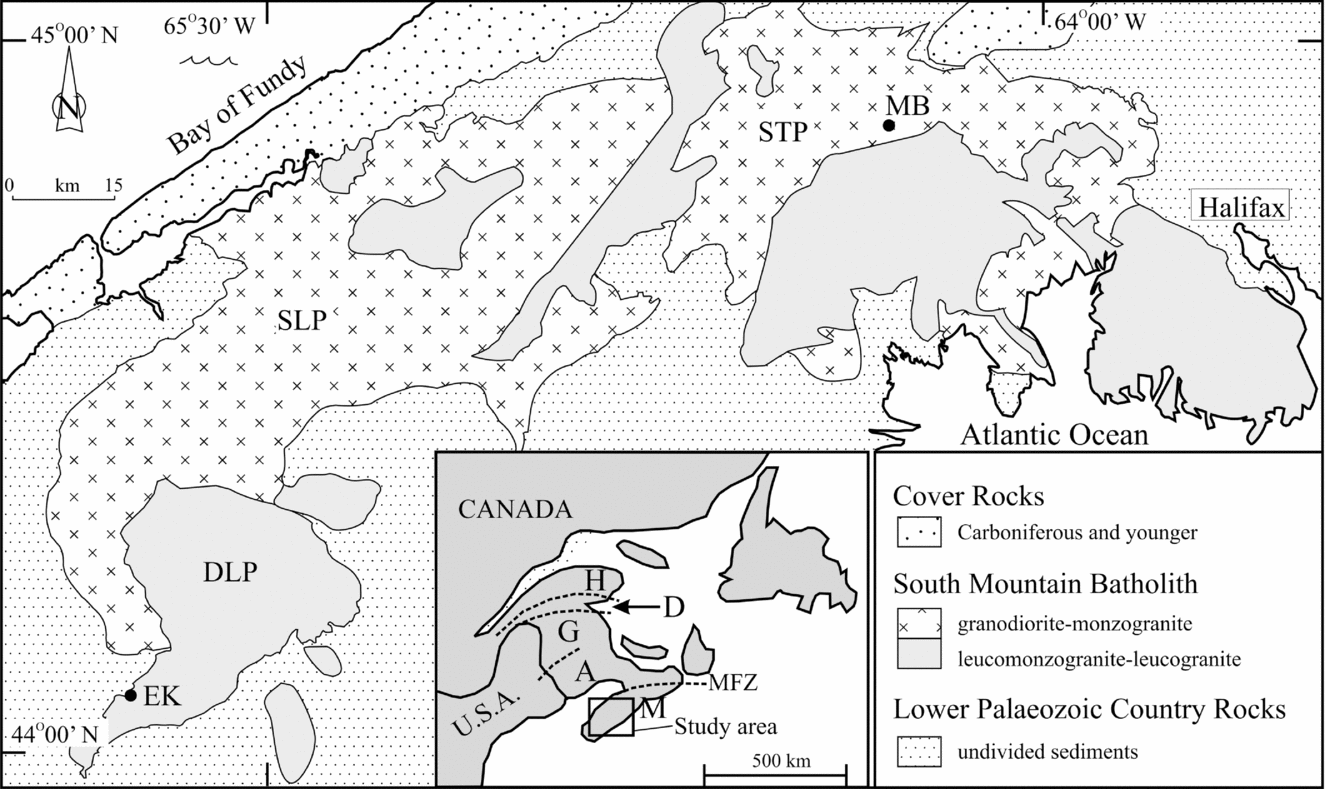
Intruding the rocks of the Meguma Supergroup and White Rock and Torbrook formations is the SMB. The SMB is a post-orogenic composite intrusion that consists of at least 11 contemporaneous intermediate to felsic plutons which cover an area of ~ 7300 km2 making it the largest batholith of the Appalachians (MacDonald et al. Reference MacDonald, Corey, Ham and Horne1992). The location and distribution of the plutons is shown in Figure 1. The single largest pluton is the Scrag Lake pluton (SLP), which represents approximately one third of the entire SMB. Although smaller than the Scrag Lake pluton, the Davis Lake pluton (DLP) and Salmontail Lake pluton (STP) are of particular interest because they host economic quantities of Sn and U, respectively (Richardson, Spooner & McAuslan, Reference Richardson, Spooner and McAuslan1982; Chatterjee & Strong, Reference Chatterjee and Strong1984; Halter, Williams-Jones & Kontak, Reference Halter, Williams-Jones and Kontak1998; Chatterjee & Dostal, Reference Chatterjee and Dostal2002).
Geological map of southwestern Nova Scotia showing the distribution of the South Mountain Batholith. STP – Salmontail Lake pluton; SLP – Scrag Lake pluton; DLP – Davis Lake pluton. MB – location of Millet Brook U deposit; EK – location of East Kemptville Sn deposit. M – Meguma Zone; A – Avalon Zone; G – Gander Zone; D – Dunnage Zone; H – Humber Zone; MFZ – Minas fault zone.

The SMB is overlain by Lower Carboniferous sedimentary rocks of the Horton Group, which constrains the timing of exhumation to ~ 10 Ma (Keppie & Dallmeyer, Reference Keppie and Dallmeyer1987; Murphy, Reference Murphy2000). The relatively rapid rate of uplift and erosion of material is attributed to the final stages of collision between the Meguma and Avalon terranes (Dostal & Chatterjee, Reference Dostal and Chatterjee2010). Contemporaneous with the SMB are small (10 to 100 m) mafic dykes, which range in composition from gabbroic to dioritic and lamprophyric (Tate & Clarke, Reference Tate and Clarke1995; Clarke, MacDonald & Tate, Reference Clarke, MacDonald and Tate1997). The mafic rocks are volumetrically minor and are sporadically found within coastal exposures.
The plutons of the SMB range in composition from granodiorite to biotite monzogranite to leucomonzogranite to leucogranite and are estimated to have been emplaced at a depth of 10 to 12 km (Clarke, MacDonald & Tate, Reference Clarke, MacDonald and Tate1997). The granodiorite is medium to coarse grained and composed of plagioclase (An37–17), alkali feldspar, quartz and biotite (10 to 20 vol. %). Accessory minerals include ilmenite, apatite, zircon, muscovite, cordierite, sulphides (chalcopyrite, pyrite, pyrrhotite), monazite and rutile. The primary difference between the granodiorite and the biotite monzogranite is the smaller amount of biotite (< 15%) in the monzogranite. The leucomonzogranite contains megacrysts of perthitic alkali feldspar; however, the rock primarily contains fine- to coarse-grained plagioclase (An20–10), quartz and < 8% biotite. The accessory minerals are similar to the granodiorite, although fluorite and garnet are reported and muscovite and sulphides are absent. The leucogranite is fine to medium grained with K-feldspar, quartz, plagioclase (albite) and minor amounts of biotite (< 2%), muscovite and topaz. Accessory minerals include, fluorite, zircon, monazite, Fe-Ti oxides, apatite, Nb-Ta oxides, uraninite and sulphide minerals (cassiterite, sphalerite, pyrite, chalcopyrite, pyrrhotite). The leucogranites are commonly altered and greisenized. The petrography of the SMB is described in detail by Smith et al. (Reference Smith, Peck, Huang and Holm1986) and MacDonald et al. (Reference MacDonald, Corey, Ham and Horne1992).
3. Analytical methods
Samples were selected for chemical analysis from the three major constituent plutons (Scrag Lake = 79 samples; Salmontail Lake = 8 samples; Davis Lake = 19 samples), which are representative of the main magmatic pulses of the SMB. In addition to the new data, over 550 previously published analyses of the entire SMB were used for geochemical interpretation (NSDNRMRB, 2006). The Scrag Lake and Salmontail Lake plutons are representative of the first stage plutons, which are composed mainly of granodiorites and biotite monzogranites. The Davis Lake pluton, typical of the second stage plutons, is predominantly made of leucomonzogranites. The major elements and the trace elements Rb, Ba, Sr, Zr, Nb, Y, Ga, Cr, Ni, V, Cu and Zn were analysed by X-ray fluorescence methods at the Regional Geochemical Centre, Saint Mary's University (see online Appendix at http://journals.cambridge.org/geo). Precision is generally better than 2% for the major oxides and between 5 and 10% for trace elements. REE, Ta, Nb, Th and Hf were determined by inductively coupled plasma mass spectrometry (ICP-MS) using Na2O2 sinter fusion at the Memorial University of Newfoundland. The precision is between 2 and 4%. Longerich et al. (Reference Longerich, Jenner, Fryer and Jackson1990) reported details of the ICP-MS analytical procedure.
4. Results
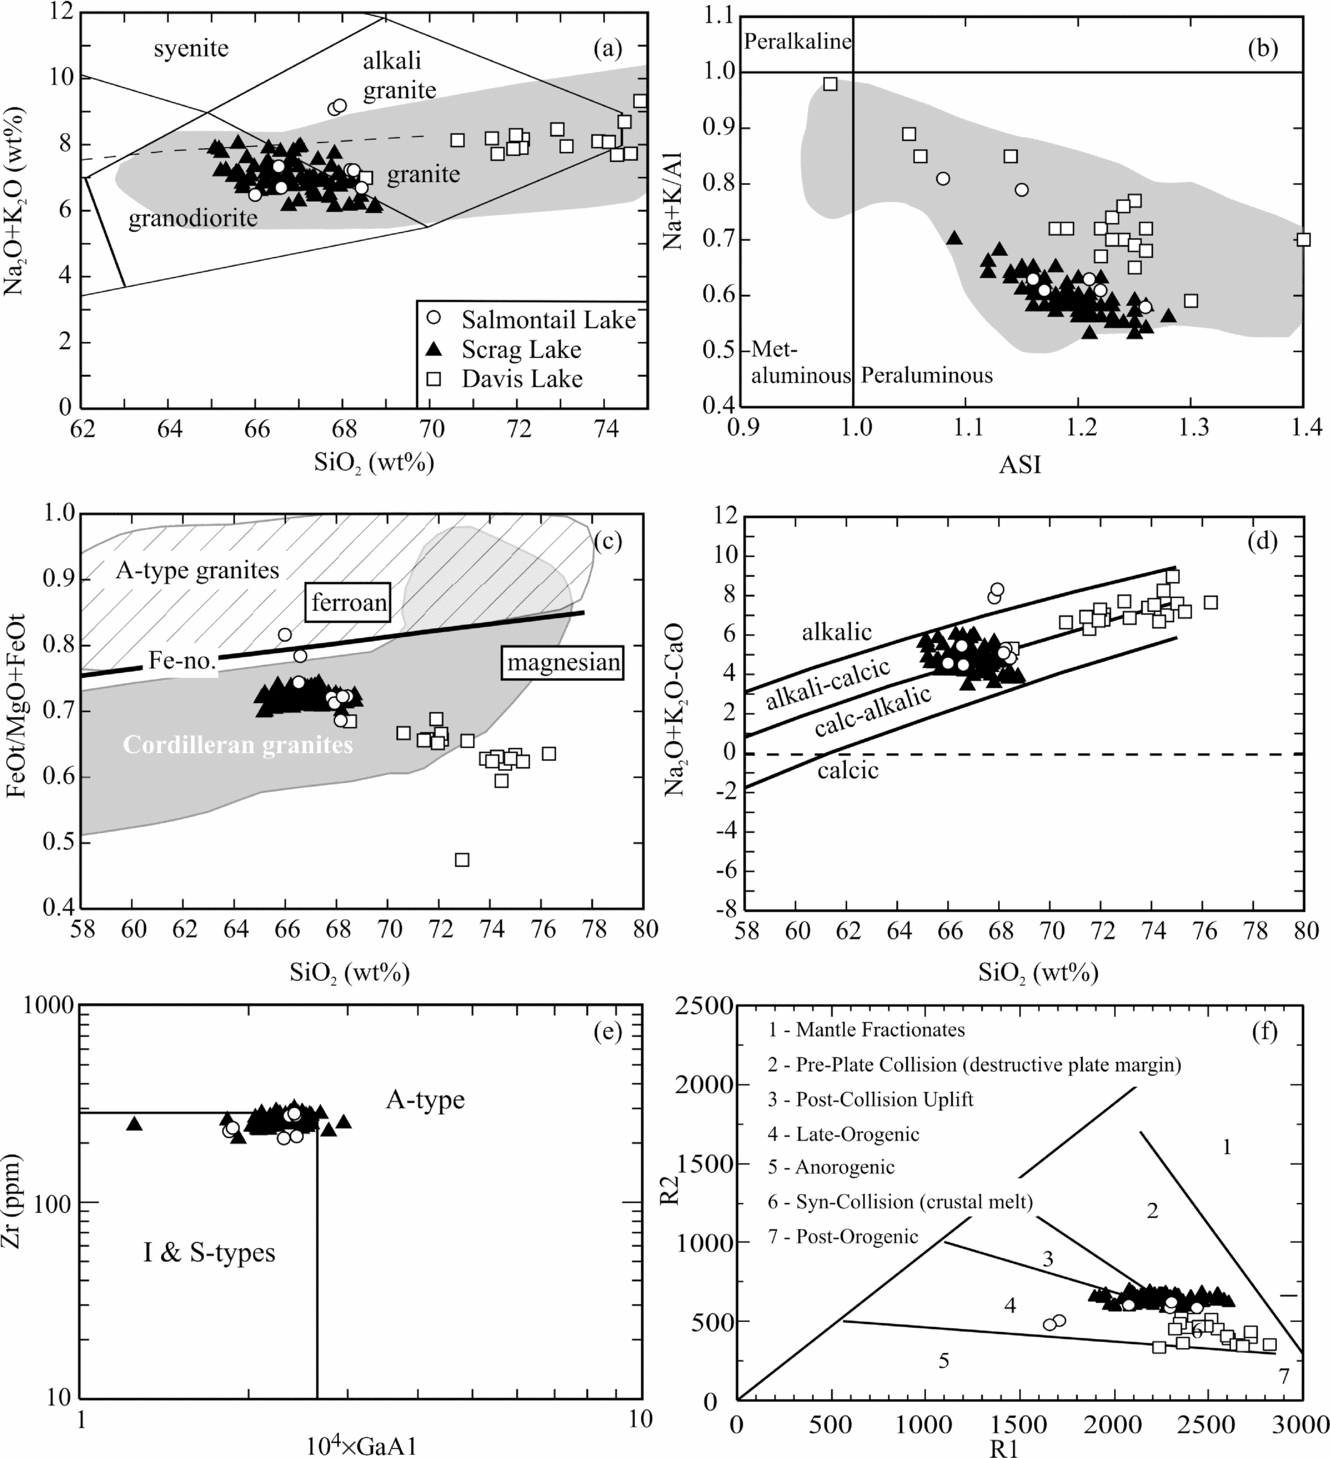
The granitoids of the SMB are mostly peraluminous and classify as magnesian, alkali-calcic to calc-alkalic according to the classification scheme of Frost et al. (Reference Frost, Barnes, Collins, Arculus, Ellis and Frost2001) and have Ga/Al ratios similar to I- and S-type granitoids (Fig. 2). The tectonomagmatic discrimination diagram of Batchelor & Bowden (Reference Batchelor and Bowden1985) indicates that the granitic rocks of the SMB are chemically similar to granites derived by crustal melting (Fig. 2f).
Classification of the STP, SLP and DLP plutons. (a) Total alkalis versus SiO2 wt% (Wilson, Reference Wilson1989). The grey field is the range of the SMB data. (b) Alkali-alumina ratio versus ASI (Al/(Ca−1.67P+Na+K)). The grey field is the range of SMB data. (c) Fe* = FeOt/(FeOt+MgO) versus SiO2 wt% (Frost et al. Reference Frost, Barnes, Collins, Arculus, Ellis and Frost2001). (d) Modified alkali-lime index versus SiO2 wt% (Frost et al. Reference Frost, Barnes, Collins, Arculus, Ellis and Frost2001). (e) Zr versus 104×Ga/Al classification of Whalen, Currie & Chappell (Reference Whalen, Currie and Chappell1987). (f) Tectonomagmatic discrimination of Batchelor & Bowden (Reference Batchelor and Bowden1985). R1 = 4Si−11(Na+K)−2(Fe+Ti) and R2 = 6Ca+2Mg+Al.

The Salmontail Lake and Scrag Lake plutons are both granodioritic (e.g. 65.1 to 68.8 wt% SiO2) and similar in composition (Fig. 2). The Davis Lake pluton is more silicic and is comprised mostly of leucomonzogranites (68.5 to 76.3 wt % SiO2). The Mg no. of the Salmontail Lake (Mg no. = 28.6 to 44.9) and Scrag Lake (Mg no. = 38.2 to 43.5) plutons are slightly lower than that of the Davis Lake Pluton (Mg no. = 44.7 to 66.5). Like the major elements, the trace element compositions of the Salmontail Lake and Scrag Lake plutons are very similar (i.e. Zr = 208 to 300 ppm, Y = 26 to 52 ppm, Rb = 91 to 162 ppm, Nb = 11 to 17 ppm, Sr = 82 to 257 ppm), although the amount of Ba is variable (679 to 1293 ppm). There are some similarities between the granodiorites and the Davis Lake pluton (e.g. Y = 10 to 70 ppm, Nb = 7 to 26), but generally Zr (38 to 187 ppm), Sr (21 to 151 ppm) and Ba (19 to 601 ppm) are lower and Rb is higher (159 to 728 ppm).
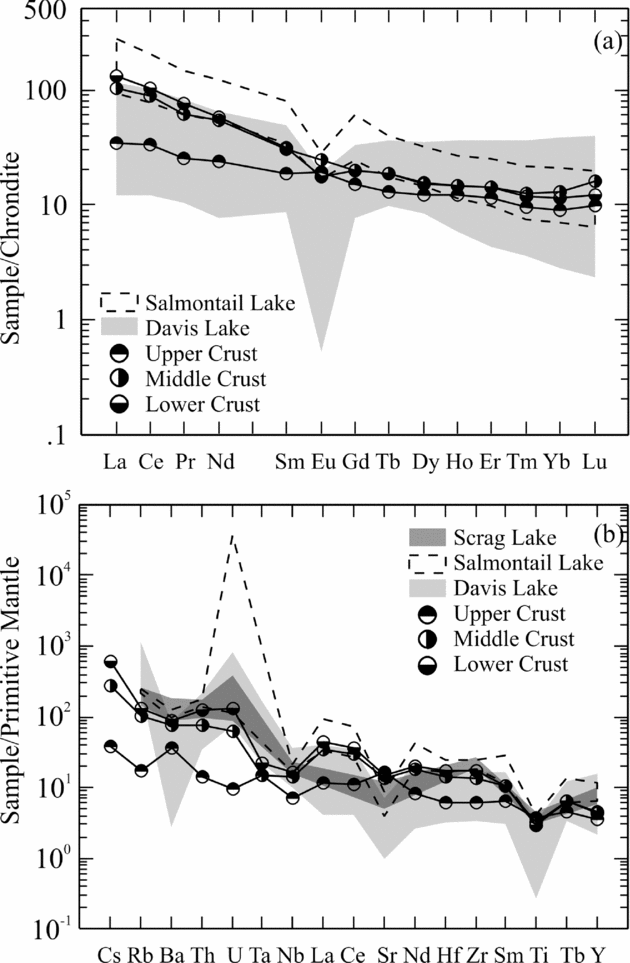
The chondrite normalized rare earth element patterns of the Salmontail Lake and Davis Lake plutons are similar to average crustal values of Ruddnick & Gao (2003) and both have negative Eu-anomalies (Fig. 3a). The Salmontail Lake pluton does have slightly higher La/YbN (8.0 to 14.2) values than the Davis Lake pluton (La/YbN = 2.1 to 13.3) but there is significant overlap. The primitive mantle normalized incompatible element patterns of the three plutons are somewhat similar with respect to Ba, Nb, Sr and Ti depletions and U enrichment (Fig. 3b). The Salmontail Lake pluton, known to contain U ore deposits, shows significant U enrichment. Overall the plutons are more similar to lower and middle continental crust than upper crust (Fig. 3b).
(a) Chondrite normalized rare earth element and (b) primitive mantle normalized incompatible element plots of the STP, SLP and DLP and upper, middle, lower crust values of Rudnick & Gao (Reference Rudnick, Gao, Rudnick, Holland and Turekian2003). Element order and normalizing values of Sun & McDonough (Reference Sun, McDonough, Saunders and Norry1989).

5. Discussion
5.a. Major and trace element modelling
Major element modelling was carried out using MELTS, assuming starting compositions of analysed granodiorite. Sample A12–1021 from NSDNRMRB (2006) and sample 184 from this study were selected as the starting magma compositions. Other parameters include initial water content of 4 wt%, pressure of 4 kbar and oxygen fugacity of equal to the fayalite–magnetite–quartz (FMQ) buffer. We chose the FMQ buffer owing to the assemblage of titanite–quartz–magnetite within some plutons (Wones, Reference Wones1989; Xirouchakis & Lindsley, Reference Xirouchakis and Lindsley1998). The modelled pressure is equal to ~ 12 km depth, which is consistent with the interpreted depth of emplacement for the SMB (MacDonald et al. Reference MacDonald, Corey, Ham and Horne1992). The starting water content is also within the expected range of the SMB as determined from previous experimental work (Erdmann et al. Reference Erdmann, London, Morgan and Clarke2007). The roles of olivine, pyroxene and amphibole are suppressed in the model owing to their absence within the actual granodiorites.
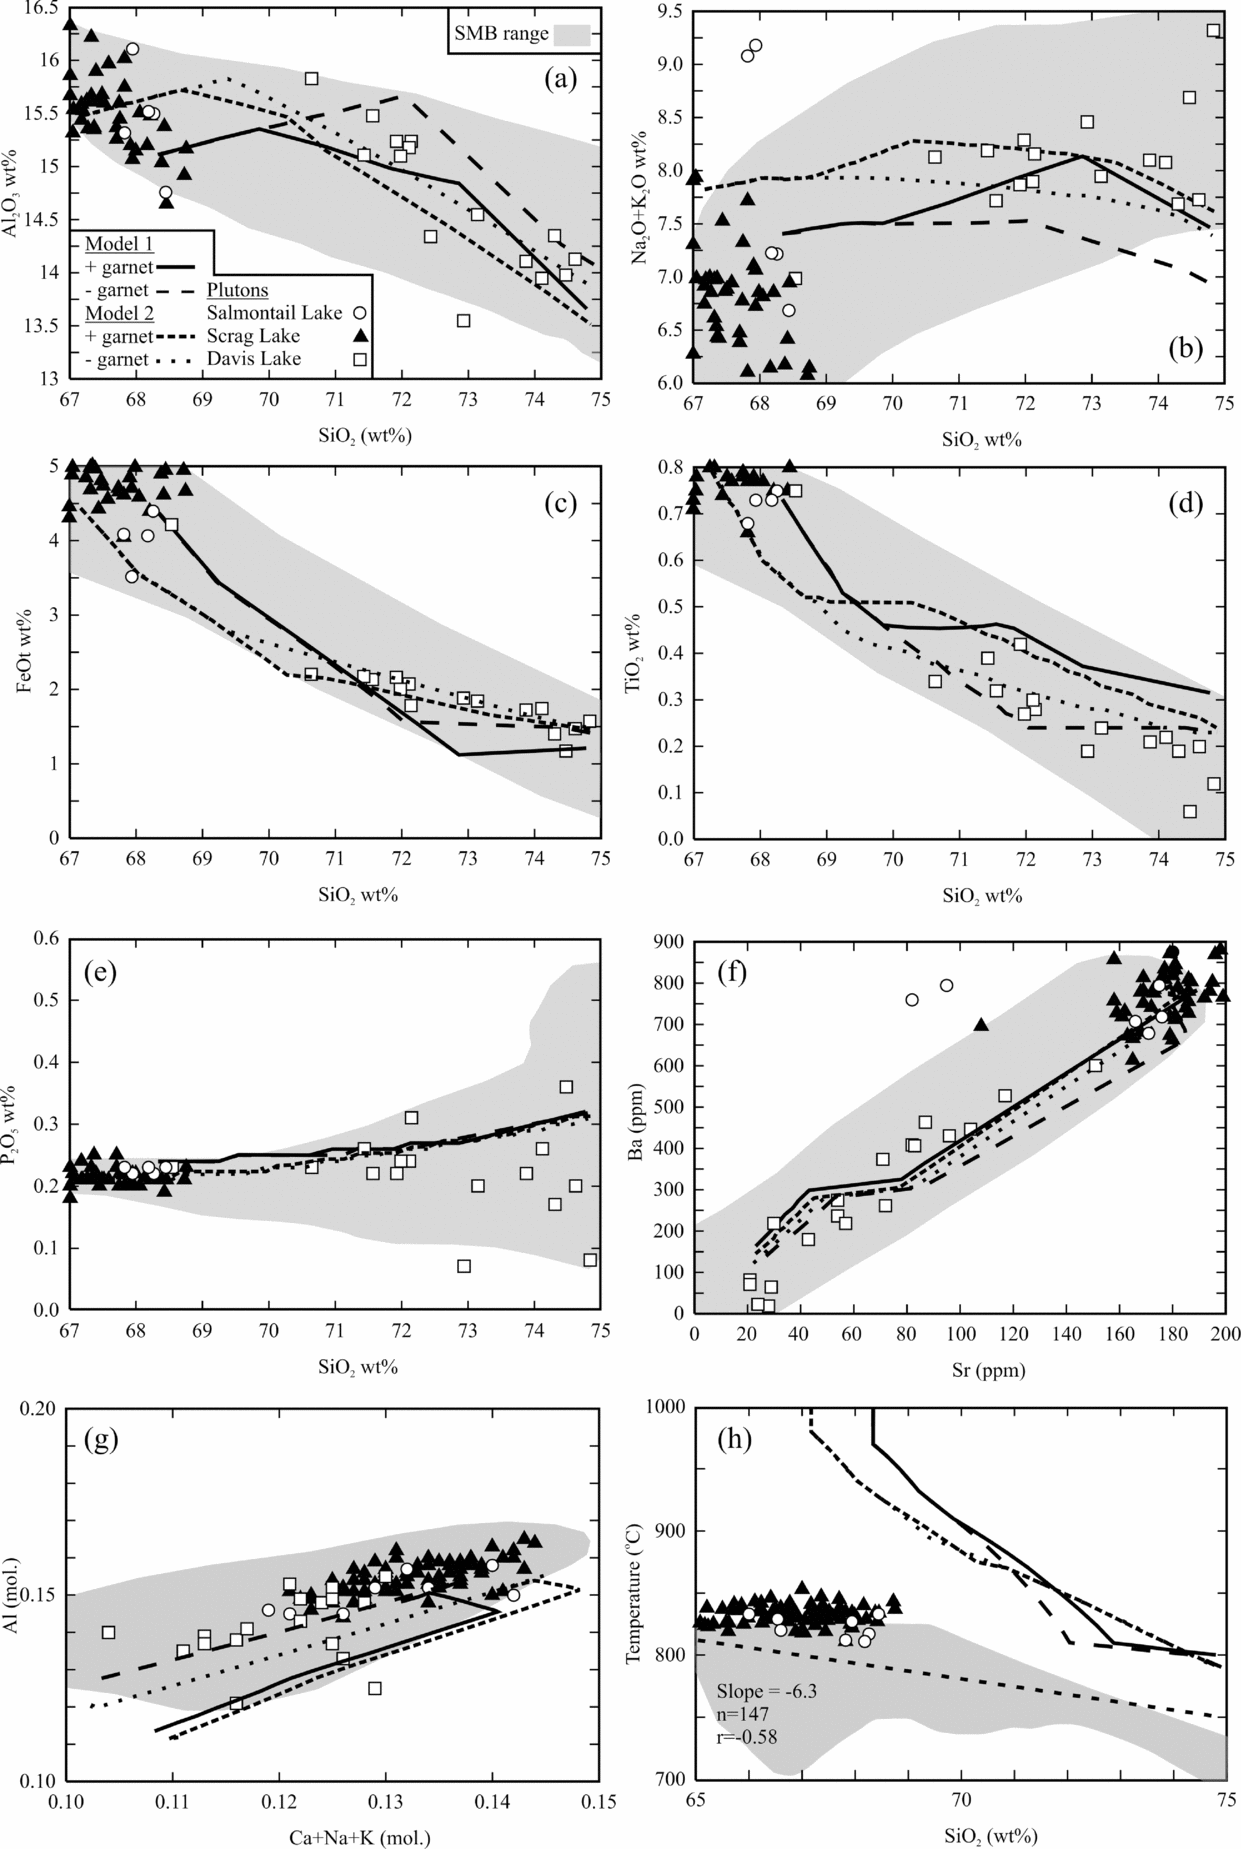
The modelled curves are presented in Figure 4 for the two starting compositions (Model 1 = A10–1021; Model 2 = 184). Both models have the same fractionating assemblage, starting with spinel (i.e. Ti-magnetite) followed by biotite and then garnet. The models differ in their relative timing of ilmenite and feldspar fractionation. Model 1 predicts ilmenite will fractionate before feldspar whereas Model 2 predicts the opposite. The initial compositions of the fractionating feldspar correspond to An23Ab68Or7 for Model 1 and An25Ab67Or8 for Model 2 and are within the observed range of feldspar from the SMB (e.g. An < 5 to 35). The model results are consistent with the observed compositional range of the SMB (Fig. 4). The appearance of garnet in the fractionating assemblage is interesting because it is observed within some of the SMB plutons (e.g. leucomonzogranites) as well as the contemporaneous and spatially associated Liscomb Complex (Kontak & Corey, Reference Kontak and Corey1988; MacDonald et al. Reference MacDonald, Corey, Ham and Horne1992; Dostal et al. Reference Dostal, Keppie, Jutras, Miller and Murphy2006; Erdmann, Jamieson & MacDonald, Reference Erdmann, Jamieson and MacDonald2009). The relative timing of garnet crystallization in the models corresponds to compositions similar to the leucomonzogranites. Kontak & Corey (Reference Kontak and Corey1988) identified the garnet as being spessartine-rich and interpreted it as metasomatic rather than magmatic. Furthermore, Erdmann, Jamieson & MacDonald (Reference Erdmann, Jamieson and MacDonald2009) suggest that the garnets are peritectic xenocrysts which are related to the assimilation of metapelitic xenoliths. The MELTS model predicts crystallization of almandine-pyrope-rich garnet. Although somewhat similar in composition to the garnets reported by Erdmann, Jamieson & MacDonald (Reference Erdmann, Jamieson and MacDonald2009), they are different from compositions reported by Kontak & Corey (Reference Kontak and Corey1988). The contrast in composition between the analysed and modelled garnet is problematic and difficult to reconcile. It is plausible that garnet was magmatic; however, not at the composition predicted by MELTS. Therefore, the same models were run with garnet suppressed (− garnet) and plotted on Figure 4. The effects of garnet suppression are seen in both models occurring at ~ 68.7 wt% SiO2 for Model 2 and ~ 69.9 wt% SiO2 for Model 1. The results of both models are still within the observed range of the SMB and pass through the data of this study. The second model with garnet suppression appears to be the best fit as the two + garnet models fall outside the SMB range in Figure 4g. The fractionating mineral assemblage is the same for both with Model 1 crystallizing spinel (Ti-magnetite) at 1015°C followed by biotite (940°C) and feldspar (890°C) with a composition of An35Ab60Or5. Model 2 has spinel crystallizing at 975°C and biotite at 935°C with feldspar (An29Ab65Or6) at 890°C. As in the + garnet models, the composition of the feldspar is within the range of the observed compositions.
Results of MELTS modelling for the SMB. Starting compositions equal to A12–1021 (Model 1) from MacDonald et al. (Reference MacDonald, Corey, Ham and Horne1992) and sample 184 (Model 2). Initial water content of 4 wt%, pressure = 4 kbar and fO2 = FMQ buffer. SMB data from NSDNRMRB (2006).

Using the results for the major element models and their fractionating assemblages and proportions, we modelled the evolution of Ba and Sr. Barium and Sr are selected because they are largely controlled by major minerals (e.g. biotite and feldspar) and their partition coefficients are well constrained. The results show that all of the modelled trends, ± garnet, fall within the known compositional range of the SMB (Fig. 4f). The continuous decrease of Ba and Sr with increasing SiO2 wt% suggests that the major and trace elements have not been decoupled and that additional material is not likely required to reproduce the observed trends.
The MELTS models appear to reproduce the entire SMB system and indicate that all plutons may be generated from a parental melt similar to the granodiorite. This interpretation implies that substantial (e.g. ≥ 30%) assimilation of crustal material is not necessarily a requirement for the more evolved compositions of the SMB. Furthermore, the model predicts that ~ 5.25 wt% H2O will be in the magma system as the high SiO2 compositions are reached. The magmatic water along with any fluids originating from the country rocks may be crucial for late-stage mobility of some major (e.g. Na, K) and trace (e.g. Sn, W, As, Rb) elements (Fig. 4b).
5.b. Magma temperature estimates
Magmatic temperatures of peraluminous and metaluminous granitic rocks can be estimated by zircon saturation thermometry (Watson & Harrison, Reference Watson and Harrison1983; Hanchar & Watson, Reference Hanchar and Watson2003). Miller, McDowell & Mapes (Reference Miller, McDowell and Mapes2003) showed that granitic rocks from a variety of settings (e.g. collisional, subduction, post-orogenic) can be divided in ‘hot-’ and ‘cold-types’, which reflect the amount of inherited zircon. The ‘hot’ granites have higher TZr(°C) (> 800°C) estimates and are crystal-poor, have minimal zircon inheritance and are related to advective heat input into the crust, whereas ‘cold’ granites are crystal-rich, inheritance-rich and are likely derived by melting associated with fluid influx.
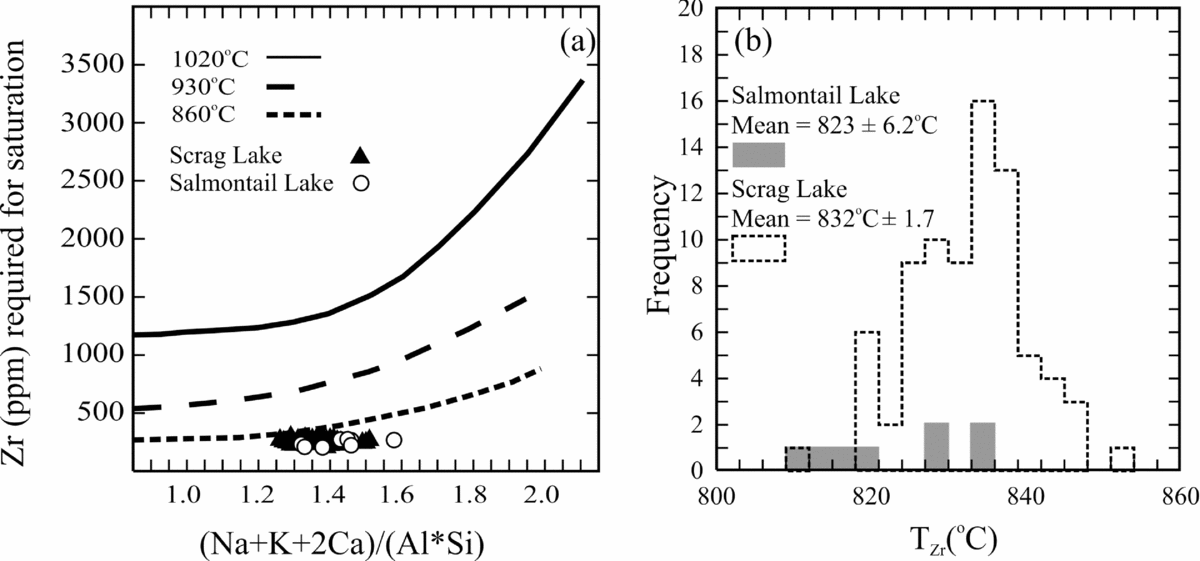
The calculated M ((Na+K+2Ca)/(Al*Si)) values of the Salmontail Lake pluton (M = 1.43 ± 0.06 2σ) and Scrag Lake pluton (M = 1.37 ± 0.01 2σ) are within the experimental range specified by Watson & Harrison (Reference Watson and Harrison1983) suggesting that Zr saturation temperatures may be reliable (Fig. 5a). However, the average M value for the Davis Lake pluton (M = 1.25 ± 0.04 2σ) is low and just outside the calibration range. The estimated Zr saturation temperatures (TZr°C) were calculated for only the Salmontail Lake and Scrag Lake plutons. The Zr contents of the Salmontail Lake (Zr = 208 to 278 ppm) and Scrag Lake (Zr = 210 to 300 ppm) plutons are very similar and do not vary substantially. The Salmontail granodiorites produced a range of estimated temperatures between 811°C and 833°C and have a mean of 823 ± 6°C (Fig. 5b). The Scrag Lake granodiorites produced a slightly larger range between 811°C and 853°C with a mean of 832 ± 2°C (Fig. 5b).
(a) Plot of experimental Zr saturation curves versus M ((Na+K+2Ca)/(Al*Si)) values for the STP and SLP. (b) Frequency distribution plots of the Zr-saturation temperature estimates.

The temperature estimates for the Salmontail and Scrag Lake plutons are > 800°C indicating they belong to the inheritance-poor granitic rocks. Therefore, the average temperature estimates are likely to underestimate their initial temperature (Miller, McDowell & Mapes, Reference Miller, McDowell and Mapes2003). This interpretation is consistent with the MELTS models as the modelled temperatures for the granodiorites are higher than the TZr(°C) values (i.e. ~ 950°C; Fig. 4h). The TZr(°C) values for the entire SMB show a declining temperature trend, which may be related to an increase in crustal assimilation or indicate a lower temperature for zircon saturation to occur (Fig. 4h). Miller, McDowell & Mapes (Reference Miller, McDowell and Mapes2003) suggested that the inheritance-poor granites are typically explained by dehydration melting or fractional crystallization of mantle melts related to the influx of heat associated with mafic magma injection. Tate & Clarke (Reference Tate and Clarke1995) identified a series of contemporaneous mafic intrusions spatially associated with the plutons of the SMB, which may represent the potential heat source that induced melting of the crust to produce the SMB granodiorites. The contemporaneous mafic intrusions as well as other granitic and basaltic rocks throughout the region may be related to a mantle plume which migrated under the northern Appalachians during Late Devonian time (Murphy, van Staal & Keppie, Reference Murphy, van Staal and Keppie1999).
5.c. Implications for the assimilation of country rock
It has been suggested, based on Sr–Nd isotopic modelling, that the leucogranites and possibly other parts of the SMB may have assimilated up to 33% of the surrounding country rock (Clarke, MacDonald & Erdmann, Reference Clarke, MacDonald and Erdmann2004). The MELTS modelling results indicate that assimilation of substantial amounts of Meguma Supergroup rocks may not be necessary. Since the average composition of the leucogranites can be modelled without crustal assimilation, it appears that the chemical variability of the SMB is largely due to fractional crystallization.
Glazner (Reference Glazner2007) reported that assimilation of crustal material is unlikely to exceed ~ 25% if basaltic magma intrudes warm granitic country rock because as material is added the magma viscosity increases and effectively prevents further assimilation. The amount of country rock that can be assimilated if the intruding magma was granodiorite would be less and decreases with increasing crystal content of the magma. The conditions best suited for assimilation are in the lower crust where temperatures are likely to be higher (Thompson, Matile & Ulmer, Reference Thompson, Matile and Ulmer2002). The SMB contains xenoliths of Meguma Supergroup rocks and in some cases they may have disaggregated (Clarke, Henry & White, Reference Clarke, Henry and White1998). Such disaggregation induces crystallization of the host magma and therefore will limit the amount of material that can be assimilated (Glazner, Reference Glazner2007). If disaggregation did occur within the SMB then it is unlikely to have allowed ~ 33% assimilation of the country rock as the host magma would become too rigid too quickly. The emplacement depth of the SMB is geologically constrained to mid-crustal levels (i.e. 10–12 km); therefore, conditions for large amounts of assimilation are unfavourable because the ambient temperature is likely to be too low (Thompson, Matile & Ulmer, Reference Thompson, Matile and Ulmer2002).
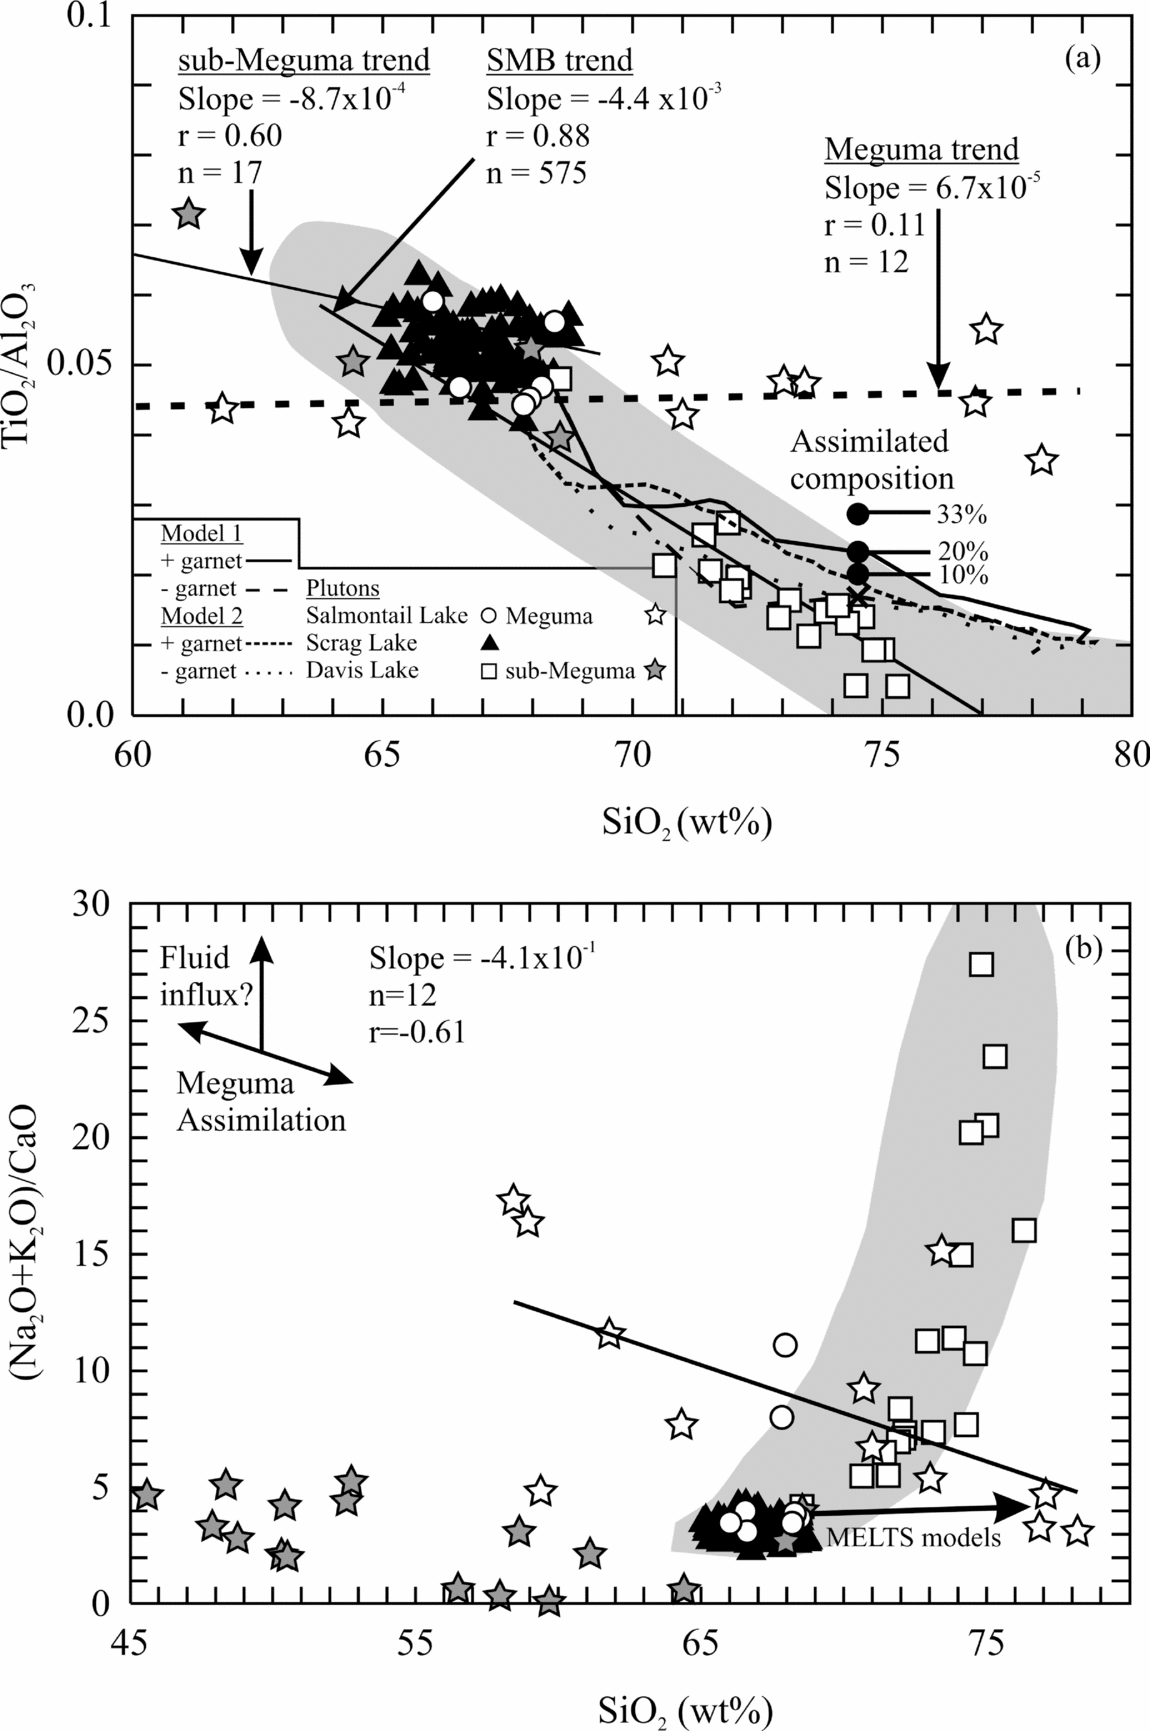
The major element ratios of TiO2/Al2O3 and alkali-lime argue against substantial crustal assimilation. The average Ti/Al ratio for leucogranites with 74 to 75 wt% SiO2 is 0.009 ± 0.001 2σ (NSDNRMRB, 2006). The MELTS models (without garnet) produced values of 0.017 (Model 1) and 0.016 (Model 2) at SiO2 = ~ 74.5 wt%, which are high but within the known range of the leucogranites (Ti/Al = 0.001 to 0.022). The Ti/Al ratios of Meguma Supergroup rocks are virtually constant at all SiO2 values between 58 wt% and 78 wt% with an average value of 0.046 ± 0.001 2σ (Clarke & Halliday, Reference Clarke and Halliday1980; Cameron & Zentilli, Reference Cameron and Zentilli1997; Fig. 6a). The average Meguma Supergroup rocks shown by Clarke, MacDonald & Erdmann (Reference Clarke, MacDonald and Erdmann2004) have Ti/Al ratios of GWK (greywacke) = 0.053, PEL (pelite) = 0.048 and CAL (calcsilicate) = 0.061. The MELTS models represent pure fractionation without assimilation. Therefore, if 33% assimilation of Meguma Supergroup rocks occurred as the leucogranite compositions are reached, the resulting Ti/Al values should be ~ 0.028. This value is outside of the known range of the SMB leucogranites (Fig. 6a). From another perspective, if we assume the observed average leucogranite Ti/Al ratio (i.e. 0.009 ± 0.001 2σ) represents one third Meguma Supergroup rocks and two thirds uncontaminated magma, then the uncontaminated magma must have a negative Ti/Al ratio. If, however, < 20% Meguma material is assimilated then the values are within the known Ti/Al range of the SMB (Fig. 6a).
(a) TiO2/Al2O3 versus SiO2 wt% of Meguma rocks, SMB and sub-Meguma rocks. X = MELTS model 1(− garnet). The black circles show the effects on the Ti/Al ratio of 10%, 20% and 33% assimilation of Meguma rocks on MELTS model 1 (− garnet) (b) Alkali-lime ratio versus SiO2 wt% of the Meguma rocks, SMB and sub-Meguma rocks. The grey field is the range of SMB compositions from NSDNRMRB (2006). Data for the Meguma rocks from Clarke & Halliday (Reference Clarke and Halliday1980) and Cameron & Zentilli (Reference Cameron and Zentilli1997). The sub-Meguma data from Eberz et al. (Reference Eberz, Clarke, Chatterjee and Giles1991).

The alkali-lime ((Na2O+K2O)/CaO) ratio versus SiO2 for the SMB is shown in Figure 6b. The MELTS modelled trends, Meguma Supergroup rocks and sub-Meguma Supergroup rocks are also shown. It is clear that some leucogranites have a higher alkali-lime ratio than the rest of the SMB and that the MELTS models cannot reproduce those samples. As a result there are four possible explanations: 1) crustal assimilation, 2) fluid influx, 3) element mobility associated with post-emplacement deformation or 4) a combination of all three. It is unlikely crustal assimilation plays a major role in the increased alkali-lime index because assimilation of Meguma rocks would either lead to an increase of alkalis and decrease in SiO2 or decrease in alkalis with an increase in SiO2 content (Fig. 6b). Since the SiO2 content of the leucogranites does not substantially vary, the only possible way to maintain the SiO2 wt% content would be to assimilate Meguma rocks with the same SiO2 wt% as the leucogranites. However, the alkali-lime ratio of the Meguma rocks at the same SiO2 wt% content as the leucogranites is also the same as the leucogranites and therefore would not likely cause an increase in the alkali-line ratio. Dostal & Chatterjee (1995, 2010) have suggested the enriched Rb content and low Ba/Rb and K/Rb ratios of the leucogranites are likely related to a fluid fractionation process, which is thought to occur in other granitic systems (London, Reference London1997; Cerny et al. Reference Cerny, Blevin, Cuney and London2005). A late-stage or post-emplacement influx of fluids either derived from the magma or from the country rock is likely responsible for the observed alkali-lime variations.
Clarke, MacDonald & Erdmann (Reference Clarke, MacDonald and Erdmann2004) based the amount of assimilation within the leucogranites on Sr–Nd isotopic mixing between the Meguma Supergroup rocks and the SMB (Clarke, Halliday & Hamilton, Reference Clarke, Halliday and Hamilton1988). The Ti/Al and alkali-lime ratios, however, suggest such large amounts of assimilation are not likely and that it is probably between 10% and 20%. The peraluminosity of the SMB suggests there is an alumina-rich (e.g. sedimentary) component to the SMB (MacDonald et al. Reference MacDonald, Corey, Ham and Horne1992; Clarke, MacDonald & Tate, Reference Clarke, MacDonald and Tate1997). Xenoliths recovered from Upper Devonian lamprophyric dykes indicate that the sub-Meguma crust is composed of calcareous shales, aluminous shales and both low- and high-Mg igneous rocks of the Avalon terrane (Eberz et al. Reference Eberz, Clarke, Chatterjee and Giles1991). The SMB isotopic compositions (εNd = −7.0 to +1.0; ISr = 0.7060 and 0.7110) partially overlap with the xenoliths (εNd = −2.6 to +5.0; ISr = 0.7038 to 0.7092) but they are very different from the Meguma Supergroup (εNd = −8.0 to −13; ISr = 0.7110 to 0.7190). Interpreting Sr–Nd isotopes related to anatectic melts can be problematic. Zeng, Saleeby & Asimow (Reference Zeng, Saleeby and Asimow2005) showed that there can be significant Nd isotopic differences between parent and daughter melts in the order of two to four epsilon units within the Isabella pendant of the Sierra Nevada Batholith, California. The difference between the parent and daughter compositions is attributed to the dissolution of apatite, monazite and potentially any LREE-bearing minerals (e.g. titanite, allanite) which may fractionate Sm from Nd generating Nd isotope disequilibrium and thus a larger variable of εNd values in the daughter liquid. Apatite and monazite are known accessory minerals within the plutons of the SMB and the elevated, variable P2O5 values in Figure 4e suggest there are P-rich minerals crystallizing in the leucogranites. If there can be a variability of up to four epsilon Nd units between parent and daughter melts, then the Nd isotopic data suggest that the sub-Meguma lower crust may be the primary source of the SMB because the εNd range of the xenoliths (εNd = −2.6 to +5.0) would overlap completely with the SMB.
5.d. Petrogenesis of the South Mountain Batholith
The observed major and trace element variations of both whole-rock (MacDonald et al. Reference MacDonald, Corey, Ham and Horne1992; Clarke et al. Reference Clarke, MacDonald, Reynolds and Longstaffe1993; Clarke, McDonald & Tate, Reference Clarke, MacDonald and Tate1997; Dostal & Chatterjee, Reference Dostal and Chatterjee1995; Chatterjee & Dostal, Reference Chatterjee and Dostal2002) and K-feldspars (Dostal & Chatterjee, Reference Dostal and Chatterjee2010) from the SMB resemble chemical patterns considered to be typical of high-silica systems that have been encountered in some rhyolitic centres and granitic plutons. Several mechanisms can be invoked to explain large compositional variations observed in the SMB and include 1) heterogeneous sources, 2) effects of hydrothermal or magmatic fluids, 3) crustal contamination and 4) fractional crystallization. Previous studies (Clarke, MacDonald & Tate, Reference Clarke, MacDonald and Tate1997; Clarke, MacDonald & Erdmann, Reference Clarke, MacDonald and Erdmann2004; Dostal & Chatterjee, Reference Dostal and Chatterjee2010 and references therein), based on the major and trace element and isotopic data, suggested that the source for the SMB was relatively homogeneous.
Dostal & Chatterjee (1995, 2010) and Dostal, Chatterjee & Kontak (Reference Dostal, Chatterjee and Kontak2004) have shown that highly fractionated rocks, in particular the fine-grained leucomonzogranites and leucogranites, of the SMB were affected by fluids. They argued that fractional crystallization of the evolving peraluminous granitic magma was accompanied in later stages by fluid fractionation involving perhaps fluorine complexing. Fluid fractionation was a major differentiation process during the terminal stages of the evolution of the SMB. It played an important role in the genesis of the evolved rocks, in particular fine-grained leucomonzogranites and leucogranites. They inferred that fluorine-rich fluids modified not only chemical composition of these rocks but also the Rb/Sr and U/Pb ratios which produced the distinct variations of 87Sr/86Sr and 206Pb/204Pb isotopic ratios. However, fluid fractionation does not appear to play an important role in the evolution of less fractionated rocks, for example the granodiorite to coarse-grained leucomonzogranite suites.
Dostal & Chatterjee (1995, 2010), Dostal, Chatterjee & Kontak (Reference Dostal, Chatterjee and Kontak2004), Clarke, MacDonald & Tate (1997), Clarke, Fallon & Heaman (2000) and Clarke, MacDonald & Erdmann (Reference Clarke, MacDonald and Erdmann2004 and references therein) evaluated the crustal contamination processes and concluded that crustal contamination played a role in the evolution of the SMB, particularly in the early stages of the chemical evolution of the batholith. However, the oxygen and sulphur isotopes (Kontak, Reference Kontak and Lentz1994) and well-defined Pb–Pb and Sr isochrons for the Davis Lake pluton (Dostal, Chatterjee & Kontak, Reference Dostal, Chatterjee and Kontak2004) and the SMB (Chatterjee & Ham, Reference Chatterjee and Ham1991) as well as Pb–Pb isochrons for K-feldspars of the SMB (Dostal & Chatterjee, Reference Dostal and Chatterjee2010) imply that the distinct chemical variations in the SMB were not produced by contamination of upper crustal material but are consistent with fractional crystallization as the principle process. Clarke, MacDonald & Tate (1997) and Clarke, MacDonald & Erdmann (Reference Clarke, MacDonald and Erdmann2004) inferred that fractional crystallization indicated by strong correlations between pairs of elements played an important role during the evolution of the SMB and is one of the main causes of the observed chemical variations. They argued that fractional crystallization was accompanied by wall-rock contamination/assimilation of the Meguma metasediments.
Dostal, Chatterjee & Kontak (Reference Dostal, Chatterjee and Kontak2004) showed that the isotopic and trace element trends of the leucogranites of the Davis Lake pluton are extensions of the trends displayed by the less-evolved granites. These correlations and variations suggest derivations of these rocks from a common magma, primarily by magmatic differentiation. Likewise, the variations of the trace elements and Pb isotopic ratios of K-feldspars of the SMB are consistent with such a process (Dostal & Chatterjee, Reference Dostal and Chatterjee2010). Most variations in the suite ranging from granodiorite to coarse-grained leucomonzogranite can be accounted for by fractional crystallization of feldspars, biotite, zircon, apatite and monazite accompanied by crustal contamination. This process alone cannot, however, explain the variations of the more evolved rocks, including fine-grained leucomonzogranites and leucogranites (Dostal & Chatterjee, Reference Dostal and Chatterjee2010).
The results from the MELTS modelling support a fractional crystallization model, although it is likely that the leucogranites require alkali enrichment to produce the high (> 8.5 wt%) total alkalis observed in Figure 4b. The TZr(°C) values suggest the granodiorites of the SMB are similar to the ‘hot granites’ of Miller, McDowell & Mapes (Reference Miller, McDowell and Mapes2003) where an influx of heat is required to generate melts from dehydrated crust. The spatially associated mafic intrusions of the SMB are evidence for high advective heat flow, which may have been an important heat source that partially melted the lower crust to produce the granodiorites, which then fractionated to produce the more evolved compositions and was accompanied by late-stage magmatic fluid fluxing with or without crustal contamination.
6. Conclusions
New data from the Scrag Lake, Salmontail Lake and Davis Lake plutons suggest there is a continuous compositional evolution from the more primitive compositions of the SMB to the most evolved and is supported by MELTS modelling. The models predict a fractionating assemblage of magnetite, biotite, feldspar, ilmenite ± garnet. The modelled feldspar composition is within the same compositional range as the observed feldspar (An29–35Ab60–65Or5–6). The TZr(°C) estimates of the Salmontail Lake (823°C ± 6) and Scrag Lake (832°C ± 2) plutons indicate that they are inheritance-poor and similar to the ‘hot granites’ described by Miller, McDowell & Mapes (Reference Miller, McDowell and Mapes2003). The Ti/Al and alkali-lime ratios indicate that there cannot be > 20% assimilation of Meguma Supergroup rocks in the leucogranites. The results of this study suggest the SMB formed by partial melting of the lower crust (i.e. sub-Meguma) likely due to the injection of hot mafic magmas. The granodiorites produced by partial melting subsequently underwent fractional crystallization with late-stage fluid fluxing and likely assimilated between 10% and 20% crustal material.
Acknowledgements
We would like to thank Phil Leat, Brendan Murphy and an anonymous reviewer for their useful comments which helped to improve this manuscript. JGS would like to acknowledge Der-Chuen Lee for financial assistance through a post-doctoral fellow at Academia Sinica.