I. INTRODUCTION
Leaded brasses are characterized by a duplex structure of α, with face-centered cubic (FCC) and β with body-centered cubic (BCC) microstructures. They have a wide range of applications, especially for brass forging and machining parts. The hot deformation behavior of brasses with different microstructures of single-phase α or β and duplex α + β has been investigated and documented in the literature.Reference Sharififar and Akbari Mousavi1–Reference Blaz, Konior and Majda6 Despite our insight into the flow behaviors of individual α or β, our knowledge about their coexistence is still lacking. This is attributed to the different flow behaviors of α and β and their interactions during straining at elevated temperatures. Similar investigations into duplex stainless steelsReference Farnoush, Momeni, Dehghani, Mohandesi and Keshmiri7,Reference Momeni, Kazemi and Bahrani8 and Ti alloysReference Babu, Livingston and Lippold9,Reference Sahebdel, Abbasi and Momeni10 have shown that different deformation mechanisms of the constituents complicate the modeling of flow curves at elevated temperatures. The situation is more complicated when we deal with leaded duplex brass comparing to those which are free of lead. Due to the limited solubility of lead in Cu alloys, it is often observed as the undissolved particles in α. This means that the present models for the flow behavior of α at hot working temperatures cannot be simply used to describe the flow behavior of lead-bearing α in leaded duplex brass alloys.
Modeling the flow behavior of alloys has been always interesting and has drawn scholars' considerable attention.Reference Lin, Zhang and Zhong11,Reference Shu, Lu, Wang and Li12 For multi-phase alloys, modeling on the basis of the constituents individual responses has been always interesting. The constitutive equationsReference Momeni and Dehghani13,Reference Spigarelli, El Mehtedi, Ricci and Mapelli14 as well as the self-consistent modelsReference Kim, Yeom, Park and Lee15–Reference Kim, Semiatin, Lee and Lee17 have been tried for different duplex alloys. In some cases, the mentioned techniques have been combined with the law of mixture rule to develop new physics-based models.Reference Momeni, Dehghani and Poletti18–Reference Luo, Li, Li and Shi20 The first challenge to use the law of mixture is measuring the flow behavior of the constituents at different deformation conditions. For case of duplex leaded brass, only the flow behavior of β is available in the literatureReference Prasad and Sasidhara21 and that of lead-containing α has not been reported so far. Moreover, the varying chemical composition of both phases over the hot working temperature range more complicates the prediction of α + β flow behavior. Hence, the present work has aimed at studying the hot deformation behavior of the constituents in a duplex leaded brass, using a self-consistent model and predicting the flow behavior of the material by the law of mixture rule.
II. MATERIAL AND METHODS
The leaded brass alloy CuZn39Pb3 with chemical composition according to Table I was used in this investigation.
Chemical composition of CuZn39Pb3 alloy used in this investigation.

The initial microstructure of the materials shown in Fig. 1 indicates that the alloy is consisted of α and β phases. In the micrograph, the matrix phase is β and the lighter islands that contain dark particles of Pb are α.
Microstructure of the as-received CuZn39Pb3. The light islands which contain dark Pb particles are α and the darker matrix is β.

The cylindrical specimens with 10 mm in diameter and 15 mm in height were machined from the starting material according to ASTM E209 standard. Hot compression tests were carried out on the specimens at temperatures of 600, 650, 700, 750, and 800 °C and strain rates of 0.001, 0.01, 0.1, and 1 s−1 by a Zwick-Roell testing machine (Zwich GmbH & Co. Kg, Ulm, Germany).
Before the compression tests, the specimens were reheated to the testing temperatures and soaked for 10 min. Graphite was applied on the contacting surfaces to reduce friction. The specimens were compressed to the true strain of 0.6 and the recorded load–stroke data were converted to the true stress–true strain curves using the standard equations.
III. RESULTS AND DISCUSSION
A. Experimental flow curves
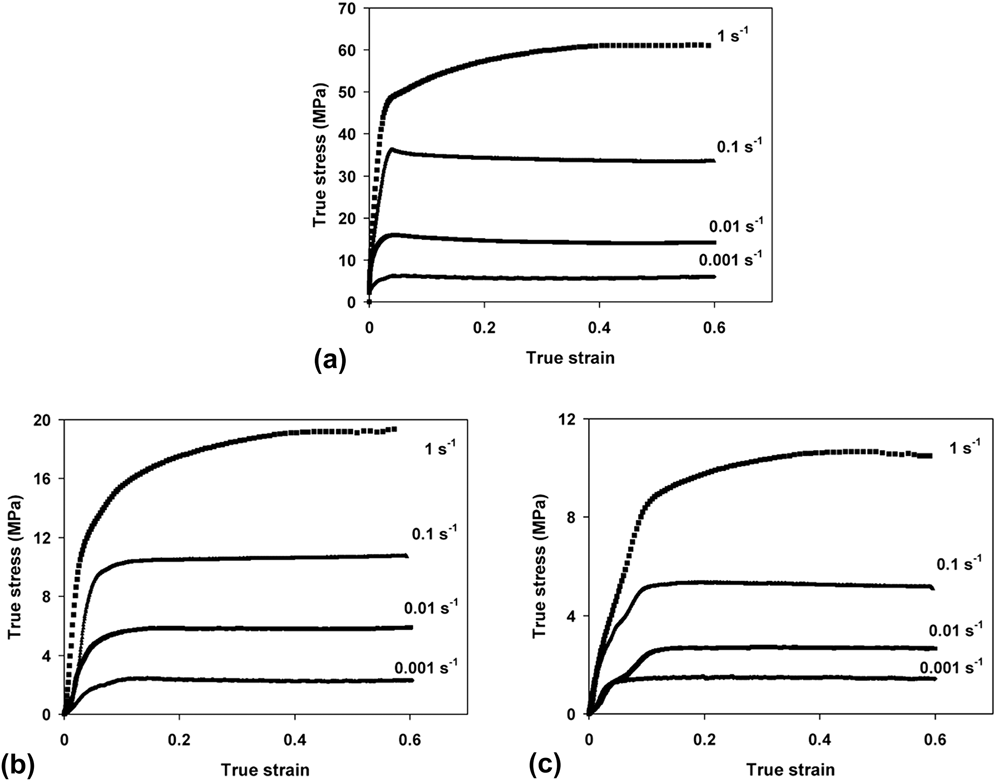
The true stress–strain curves of the material at typical temperatures of 600, 700, and 800 °C and various strain rates are shown in Fig. 2. The flow curves at low to medium strain rates (0.001–0.1 s−1) are obviously characterized by a long plateau of nearly steady state behavior after a work hardening region. However, at high strain rates, especially 1 s−1, a region with moderate work hardening rate substituted for the steady state region, observed at lower strain rates. It is easily therefore implied that the material behaves as a viscoplastic solid whose flow stress strongly depends on the deformation temperature and strain rate.
Representative true stress–strain curves of the studied alloy at various strain rates and temperatures of (a) 600 °C, (b) 700 °C, and (c) 800 °C.
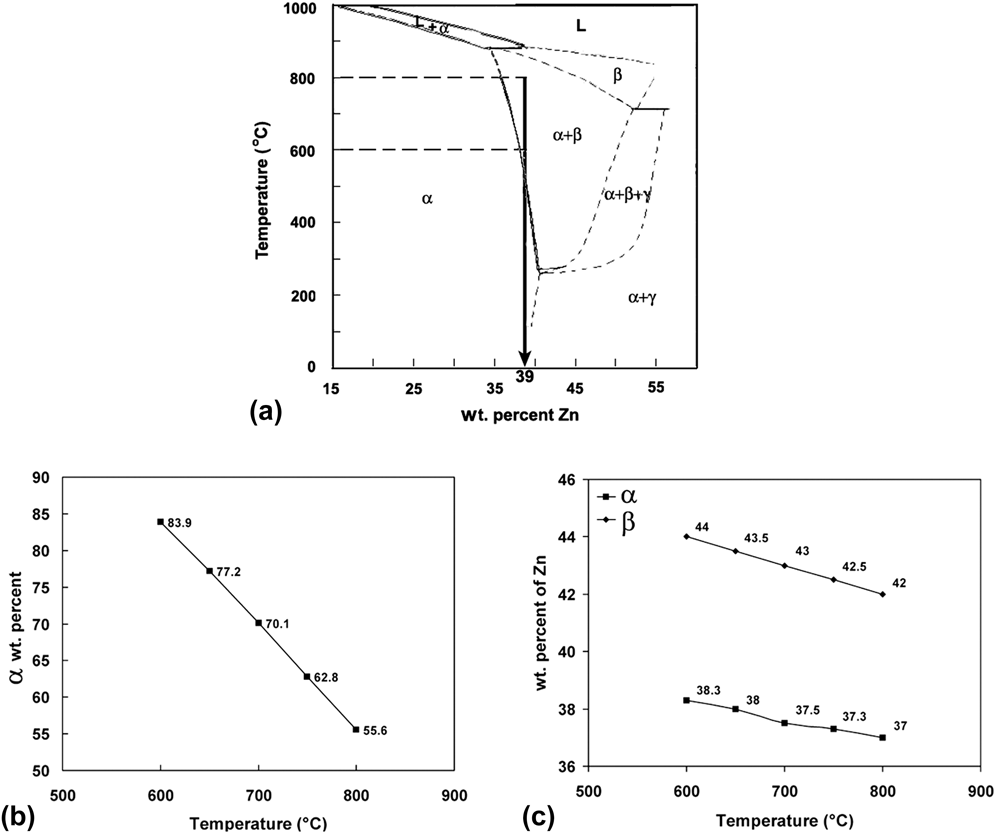
The influence of temperature on flow stress should be accounted for with regard to the different balances between α and β at various deformation temperatures. According to the Cu–Zn–Pb phase diagram calculated by the Thermocalc (Stockholm, Sweden) software in Fig. 3(a), the volume fraction and chemical composition of α and β varies over the hot working temperature range. Figures 3(b) and 3(c) show that how the volume fractions and Zn contents of the constituents varies in the studied temperature range. Indeed, the flow behavior of leaded brass is hard to interpret due to the variable volume fractions of the constituents over the hot working temperature range. It has been reported that the flow stress of Cu–Zn alloys decreases with an increase in the Zn content.Reference Momeni, Ebrahimi and Faridi5 According to this assumption, it could be deduced from Fig. 3(c) that α should be considerably stronger than β. In this regard, the decreasing trend of flow stress with increasing temperature, which is observed in Fig. 2, can be partly associated with the decrease in the α volume fraction.
(a) Phase diagram of Cu–Zn–Pb with different percentages of Zn drawn using the Thermocalc software,Reference Momeni, Ebrahimi and Faridi5 (b) the volume fraction of phase α over the studied temperature range based on the established phase diagram, (c) Zn contents of phases α and β at the hot deformation temperatures.
The effect of Pb on the flow behavior of α is another complexity which should be also dealt with. Previous investigations on Cu–Zn–Pb system have reported that the solubility of Pb in α is limited to 0.08 wt%; whereas, Pb can be dissolved up to 0.35 wt% in β.Reference Perrot, Effenberg and Ilyenko22 This signifies the presence of Pb particles in α islands in Fig. 1 and necessitates considering their effect on the flow behavior of α and the composite of α + β.
B. Self-consistent model
As mentioned, the lack of information about the flow behavior of Pb-containing α is the greatest challenge to interpret the flow behavior of leaded brass alloys. However, the flow behavior of β is available from a series of experiments performed on different Cu–Zn alloys in the literature.Reference Prasad and Sasidhara21 To measure the flow behavior of Pb-containing α a power-law viscoplastic self-consistent approach was used. The model was originally developed by HillReference Hill23 for linearly elastic materials and then was extended to the viscoplastic materials by Suquet.Reference Suquet24 If both phases are firstly considered to be linearly viscoplastic, their constitutive relation can be determined as followsReference Suquet24:
 $${\sigma _i} = k_i^{\rm{L}}{\dot \varepsilon _{\rm{i}}}\quad ,$$
where σ and  ${\dot \varepsilon}$ stands for the flow stress and strain rate, respectively, and
 $k_i^{\rm{L}}$ denotes the “viscosity” parameter and the subscripts i refers to the constituents α and β. It is clear that if we consider the composite α + β as a linear viscoplastic material, its viscosity parameter should depend on
 $k_\alpha ^{\rm{L}}$ and
 $k_\beta ^{\rm{L}}$ and the volume fraction of each phase, as followsReference Suquet24:
 $${{k_{\rm{C}}^{\rm{L}}} \over {k_{\rm{\beta }}^{\rm{L}}}} = \left( {{{\rm{1}} \over {\rm{6}}}} \right)\left\{ {{\rm{\ \ 3}} - {\rm{2}}\rho + {\rm{5}}\left( {{\rm{1}} - {f_\beta }} \right)\left( {\rho - {\rm{1}}} \right) + \sqrt {{{\left[ {{\rm{3}} - {\rm{2\rho }} + {\rm{5}}\left( {{\rm{1}} - {f_{\rm{\beta }}}} \right)\left( {\rho - {\rm{1}}} \right)} \right]}^{\rm{2}}} + {\rm{24}}\rho } } \right\}\quad ,$$
here,  $k_{\rm{C}}^{\rm{L}}$ refers to the viscosity parameter of the composite α + β, ρ equals to the ratio of
 $k_\alpha ^{\rm{L}}$/
 $k_\beta ^{\rm{L}}$ and f β is the volume fraction of phase β. This equation helps to calculate the viscosity parameter of Pb-containing α
 $\left( {k_\alpha ^{\rm{L}}} \right)$ from the experimental values of
 $k_\beta ^{\rm{L}}$ and
 $k_{\rm{C}}^{\rm{L}}$. If both phases are considered as nonlinear viscoplastic solids, their constitutive relation can be drawn as followsReference Lin and Chen25:
 $${\sigma _i} = k_i^{}{\dot \varepsilon _i}^m\quad ,$$
where m refers to the strain rate sensitivity parameter and k i is the viscosity-like parameter of phase i (α, β or their composite). In the approach developed by Suquet,Reference Suquet24m is taken equal for both the constituents. Indeed, k C is a function of the viscosities, viscosity-like parameters, and the volume fractions of the constituents as followsReference Suquet24:
 $${{k_{\rm{C}}^{}} \over {k_{\rm{\beta }}^{}}} = \mathop {{\rm{min}}}\limits_{\rho \ge {\rm{0}}} \left\{ {{\rm{\ \ }}{{\left( {{{k_{\rm{C}}^{\rm{L}}} \over {k_{\rm{\beta }}^{\rm{L}}}}} \right)}^{\left( {{{m + {\rm{1}}} \over {\rm{2}}}} \right)}}{{\left[ {{f_{\rm{\beta }}} + \left( {{\rm{1}} - {f_{\rm{\beta }}}} \right){\rho ^{\left( {{{m + {\rm{1}}} \over {m - {\rm{1}}}}} \right)}}{{\left( {{{k_{\rm{\alpha }}^{}} \over {k_{\rm{\beta }}^{}}}} \right)}^{\left( {{{\rm{2}} \over {{\rm{1}} - m}}} \right)}}} \right]}^{\left( {{{{\rm{1}} - m} \over {\rm{2}}}} \right)}}} \right\}\quad ,$$
where the expression “min” refers to the minimum of the right-hand side of equation for positive values of ρ. In Eq. (4) the values of k C, k β,  $k_{\rm{C}}^{\rm{L}}$, and
 $k_\beta ^{\rm{L}}$ are determined directly from the constitutive description of flow stress for the composite and phase β, using Eqs. (1) and (3). The unknown term in Eq. (4) is k α which is used to calculate the flow behavior of Pb-containing α using Eq. (3).
1. Calculation of  $k_{\rm{C}}^{\rm{L}}$, $k_\beta ^{\rm{L}}$, $k_\alpha ^{\rm{L}}$, and ρ


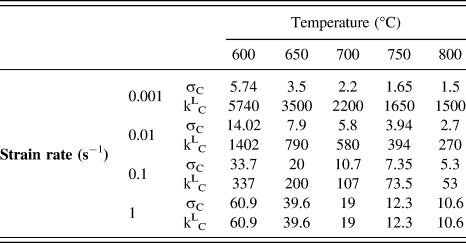
The first step for calculating the flow behavior of α by the aforementioned approach is calculating the viscosity parameters of the constituents and the composite using the linear viscoplastic constitutive equation given in Eq. (1). For this purpose,  $k_{\rm{C}}^{\rm{L}}$ can be directly determined using the experimental results presented in Fig. 2. For calculating
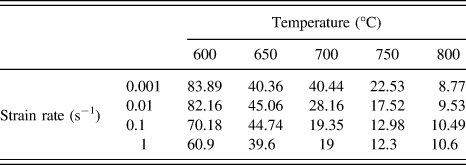
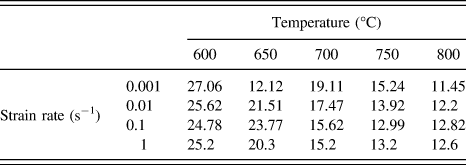
 $k_\beta ^{\rm{L}}$ the flow stresses were obtained from the literature,Reference Prasad and Sasidhara21 considering the fact that the chemical composition (Zn content) of phase β changes with temperature according to Fig. 3(c). Tables II and III summarize the flow stress data and
 $k_i^{\rm{L}}$ values
 $\left( {{\rm{ = }}\sigma _i {{/\dot \varepsilon }}} \right)$ for phase β and the composite at typical strain of 0.4.
Values of flow stress and the viscosity parameter for β calculated using Eq. (1) at different temperatures and strain rates.
Values of flow stress and the viscosity parameter for α + β composite calculated using Eq. (1) at different temperatures and strain rates.
The values of ρ  $\left( { = {{k_\alpha ^{\rm{L}} } \mathord{\left/ {\vphantom {{k_\alpha ^{\rm{L}} } {k_\beta ^{\rm{L}} }}} \right. \kern-\nulldelimiterspace} {k_\beta ^{\rm{L}} }}} \right)$ at different deformation conditions were calculated by solving the quadratic equation obtained from Eq. (2) as follows:
 $$p{\rho ^{\rm{2}}} + q\rho + r = {\rm{0}}\quad {\rm{,}}$$
where coefficients p, q, and r can be determined from a set of equations as follows:
 $$\eqalign{ & p = 8B{\rm{\ }}\left( {3B - 2} \right)\quad , \cr & q = 4B{\rm{\ }}\left( {10 - 12B + 3A} \right) - 24\left( {A - 1} \right)\quad , \cr & r = 24B{\rm{\ }}\left( {B - 0.5A - 1} \right) + 36A\left( {1 - A} \right)\quad , \cr & A = {{k_{\rm{C}}^{\rm{L}}} \over {k_\beta ^L}}\quad , \cr & B = 1 - {f_\beta }\quad . \cr}$$
Table IV and Fig. 4 summarize the calculation results of ρ and  $k_\alpha ^{\rm{L}}$ at different deformation conditions. The calculated values of ρ are filtered according to the condition of ρ ≥ 0 in Eq. (4). According to Fig. 4, the viscosity parameter of phase α decreases with increasing deformation temperature which is consistent with the decrease of flow stress at high temperatures.

Variation of the viscosity parameter of phase α  $\left( {k_\alpha ^{\rm{L}}} \right)$ with deformation temperature and strain rate at the typical strain of 0.4.
2. Determination of k C, k β, m, and k α
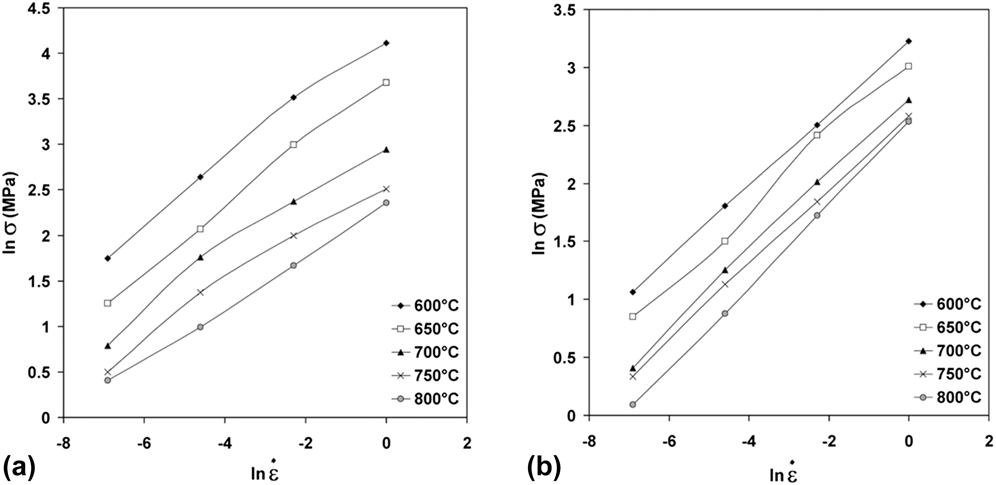
Assuming that phases α and β as well as their composite are viscoplastic solids, the constitutive relationship between their flow stress and strain rate can be established as Eq. (3). Hence, the values of k C, k β, and m could be determined by drawing the experimental data of the studied alloy and phase β in a logarithmic scale as in Fig. 5.
Variation of the flow stress with strain rate in the frame of the nonlinear viscoplastic equation [Eq. (3)], (a) the composite alloy of α + β, (b) phase β.
The values of m at different deformation temperatures and strain rates were determined using the definition of derivation as follows:
 $${m_i} = {{\partial \,{\rm{ln}}\,\sigma } \over {\partial \,{\rm{ln}}\,\dot \varepsilon }}{\rm{\sim}}{{{\rm{ln}}\,{\sigma _{i + {\rm{1}}}} - {\rm{ln}}\,{\sigma _i}} \over {{\rm{ln}}\,{{\dot \varepsilon }_{i + {\rm{1}}}} - {\rm{ln}}\,{{\dot \varepsilon }_i}}}\quad .$$
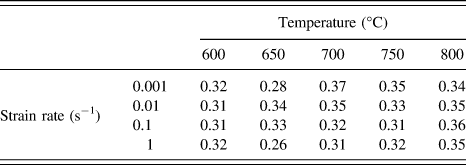
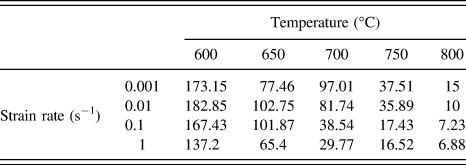
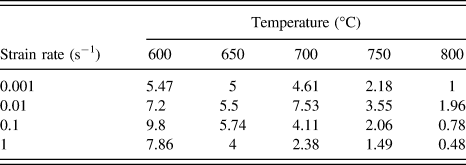
After calculating m at various temperatures and strain rates, the corresponding values of k i were determined by using Eq. (3). Tables V–VII summarize the values of k C, k β, and m calculated based on the above approach. By replacing the calculated values of k C, k β, and m into Eq. (4), k α was determined at various deformation conditions. It is worthy of attention that the condition of  $\rho \ge {\rm{0}}$ was satisfied in Sec. III.B.1 through solving the quadratic equation of Eq. (5). Table VIII summarizes the calculated values of the viscosity-like parameter for Pb-containing α.
Values of the viscosity-like parameter of α + β composite (k C) calculated using Eq. (3) at different deformation conditions.
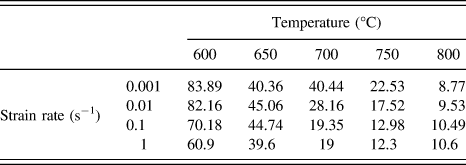
Values of the viscosity-like parameter of β (k β) calculated using Eq. (3) at different deformation conditions.
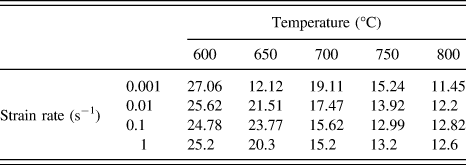
Values of the strain rate sensitivity parameter of β (m) calculated using Eq. (3) at different deformation conditions.
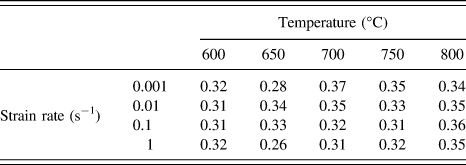
Values of the viscosity-like parameter of α (k α) calculated using Eq. (4) at different deformation conditions.
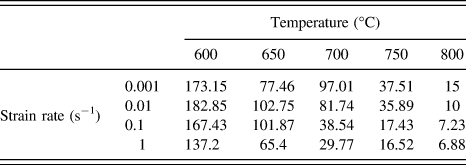
3. Flow behavior of α, β, and α + β
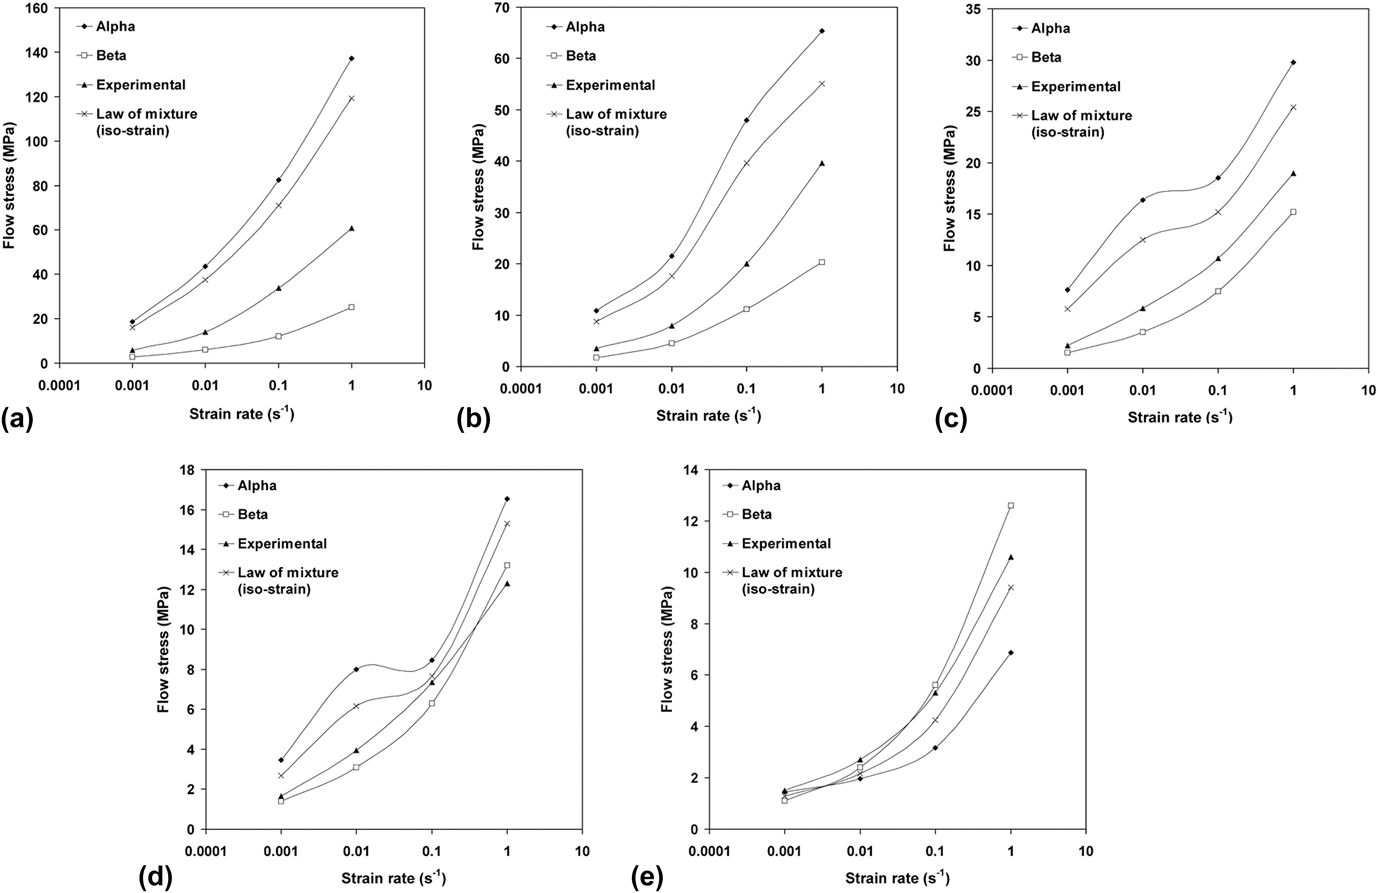
The flow stress of phase α was calculated at the typical strain of 0.4 using the calculated values of k α in Table VIII. Figures 6(a)–6(e) provide the variation of σα with temperature at various strain rates. The experimental flow stresses of the composite α + β, reported in Fig. 2, have been superimposed in Fig. 6 for comparison with those of α and β. In addition, the law of mixture role [Eq. (8)] has been used to calculate the flow stress of the composite using the specific flow stresses and the volume fractions of the constituents.
 $${\sigma _{\rm{C}}} = {f_\alpha }{\sigma _\alpha } + {f_\beta }{{\rm{\sigma }}_\beta }\quad ,$$
where f stands for the volume fraction and σC is the flow stress of the composite (studied leaded brass alloy) at a given deformation temperature and strain rate.
Comparison between the calculated flow stress of α, β, and α + β composite. The flow stresses of α and α + β composite have been calculated using the self-consistent approach and law of mixture rule, respectively. (a) 600 °C, (b) 650 °C, (c) 700 °C, (d) 750 °C, (e) 800 °C.
It should be noted that σC has been calculated assuming that the strain in both phases is the same and equal to the strain applied to the composite of α + β. This situation is often termed as “iso-strain” condition. It is clear that due to the difference between the flow stresses of α and β, the situation of “iso-stress” do never happen during straining of composite α + β.
The results clearly show that the flow stresses of α and β increase as strain rate rises or temperature declines and the flow behavior of studied α + β alloy obey the same variations. It is also worthy of note that at all conditions of temperature and strain rate, apart from 800 °C [Fig. 6(e)], the phase α is remarkably stronger than β. This observation can be associated with different Zn-contents of α and β according to Fig. 3(c).
These results well agree with those reported by Momeni et al.Reference Momeni, Ebrahimi and Faridi5 who showed that the flow stress of Cu–Zn alloys decrease as the Zn content increases. They attributed their finding to the interactive diffusion of Zn and Cu at hot working temperatures.
Another important result which could be highlighted here is that the flow stress obtained from the law of mixture is closer to that of α and shows a great overestimation with respect to the experimental flow stress of α + β composite. The difference between the experimental and law of mixture flow stresses is on top at 600 °C and decreases as temperature rises to 750–800 °C. This is an important finding, reflecting the fact that the “iso-strain” condition cannot be applied for the composite α + β. Indeed, there should be a strain partitioning phenomenon between α and β in their composite. The strain partitioning between phases in a composite is a result of the considerable difference between their flow stresses and results in more strain accommodation by the softer phase. Similar strain partitioning has been reported between ferrite and austenite phases during hot working of a duplex stainless steel.Reference Spigarelli, El Mehtedi, Ricci and Mapelli14 Hence in α + β composite most of strain is accommodated by the softer phase, which is β. As mentioned, the difference between the experimental and law of mixture values of flow stress for α + β decreases as temperature rises. At 800 °C and all strain rates, α is softer than β and therefore the law of mixture curve lies below the experimental curve and that of phase α. These results indicate that at 800 °C the flow behavior of the material has considerably changed. According to Figs. 3(a) and 3(b), it is reasonable to agree that with increasing temperature and decreasing volume fraction of α, the flow behavior of the α + β composite is more inclined to that of β. However, in contrast to Fig. 3(b) at which the volume fraction of α at 800 °C is predicted to be a bit more than 50%, microstructural observations by Momeni et al.Reference Momeni, Ebrahimi and Faridi5 showed that the volume fraction of α at 800 °C should be well below 50%. Therefore, the current results predict that at 800 °C the material behaves as if only β is present. As a conclusion, it is observed that the calculations based on the self-consistent approach satisfactorily predict the flow behavior of phase α in duplex brass alloys. Moreover, a combination of the self-consistent approach and the law of mixture rule can predict the flow behavior of the composite α + β if strain partitioning is taken into account.
IV. CONCLUSIONS
Hot compression tests were carried out on the duplex α + β leaded brass CuZn39Pb3 in temperature range of 600–800 °C and at strain rates of 0.001–1 s−1. A self-consistent model was used to analyze the flow behavior of the constituents and the material. The major results of this research can be summarized as follows:
(1) A viscoplastic model was used to relate the flow stress of β and α + β composite to strain rate and the values of viscosity parameters for β and α + β were calculated at various deformation conditions.
(2) The viscosity parameter of Pb-containing α was calculated using the self-consistent model at different temperatures and strain rates. The viscosity parameters of β and α + β and the volume fractions of the constituents were used as inputs to the model.
(3) The values of the viscosity-like parameters and strain rate sensitivity for β and α + β composite were calculated using the nonlinear viscoplastic equation.
(4) The calculated flow stress of α using the self-consistent model was considerably higher than that of β. The difference was attributed to the lower Zn content in α.
(5) The flow stress of α + β composite was calculated using the law of mixture rule. As the iso-strain condition overestimated the experimental results it was concluded that a considerable strain partitioning should exist between α and β.