Introduction
From the early days of the discovery of the first bacterial cell by Antonie van Leeuwenhoek through the days of Robert Koch and for many years after that, bacteria were regarded as free-living cells co-existing in the medium where they were growing. However, the more we learn about bacteria, the more it becomes apparent that rather than surviving independently, bacteria often form communities of cells called biofilms.Reference Hall-Stoodley, Costerton and Stoodley1, Reference O’Toole, Kaplan and Kolter2
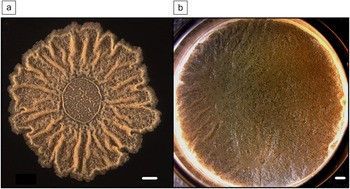
Biofilms are surface-associated groups of cells that are encased in a self-produced extracellular matrix.Reference Costerton, Stewart and Greenberg3, Reference Branda, Vik, Friedman and Kolter4 Extracellular matrix material varies between species; however, common constituents include exopolysaccharides, proteins, or nucleic acids.Reference Branda, Vik, Friedman and Kolter4 The colony shown in Figure 1 is an example of a biofilm that is formed by the bacterial species Bacillus subtilis, a Gram-positive, spore-forming bacterium that is commonly found in the soil. B. subtilis biofilms can be grown in the lab either on semi-solid surfaces such as an agar plate in the form of colonies (Figure 1a) or at the air-liquid interface in the form of pellicles (Figure 1b).Reference Lemon, Earl, Vlamakis, Aguilar and Kolter5 While this review will primarily focus on B. subtilis as a model system, biofilm formation is not limited to these two forms. For example, other organisms are able to form biofilms that adhere to submerged surfaces, and they can reside on the inner surfaces of water and oil pipes.Reference Hall-Stoodley, Costerton and Stoodley1, Reference Davey and O’Toole6, Reference Dunne7 Additionally, biofilms can form in various natural environments such as on the surface of teeth, in wounds, or in the lungs of cystic fibrosis patients. While not all biofilms are detrimental, they can be extremely dangerous when they develop on artificial implants and catheters in hospitals.Reference Costerton, Stewart and Greenberg3, Reference Dunne7, Reference Hatt, Rather and Romeo8
B. subtilis biofilms of strain NCIB3610. (a) Colony grown on a 1.5% agar surface in a biofilm-inducing medium for four days. (b) Pellicle in standing liquid biofilm-inducing medium after two days. The scale bar is 1 mm.

At first observation, one might think that all cells within a biofilm are similar; however, this is not the case. There is a remarkably sophisticated mechanism through which cells in these microbial communities interact. As a result of cell-cell communication, cell growth, nutrient consumption, and waste production, local microenvironments or molecular gradients are formed across a growing biofilm. These gradients lead to phenotypic differentiation, such that constituent cells express different genes in response to the local environment that they are sensing.Reference An and Parsek9–Reference Stewart and Franklin11 In this article, we will discuss how extracellular signals regulate the differentiation of genetically identical cells within bacterial biofilm communities.
Cell-cell communication
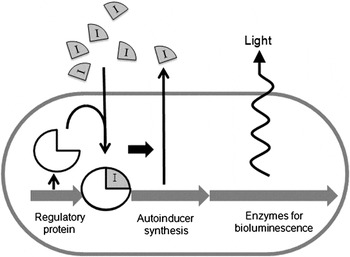
In the early 1960s, since Jacob and Monod’s studies on lactose metabolism, it has been known that bacteria are able to change their physiology as a consequence of extracellular inducers. They discovered that adding lactose to growing Escherichia coli cells induces the expression of the genes that are responsible for the synthesis of the lactose-processing enzyme, beta-galactosidase.Reference Jacob and Monod12 However, it was not until about a decade later that it was found that molecules secreted by bacteria can serve as signals for gene expression. This was observed when media taken from cultures of bacteria, which have already produced extracellular signals, were found to induce gene expression when added to bacteria in a new medium that did not yet contain any signals made by those bacteria. This discovery was made with Vibrio fischeri, a bioluminescent bacterium that can be found in symbiosis with fish and squid.Reference Nealson13–Reference Visick and Ruby15 In this system, an autoinducer synthetase makes a compound that is released from the cell into the medium. This compound is then taken back by the cells, where it is sensed with the help of a receptor protein that recognizes the signal and regulates the expression of genes that are involved in bioluminescence (Figure 2). The concept that enzyme synthesis could be induced by a compound produced by the organism itself was recognized, and this led to the term autoinduction.Reference Nealson, Platt and Hastings14 In the late 1970s and early 1980s, the autoinducer molecule was characterized and shown to be a small molecule termed homoserine lactone.Reference Eberhard, Burlingame, Eberhard, Kenyon, Nealson and Oppenheimer16 While the original molecules identified in Gram-negative bacteria such as V. fischeri were acyl homoserine lactones, other types of signaling molecules have also been identified.Reference Ng and Bassler17 For example, some Gram-positive organisms use small peptides as signaling molecules. In B. subtilis, these peptides regulate cell differentiation, whereas in Enterococcus faecalis, peptides control the transfer of DNA between cells.Reference Ng and Bassler17, Reference Lazazzera18 In contrast, streptomyces use γ-butyrolactones as signaling molecules to regulate different developmental processes depending on the species.Reference Flardh and Buttner19
A model for autoinduction in V. fischeri. An autoinducer (gray I) is produced at basal levels until at some critical concentration, the auto-inducer interacts with a specific regulatory protein (white ¾ circle). This activates the synthesis of luciferase, the enzyme responsible for bioluminescence. This results in a positive feedback loop in which sufficient quantities of auto-inducer upregulate expression of auto-inducer synthesis as well as the production of light.

Since autoinduction was recognized as a signaling mechanism in V. fischeri, it remained rather esoteric in the field of microbiology until the mid-1990s when a huge increase in whole-genome sequencing efforts occurred. By comparing whole genomes of different bacteria, it became clear that genes controlling homologous mechanisms of autoinducer synthesis and response to autoinducers were widely spread among bacteria, including pathogens.Reference Fuqua, Winans and Greenberg20 In a mini-review by Fuqua et al. in 1994, the term “quorum sensing” was coined (also see the Shrout et al. article in this issue).Reference Fuqua, Winans and Greenberg20 According to this idea, at high cell densities, the secreted autoinducer re-enters cells and, at some threshold, a concentration that correlates with increased cell density activates certain genes. This led to the idea that bacteria had ways of counting their numbers. Indeed, autoinduction and quorum sensing work quite nicely in the symbiosis of V. fischeri and the squid Euprymna scolopes. V. fischeri discriminates between existing at low densities where they are in a non-luminescent free-living state and being at high densities in the light organ of the squid where the bioluminescence machinery gets activated.Reference Visick and Ruby15
The wide recognition that bacteria can produce compounds that serve as signals between cells has led to an explosion in investigating this type of cell-to-cell communication in bacteria. Quorum sensing and extracellular signaling are the primary means bacteria use to coordinate behaviors to allow a collection of cells to function as a community.Reference Ng and Bassler17, Reference Di Cagno, De Angelis, Calasso and Gobbetti21
Microbial multicellularity
As described in the introduction, bacterial communities can form biofilms at surfaces or interfaces. For example, in B. subtilis, they form floating pellicles in liquid cultures left standing or remarkably wrinkled colonies if the cells are allowed to grow on semi-solid surfaces such as agar plates (Figure 1).Reference Branda, Gonzalez-Pastor, Ben-Yehuda, Losick and Kolter22 A biofilm can be produced from an individual cell; however, that single cell generates a collection of cells that have different phenotypes even though their genotype is the same. Even more striking is that these different cell types are spatially distributed within the biofilm.Reference Lopez, Vlamakis and Kolter10, Reference Stewart and Franklin11, Reference Veening, Kuipers, Brul, Hellingwerf and Kort23 This indicates that the individual cells within the group are different from each other because they respond to their local microenvironment that is generated by neighboring cells and the molecules they secrete.
Differentiation of cells
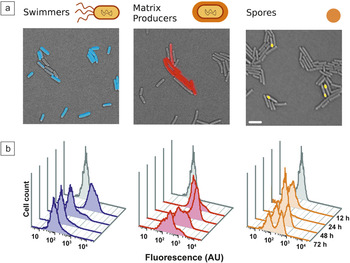
In the study of cell differentiation within B. subtilis biofilms, different cell types can be detected by exploiting our knowledge of the molecular regulation of cell differentiation. The genes that are required for different cell types have been previously described during studies of planktonic B. subtilis.Reference Smits, Kuipers and Veening24, Reference Dubnau and Losick25 Different cell fates can be monitored in space and time by engineering “reporter” cells to fluoresce in a specific color upon expression of specific genes. As an example, three different cell types were studied: motile cells that express flagella that allow them to swim through liquid or swarm on surfaces, matrix producers that are responsible for secreting the extracellular matrix that holds the cells together, and spore formers that are metabolically inactive and are resistant to many environmental stresses.Reference Vlamakis, Aguilar, Losick and Kolter26 The different cell types can be monitored independently by making them express different fluorescent proteins such as cyan fluorescent protein or yellow fluorescent protein. Figure 3a shows that in a population of identical cells that harbor reporters for motility (false-colored blue), matrix production (false-colored red), or sporulation (false-colored yellow), only a subpopulation of the cells express these genes. Thus, despite the fact that they are genetically identical, these cells display phenotypic heterogeneity where only a fraction of the population exhibits any given phenotype.Reference Vlamakis, Aguilar, Losick and Kolter26
Phenotypic differentiation of genetically identical cells. Different cells were engineered to express a fluorescent protein under the control of cell-type specific promoters to report on a specific function. Three cell types were chosen: motile cells (left panel, false colored blue), matrix production (middle panel, false colored red), or sporulation (right panel, false colored yellow). (a) Overlay of fluorescence microscopy image (colors of fluorescing cells as described earlier) with transmitted light image in which non-fluorescing cells are shown in gray. Scale bar is 2 μm. (b) Flow cytometry analysis of 30,000 cells harboring the designated reporters from biofilms harvested at 12, 24, 48, and 72 hours of biofilm development. Y-axis is the number of cells, and x-axis is the fluorescence intensity in arbitrary units (AU). The gray peak in each image represents background fluorescence of cells that do not have any fluorescent protein. (b) Reprinted with permission from Reference Reference Vlamakis, Aguilar, Losick and Kolter26. ©2008, Cold Spring Harbor Laboratory Press.

In order to quantify the proportions of these different cell types within large populations, flow cytometry has been used. Flow cytometry is a method designed to very quickly count thousands of cells that individually pass through a laser beam where the fluorescent protein is excited and fluorescence intensity of each cell is recorded. One can then plot the cell count as a function of fluorescence and define changes in fluorescence relative to a control, which is composed of the same bacterial cells without the fluorescent marker. Using this technique, cells within biofilms were analyzed over the development of the community.Reference Vlamakis, Aguilar, Losick and Kolter26 In Figure 3b, the number of cells harboring the motility, matrix production, or sporulation-specific fluorescent reporters was monitored after 12, 24, 48, and 72 hours. At early time points, all of the cells are motile, and very few express matrix genes. As time progresses, cells begin to produce a matrix as the number of motile cells decreases. Eventually, by 48 and 72 hours, sporulation commences as matrix production begins to shut down. This tells us that the population is quite dynamic during development and that, at any given time point, multiple cell types co-exist. In fact, by 48 hours of biofilm formation, all three of the cell types that were examined were present in the community.Reference Vlamakis, Aguilar, Losick and Kolter26 In the following sections, we describe in more detail the specific signaling molecules and environmental conditions that trigger cells to differentiate from one cell type to another.
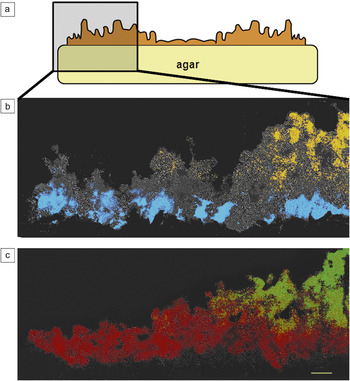
To locate the differentiated cells spatially, biofilms were analyzed using thin sectioning and fluorescence microscopy. Whole colonies were frozen and thin sectioned and visualized using both light and fluorescence microscopy.Reference Vlamakis, Aguilar, Losick and Kolter26 When the motility and sporulation reporters are present in an individual strain, motile cells are seen to localize at the base and edge of the colony, and the sporulating cells are in the top, farthest away from the nutrients (Figure 4). In contrast, cells that express genes for the production of extracellular matrix localize in patches throughout the colony, and those cells preferentially become the spore forming cells. These cell types arise as a consequence of cell-to-cell signaling, which is described in detail in the next section.
(a) Schematic of a thin sectioned side view of a colony. (b–c) Composite image of transmitted light (gray) and fluorescent images of cells depicted by the box in (a). Reporters for (b) motility (false colored blue) and sporulation (false colored yellow), and (c) matrix production (false colored red) and sporulation (false colored green). Scale bar is 50 μm. Reprinted with permission from Reference Reference Vlamakis, Aguilar, Losick and Kolter26. ©2008, Cold Spring Harbor Laboratory Press.

Regulation of differentiation (paracrine signaling)
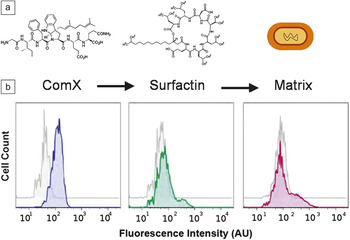
Specifically, we will focus on the differentiation of matrix-producing cells. This occurs in a manner that is different from the traditional quorum-sensing model in that not all of the cells respond to the signaling molecule. A self-produced signaling molecule, surfactin, can trigger matrix production in B. subtilis.Reference Lopez, Fischbach, Chu, Losick and Kolter27 Surfactin production is also regulated by an extracellular signaling molecule, ComX.Reference Hahn and Dubnau28, Reference Magnuson, Solomon and Grossman29 ComX is a small peptide that serves as a signal and functions in a typical quorum-sensing mechanism.Reference Magnuson, Solomon and Grossman29 The schematic in Figure 5a shows the known relationship among the three functions: ComX is a signaling molecule, leading to the formation of a second type of molecule, surfactin, which eventually signals the cells to make extracellular matrix.Reference Lopez, Vlamakis, Losick and Kolter30 The unique feature of this signaling pathway, as we describe later, is that it is directional, leading to the existence of two coexisting, yet different, cell types: surfactin producers and matrix producers.
(a) Molecular structures of the signaling molecules ComX and surfactin. ComX is a signaling molecule that is sensed by cells that respond by differentiating into surfactin producers. Surfactin, in turn, signals for cells to make extracellular matrix. (b) Flow cytometry data of cells harboring fluorescent reporters for ComX (left), surfactin (middle), and matrix (right). Y-axis is the number of cells, and x-axis is the fluorescence intensity in arbitrary units (AU). The gray peak in each image represents background fluorescence of cells that do not have any fluorescent protein. Figure adapted from Reference Reference Lopez, Vlamakis, Losick and Kolter30.

ComX appears to behave as a standard quorum-sensing molecule in that there is a unimodal distribution of the reporter cells that are expressing comX.Reference Lopez, Vlamakis, Losick and Kolter30 This suggests that all of the cells produce ComX (assuming transcription of the comX gene is a good proxy for ComX production). On the other hand, both surfactin and matrix gene expression occur in a bimodal distribution when cells are analyzed by flow cytometry (Figure 5b), with only a subpopulation expressing surfactin and matrix genes in a level higher than the background. This indicates that despite the fact that all cells produce the ComX signaling molecule, only a subpopulation of cells responds by producing surfactin. Additionally, only a subpopulation of cells responds to the presence of surfactin by expressing matrix genes.Reference Lopez, Vlamakis, Losick and Kolter30
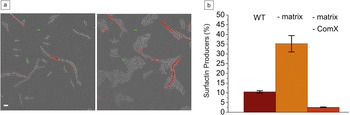
As shown in Figure 5b, only a small population of cells appears to be involved in surfactin and matrix production. This leads to the question if surfactin and matrix are produced by the same subpopulation of cells or if signaling is directional? The claim that signaling is directional can be made only if the cell producing the signal is different than the cell responding to it. To show that there are indeed two populations, bacteria harboring reporters for both surfactin (false-colored green) and matrix production (false-colored red) were analyzed. By fluorescence microscopy, only green or red cells expressing either the surfactin or matrix reporter were observed, and no individual cell ever expressed both reporters (Figure 6a).
(a) Time lapse images taken four hours apart of cells harboring reporters, for both surfactin (YFP—fluorescent cells, false colored green) and matrix production (CFP—fluorescent cells, false colored red). Cells that are not fluorescing in either the cyan or yellow fluorescent protein (CFP or YFP) channel are depicted in gray. The scale bar is 2 μm. (b) The percentage of surfactin producers of the entire population, calculated from flow cytometry data in wild type (WT) compared to mutants that are unable to produce matrix (-matrix) or lacking matrix and ComX genes (-matrix, -ComX). Matrix mutants express surfactin more than WT cells; however, no surfactin is produced by the double mutants (-matrix -ComX). Figure adapted from Reference Reference Lopez, Vlamakis, Losick and Kolter30.

Now we are left with a conundrum: Two extracellular signals are produced, ComX and surfactin, yet despite the fact that all of the cells should have access to those signals, only a subpopulation of cells responds by altering gene expression. Time-lapse microscopy of the dual-labeled strain for surfactin and matrix production has given a hint as to why surfactin-producing cells do not respond to the surfactin they produce by expressing matrix genes. In a field of cells that is observed over a period of four hours, while matrix-producing and other cells continue to grow, the cells expressing surfactin genes do not seem to grow or divide (see the same number of surfactin-producing, green colored cells, in the left and right panels of Figure 6a). Thus, when cells produce surfactin, they appear to be in a transient state of non-growth, and perhaps this is why they are incapable of responding to the signal.Reference Lopez, Vlamakis, Losick and Kolter30 This leads to directional signaling, where one cell responds to ComX and produces surfactin, while a different cell (that does not make surfactin) responds to surfactin and produces matrix.
It appears that these two cell types co-exist, and the image analysis as well as flow cytometry data show that the two cell types are mutually exclusive (Figure 6a).Reference Lopez, Vlamakis, Losick and Kolter30 But what prevents matrix-producing cells from sensing the ComX that is still present in the environment and becoming surfactin producers? A series of genetic experiments led to the conclusion that it is, in fact, the presence of the extracellular matrix that prevents cells from sensing the ComX signal.Reference Lopez, Vlamakis, Losick and Kolter30 By using flow cytometry to count the number of cells in the population that express the surfactin-production genes, a small proportion of cells in the wild type (cells that have no introduced mutations in their genome) are measured. However, when the same analysis is performed in a mutant strain that is unable to produce matrix, there is a great increase in the number of cells that express surfactin (Figure 6b). This increase in surfactin-producing cells was shown to still depend on the presence of the ComX signal because in the matrix deficient mutant that also does not make ComX, no surfactin is produced. All of these data support the concept that signaling between bacterial cells in a given population can be much more sophisticated than what might be predicted from the basic quorum-sensing model.
Summary
There has been much data recently showcasing that genetically identical cells within biofilm communities display distinct phenotypes and that there is indeed phenotypic heterogeneity in these populations. In this review, we have used the model organism B. subtilis as an example to highlight a few major concepts in bacterial differentiation in the context of biofilms. In B. subtilis biofilms, several different cell types co-exist, and the proportion of each population changes throughout biofilm development. Certain cells localize to discrete regions of the biofilm, with motile cells localizing to regions of high nutrients, matrix-producing cells localizing in patches throughout the biofilm, and spores forming at the regions of least nutrient availability. Extracellular signaling is essential for differentiation of these cell types.
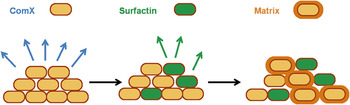
An additional important take-home message is that aside from the concept of quorum sensing, which is an example of autocrine signaling (a cell that makes the signal also responds to it), there is a new concept of paracrine signaling in bacteria. Paracrine signaling is directional in that different cells make and respond to a signal. The current model for paracrine signaling in B. subtilis is shown in Figure 7. All of the cells produce the ComX signal, but only a subpopulation responds to that signal by becoming surfactin producers. These become an unusual cell type in that they do not grow, and they do not respond to the surfactin they produce to become matrix producers. The mechanism that regulates this process remains poorly defined, but some cells sense surfactin and respond to it by becoming matrix producers. Matrix producers never become surfactin producers because the matrix itself renders them insensitive to the action of ComX. The exact mechanism for this insensitivity has yet to be identified. Nevertheless, this provides a means by which surfactin and matrix-producing cells can persist through several generations even in the presence of the signals that cause their differentiation.
Schematic of the current model for paracrine signaling in B. subtilis. All the cells produce ComX (yellow cells, left panel), but only a subpopulation responds to this signal and produces surfactin (green cells in middle and right panels). This signal is directional, and therefore surfactin producers do not become matrix producers (yellow cells with orange border, right panel). Rather, other cells (but still a small subpopulation of cells) respond by producing extracellular matrix.

Ultimately, understanding the complexities that arise in cell-to-cell signaling in bacterial biofilms will allow us to develop methods to interfere with cell differentiation within a developing biofilm. Specifically, since biofilms form on surfaces, a reasonable approach to prevent their formation is to engineer surfaces that would slowly release signaling molecules that would interfere with the “correct” process of differentiation and therefore prevent the formation of a functional biofilm.