Introduction
Throughout the world, many people routinely use more than one language to communicate (Moreno and Kutas, Reference Moreno and Kutas2005), and they seem to carry the roughly doubled load associated with bilingualism without apparent difficulty. Bilingualism is somewhat less common in the United States, but the number of bilinguals is substantial (approximately 20 percent of the population) and rapidly increasing (US Census, 2000). The existence of both bilingualism and monolingualism provides an opportunity to examine the mechanisms of language production by asking how bilingualism influences the ability to rapidly produce words in each language.
Bilinguals seem to effortlessly use both languages at high levels of proficiency in daily language use. However, bilingualism does introduce some processing costs. Compared to monolinguals, bilinguals name fewer pictures on standardized tests such as the Boston Naming Test (Roberts, Garcia, Desrochers and Hernandez, Reference Roberts, Garcia, Desrochers and Hernandez2002; Gollan, Fennema-Notestine, Montoya and Jernigan, Reference Gollan, Fennema-Notestine, Montoya and Jernigan2007), name pictures more slowly (Gollan, Montoya, Fennema-Notestine and Morris, Reference Gollan, Bonanni and Montoya2005), experience more tip-of-the-tongue (TOT) retrieval failures (Gollan and Silverberg, Reference Gollan and Silverberg2001) and have reduced verbal fluency (Gollan, Montoya and Werner, Reference Gollan and Acenas2002; Rosselli et al., Reference Rosselli, Ardilla, Arujo, Weekes, Caracciolo, Padilla and Ostrosky-Solis2000). Importantly, bilinguals are relatively less fluent than monolinguals, even when tested exclusively in their dominant (Gollan and Acenas, Reference Gollan and Acenas2004, Gollan, Bonanni and Montoya, Reference Gollan, Montoya, Fennema-Notestine and Morris2005) and first-learned language (Ivanova and Costa, Reference Ivanova and Costa2008; Ransdell and Fischler, Reference Ransdell and Fischler1987).
Although recent work confirms the presence of a bilingual disadvantage in the verbal fluency task (e.g., Portocarrero, Burright, and Donovick, Reference Portocarrero, Burright and Donovick2007; Bialystok, Craik and Luk, Reference Bialystok, Craik and Luk2008a), the mechanism explaining this disadvantage remains unclear. In the fluency task (see, e.g., Benton, Hamsher and Sivan, Reference Benton, Hamsher and Sivan1983), speakers are typically given one minute to name members of a semantic (e.g., “animals”) or letter category (e.g., “words that begin with s”). Perhaps the most obvious possible difference between bilinguals and monolinguals that could explain the bilingual disadvantage is that only bilinguals may need to simultaneously retrieve target language exemplars while controlling interference from the non-target language. Unintended activation of words from the non-target language could delay retrieval of target language exemplars, thus leading bilinguals to produce fewer correct responses than monolinguals. A related alternative possibility is that bilinguals simply retrieve target language exemplars more slowly than monolinguals, but without any direct interference from the non-target language (e.g., Gollan, Montoya, Cera and Sandoval, Reference Gollan, Montoya, Cera and Sandoval2008). A third, and qualitatively distinct, mechanism that could also lead to a bilingual fluency disadvantage is between-group differences in language-specific vocabulary knowledge. Bilinguals clearly know many more words than monolinguals when words from both languages are counted, but within each language bilinguals may know fewer names than monolinguals (e.g., Bialystok et al., Reference Bialystok, Craik and Luk2008a; Gollan and Acenas, Reference Gollan and Acenas2004; Gollan and Brown, Reference Gollan and Brown2006). Of course, it is possible that more than one mechanism concurrently affects bilingual verbal fluency (i.e., that these accounts are not mutually exclusive), in which case the question can then be framed as to which mechanism is primarily responsible for producing the reported bilingual disadvantage in verbal fluency.
To distinguish between the three alternative accounts of the bilingual disadvantage (interference between languages, retrieval slowing without interference, and reduced vocabulary), it is useful to consider the qualitative aspects of responses produced. Although all three mechanisms can explain the bilingual disadvantage, they make distinct predictions in terms of how bilingualism should influence retrieval time-course, the average word-frequency count of exemplars produced, and the rate of cross-language intrusions.
Retrieval slowing with interference between languages: the dual-task analogy
A common assumption in models of bilingual language processing is the notion of active interference between languages (Green, Reference Green1998; for reviews of the evidence for and against the interference assumption, see Costa Reference Costa, Kroll and de Groot2005; Kroll, Bobb and Wodniecka, Reference Kroll, Bobb and Wodniecka2006; Kroll, Bobb, Misra and Guo, Reference Kroll, Bobb, Misra and Guo2008; La Heij, Reference La Heij, Kroll and de Groot2005). On this view, bilinguals cannot “turn one language off” to effectively act as monolingual speakers. As such, when bilinguals speak one language, the other language continues to be active and must be inhibited. Some of the most compelling evidence that bilingualism entails a constant exercise in inhibitory control comes indirectly in the form of enhanced executive control mechanisms for bilinguals throughout the lifespan. For example, bilingual children performed better than monolingual children on a card-sorting task (Bialystok and Martin, Reference Bialystok and Martin2004), in which participants need to switch from previously learned sorting rules (e.g., color) to new rules (e.g., shape). Similarly, older bilinguals outperformed age-matched monolinguals on a Simon task (Bilaystok, Craik, Klein and Viswanathan, Reference Bialystok, Craik, Klein and Viswanathan2004; see also Bialystok, Craik and Ryan, Reference Bialystok, Craik and Ryan2006; Craik and Bialystok, Reference Craik and Bialystok2006; Bialystok, Reference Bialystok, Kroll and de Groot2005), in which participants attempt to follow a rule (e.g., press the right key when you see a red square) when it is presented either congruently (on the right side) or incongruently (on the left) with a competing prepotent cue (side of the screen). A similar advantage was recently reported in young adult bilinguals at the peak of their attentional control abilities (using the Attentional Network Task; Costa, Hernandez and Sebastián-Gallés, Reference Costa, Hernandez and Sebastián-Gallés2008). Finally, more recent evidence associates bi- or multilingualism with “cognitive reserve” and a delay in age- or dementia-related cognitive decline (Bialystok, Craik and Freedman, Reference Bialystok, Craik and Freedman2007; Kavé, Eyal, Shorek and Cohen-Mansfield, Reference Kavé, Eyal, Shorek and Cohen-Mansfield2008). Such bilingual advantages are typically attributed to the need to control the non-target language each time bilinguals speak. By implication, bilingual advantages in such tasks imply selection by competition and the use of general mechanisms of executive control for resolving competition in lexical selection.
In studies of bilingual language processing, the role of inhibitory control has been more controversial, sometimes revealing evidence for (e.g., Hermans, Bongaerts, De Bot and Schreuder, Reference Hermans, Bongaerts, De Bot and Schreuder1998) and other times evidence against (e.g., Costa and Carmazza, Reference Costa and Caramazza1999) competition for selection between languages. Some experimental findings suggest that dominant language production is relatively immune to competition between languages (Gollan, Montoya et al., Reference Gollan, Bonanni and Montoya2005; Gollan et al., Reference Gollan, Montoya, Cera and Sandoval2008), particularly in balanced bilinguals (e.g., Costa and Caramazza, Reference Costa and Caramazza1999; Costa and Santesteban, Reference Costa and Santesteban2004). Notably, a similar debate is active within studies of monolingual language production, with some arguing for the notion of competition for selection between semantically related lexical representations (e.g., Levelt, Roelofs and Meyer, Reference Levelt, Roelofs and Meyer1999), and others arguing against such competition (e.g., Costa, Alario and Caramazza, Reference Costa, Alario and Caramazza2005).
Although inhibitory control may play a limited role (or no role; Finkbeiner, Almeida, Janssen and Caramazza, Reference Finkbeiner, Almeida, Janssen and Caramazza2006) in picture naming in the dominant language (e.g., Gollan, Montoya et al., Reference Gollan, Montoya, Fennema-Notestine and Morris2005; Gollan et al., Reference Gollan, Montoya, Cera and Sandoval2008), the role of inhibitory control may be greater in other tasks. For example, language mixing has relatively little effect on non-dominant language production, but a powerful effect on dominant language production (e.g., Meuter and Allport, Reference Meuter and Allport1999), in some cases leading language dominance to reverse (such that bilinguals name pictures more quickly in their usually non-dominant language; e.g., Christoffels, Firk and Schiller, Reference Christoffels, Firk and Schiller2007). Dominance reversal implies a strong role for inhibitory control of the dominant language during language mixing (Kroll et al., Reference Kroll, Bobb, Misra and Guo2008; Gollan & Ferreira, Reference Gollan and Ferreira2009) and, by extension, support for the assumption of competition for selection between languages.
The majority of studies designed to test the interference account have used the picture-naming task. The verbal fluency task differs from picture naming in important ways and affords the possibility of viewing production processes under a different magnifying glass. Picture-naming tasks are relatively constrained in that speakers must produce a single specific target word when provided with a stimulus that activates a single concept. Once the picture name is retrieved, the speaker can move on to the next word and is again provided with a stimulus (a different picture) that activates another single concept. In contrast, in the verbal fluency task, speakers are given a single cue (a category name) which activates multiple concepts, and then they must select one name at a time, selecting among several alternatives without being given any additional cues to assist them in selecting one concept over another, and while also needing to suppress just-produced exemplars, and to continue to search their lexicon to maintain production as fluently as possible. Because natural language production no doubt also entails simultaneous activation of multiple concepts and extended production of more than a single word at a time, the verbal fluency task is at least in some respects more similar to natural production than is picture naming. Of course picture naming is arguably more similar to natural production in other respects, particularly considering letter fluency (speakers seldom, if ever, need to produce a sequence of words that begin with the same sound), but also semantic fluency (e.g., sequences of content words are not typically all semantically related). Given that the verbal fluency task necessarily activates multiple related lexical representations, it may be ideally suited for revealing the possible effects of between-language interference in bilinguals, and competition for selection within languages in monolinguals.
Retrieval slowing without interference: the weaker links account
A different view of bilingual disadvantages assumes that bilingualism affects language production indirectly via frequency of use. On this account, bilingual disadvantages arise simply because bilinguals use each language only some of the time, and therefore use words in each language relatively less often than monolinguals, who use just one language all the time (for detailed explanation, see Gollan et al., Reference Gollan, Montoya, Cera and Sandoval2008; see also Ivanova and Costa, Reference Ivanova and Costa2008; Lehtonen and Laine, Reference Lehtonen and Laine2003; Mägiste, Reference Mägiste1979; Nicoladis, Palmer and Marentette, Reference Nicoladis, Palmer and Marentette2007; Pearson, Reference Pearson1997; Ransdell and Fischler, Reference Ransdell and Fischler1987). This account has been called the “weaker links” account to distinguish it from interference (Gollan et al., Reference Gollan, Montoya, Cera and Sandoval2008), and explains bilingual disadvantages in an emergent way by relying on the well-established relationship between degree of language use and lexical accessibility, such that high-frequency words are accessed more quickly than low-frequency words (e.g., Oldfield and Wingfield, Reference Oldfield and Wingfield1965; Scarborough, Cortese and Scarborough, Reference Scarborough, Cortese and Scarborough1977).
The most direct evidence supporting the weaker links account is that the bilingual disadvantage in picture naming is greater when producing low-frequency than high-frequency picture names (Gollan et al., Reference Gollan, Montoya, Cera and Sandoval2008; Ivanova and Costa, Reference Ivanova and Costa2008). The greater bilingual disadvantage for low-frequency words is expected, according to the weaker links hypothesis, because low-frequency words are more sensitive to small differences in degree of use than high-frequency words (for review, see Murray and Forster, Reference Murray and Forster2004). Also consistent with weaker links is that language dominance effects patterned similarly; bilinguals named pictures in the less-frequently used language more slowly than the dominant language, but language dominance effects were especially large for low-frequency words. A different way of stating both results is to say that bilinguals showed a greater frequency effect than monolinguals, and the non-dominant language showed a greater frequency effect than the dominant language. The increased size of the frequency effect in bilinguals relative to monolinguals suggests that bilinguals lag behind monolinguals in language-specific language use. Because of a ceiling effect on the extent to which increased frequency of use can increase lexical accessibility (e.g., Griffin and Bock, Reference Griffin and Bock1998), decreased language use associated with bilingualism leads to a greater disadvantage for accessing low- rather than high-frequency words.
To distinguish weaker links from interference mechanisms of the bilingual advantage we examine word-frequency counts of exemplars that bilinguals and monolinguals produce. Having identified a greater bilingual disadvantage for low-frequency words in picture naming (Gollan et al., Reference Gollan, Montoya, Cera and Sandoval2008; Ivanova and Costa, Reference Ivanova and Costa2008), the weaker links account predicts that bilinguals will be less likely than monolinguals to retrieve low-frequency words, and thus on average will produce higher-frequency exemplars than monolinguals. The interference hypothesis makes the opposite prediction concerning word frequency. Because high-frequency words are more readily accessible in both languages than low-frequency words (e.g., most Spanish–English bilinguals know how to say “carrot” in both languages, but they might know “eggplant” in just one language), the possibility for interference between languages should be greatest for high-frequency words (for detailed explanation, see Gollan et al., Reference Gollan, Montoya, Cera and Sandoval2008). If competition between languages is greater for high-frequency translations, then bilinguals should produce fewer high-frequency exemplars than monolinguals, and thus on average will produce lower-frequency exemplars than monolinguals in the fluency task (the opposite prediction of the weaker links account). Note the counter-intuitive nature of this prediction, given the finding that production of low-frequency words is particularly difficult for bilinguals (Gollan et al., Reference Gollan, Montoya, Cera and Sandoval2008; Ivanova and Costa, Reference Ivanova and Costa2008). Thus, the frequency of words produced in the verbal fluency task provides a further test of competition mechanisms and the possibility of distinguishing between the weaker links and interference mechanisms of the bilingual fluency disadvantageFootnote 1.
If bilinguals and monolinguals differ with respect to the word frequency of responses produced, it will be important to determine whether this result could be attributed to cognate status – translations that are similar between languages (e.g., saxophone–saxofón). Bilinguals produce cognates more easily than non-cognates (Costa, Caramazza and Sebastián-Gallés, Reference Costa, Caramazza and Sebastián-Gallés2000; Gollan and Acenas, Reference Gollan and Acenas2004). If cognates are updated for frequency in both languages each time they occur in either language, then cognates will be about as high frequency for bilinguals as they are for monolinguals, non-cognates (in both languages) will be lower frequency for bilinguals than they are for monolinguals, and cognate frequencies in the bilingual lexicon would be systematically underestimated by monolingual frequency counts in terms of their rank order relative to non-cognate frequencies. As such, below we consider whether bilinguals produce more cognates than monolinguals, and if so how this influences the frequency count of exemplars produced by bilinguals and monolinguals. Consideration of cognate status also provides an additional opportunity to evaluate the possible effects of bilingualism on verbal fluency; cognate effects would support the notion that dual-language activation affects verbal fluency.
The reduced vocabulary hypothesis: the category size analogy
The third alternative explanation for the bilingual verbal fluency disadvantage is that bilinguals may be retrieving words from a slightly smaller pool of exemplar names than monolinguals. The fluency task typically restricts responses to just one language (but see Gollan et al., Reference Gollan, Montoya and Werner2002; de Picciotto and Friedland, Reference de Picciotto and Friedland2001), and within each language, bilinguals may not know, or may be unable to access, as many words as monolinguals. Supporting the notion of vocabulary differences between bilinguals and monolinguals, studies reveal that bilinguals have lower receptive vocabulary scores than monolinguals on standardized tests such as the Peabody Picture Vocabulary Test (PPVT; e.g., Bialystok, Craik and Luk, Reference Bialystok, Craik and Luk2008b). Because comprehension generally precedes production in lexical accessibility, any differences that can be observed on comprehension-based measures (such as the PPVT) will likely be present in tasks (like verbal fluency) that require language production. In both production and comprehension, reduced vocabulary knowledge in bilinguals is likely to specifically reflect reduced knowledge of relatively low-frequency words (because higher-frequency words will be learned before low-frequency words). Consistent with this notion, studies of the TOT phenomenon (which focus exclusively on production of very-low-frequency words, e.g., periscope) suggest that bilinguals are more likely to fail to retrieve a known word (have more TOTs) than monolinguals. The same studies also show that bilinguals reported recognizing fewer target words than monolinguals, that is, they have reduced knowledge of low-frequency vocabulary words in their dominant language relative to monolinguals (Gollan and Silverberg, Reference Gollan and Silverberg2001; Gollan and Acenas, Reference Gollan and Acenas2004; Gollan, Bonanni and Montoya, Reference Gollan, Bonanni and Montoya2005; Gollan and Brown, Reference Gollan and Brown2006).
Thus, the reduced vocabulary hypothesis leads to similar predictions as the weaker links account in terms the frequency of exemplars. However, it is possible to distinguish between weaker links and vocabulary by examining the time-course of retrieval. Because speakers produce progressively lower-frequency words with increased time into the fluency trial (Crowe, Reference Crowe1998), and bilinguals’ vocabulary knowledge is smaller at the low-frequency end of the lexicon, the reduced vocabulary mechanism predicts that the bilingual disadvantage should be absent at the beginning of the trial, and should emerge primarily towards the end of the fluency trial. In contrast, the interference account predicts a robust bilingual disadvantage at the beginning of the fluency trial (where competition between languages is most likely), as does the weaker links account, because, although smaller for high-frequency words, a bilingual disadvantage was observed for both high- and low-frequency words (Gollan, Montoya et al., Reference Gollan, Montoya, Fennema-Notestine and Morris2005; Gollan et al., Reference Gollan, Montoya, Cera and Sandoval2008).
Measuring the time-course of retrieval: the fulcrum point
To measure the retrieval time-course we rely on a measure that was developed in the context of research on monolingual verbal fluency performance. To this end, we draw an analogy between the mechanisms of the bilingual disadvantage and factors known to influence fluency performance in monolinguals. The first analogy is between the interference account and dual-task effects on verbal fluency production. After a bilingual speaker retrieves an exemplar in the target language, the search for additional category members could easily trigger activation of translation equivalents in the non-target language. If bilinguals cannot prevent retrieval of exemplar names from both languages, they would need to monitor the language of output to avoid producing cross-language intrusions. In contrast, monolinguals need only retrieve category names in the one language they know. On this view, the task demands associated with verbal fluency are greater for bilinguals, who are essentially engaged in two concurrent tasks.
Rohrer, Wixted, Salmon and Butters (Reference Rohrer, Wixted, Salmon and Butters1995) found that when monolingual speakers were asked to produce category members while concurrently performing a secondary task (i.e., monitoring the number of dots that appeared on a computer screen by finger tapping), they produced fewer category members, took longer to produce a first response and, most importantly in the present context, their subsequent responses were delayed such that a greater proportion were produced towards the end of the trial, when compared with single-task settings. As a measure of the relative distribution of responses across the fluency trial in single- versus dual-task situations, Rohrer et al. (Reference Rohrer, Wixted, Salmon and Butters1995) introduced a measure that they called “mean response latency”, which is the average time to produce each response with each time calculated from the beginning of the trial. The effect of dual tasking on mean retrieval latency is most easily understood by considering a hypothetical case in which the same number of correct responses is produced in both single- and dual-task settings. For example, assume speakers correctly retrieve in both single- and dual-task settings all four exemplars of a category with just four exemplars (e.g., primary directions on a compass). In the single task these might be retrieved at 2, 4, 6 and 8 seconds, resulting in a mean retrieval latency of (4 + 6 + 8) / 3 (i.e., 6.0) (first response latencies are excluded because they may reflect different processes related to initiating production, though this exclusion does not have a very big effect on mean retrieval latencies; Rohrer et al., Reference Rohrer, Wixted, Salmon and Butters1995). During the dual task, each response is delayed because of the need to carry out the secondary task, and so responses might be retrieved at 3, 6, 9 and 12 seconds for a mean time of (6 + 9 + 12) / 3 (i.e., 9.0).
Importantly, when measured this way (with each exemplar time counted from the beginning of the trial), mean retrieval latency is not a simple measure of response speed; generalized slowing does not necessarily lead to longer mean response latencies. To avoid confusion between Rohrer et al.'s mean response latency measure and simple measures of response speed, we refer to mean response latency as the “fulcrum point’, which illustrates that the measure reflects the balance of responses in terms of when they occur across the fluency trial. As an example, monolinguals with Alzheimer's disease named pictures much more slowly than age-matched controls (between 14% and 22% more slowly in Thompson-Schill, Gabrieli and Fleischman, Reference Thompson-Schill, Gabrieli and Fleischman1999; see also Vandenberghe, Vandenbulcke and Weintraub, Reference Vandenberghe, Vandenbulcke and Weintraub2005), but produced significantly shorter fulcrum points than age-matched controls in the fluency task (Rohrer et al., Reference Rohrer, Wixted, Salmon and Butters1995; Rohrer, Salmon, Wixted and Paulsen, Reference Rohrer, Salmon, Wixted and Paulsen1999). This point illustrates how straightforward comparisons of reaction times and fulcrum points are misleading. What is critical for influencing the fulcrum point is the relative distribution of responses during the trial; longer fulcrum points indicate a greater proportion of the total responses produced toward the end of the trial. Patients with Alzheimer's disease have shorter (but not faster) mean retrieval latencies in category fluency because they produce exemplars at the beginning of the trial but then exhaust their pool of retrievable responses more quickly. In contrast, age-matched controls continue retrieving exemplars well into the minute-long trial, consequently yielding longer mean retrieval latencies.
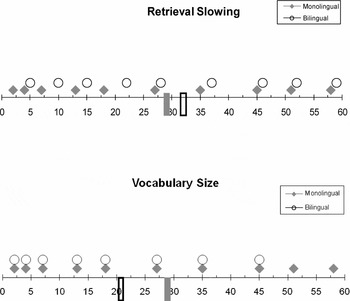
Figure 1a displays the expected differences between bilinguals and monolinguals in predicted the mean fulcrum point if the bilingual fluency disadvantage arises because of interference between languages that effectively places bilinguals under dual-task demands. Here, we assume that the bilingual to monolingual comparison should resemble the dual- to single-task comparison reported in prior studies. As such, bilinguals should produce fewer correct responses, delayed first response times, and a later fulcrum point than monolinguals. The pronounced delay in fulcrum point is expected because some of the time, and particularly early on in the fluency trial (where between-language interference should be greatest), bilinguals will retrieve names in the non-target language, and will need to suppress the production of these words before retrieving additional target language exemplars.
Idealized response latencies representing (1a) retrieval slowing and (1b) the reduced vocabulary hypothesis in a single trial of verbal fluency. Bilingual data are represented by circles and monolinguals’ data are represented by the diamonds. The solid rectangles on the x-axis indicate the fulcrum points for bilinguals and monolinguals in each hypothetical case. The panel entitled “Retrieval Slowing” illustrates the predictions of the interference account (1a): bilinguals’ responses are shifted to the right, particularly at the beginning of the trial where between-language interference is greatest. The panel entitled “Vocabulary Size” illustrates the reduced vocabulary hypothesis (1b): bilinguals have shorter fulcrum points because they exhaust their pool of retrievable responses prior to monolinguals.

The prediction of the weaker links hypothesis with respect to fulcrum points depends on an additional assumption: Can speakers search a semantic category for exemplars at the same time as they produce the name of an already identified category member? If search and production cannot proceed in parallel, then retrieval slowing will be cumulative across the fluency trial, such that with each consecutive exemplar produced, bilinguals’ fulcrum points will be increasingly delayed relative to those of monolinguals. For example, in picture-naming studies, the extent of slowing related to bilingualism for producing each picture name was 80–150 ms (Gollan, Montoya et al., Reference Gollan, Bonanni and Montoya2005; Gollan et al., Reference Gollan, Montoya, Cera and Sandoval2008). As such, a category that leads speakers to retrieve approximately 10 exemplars should yield a delay in fulcrum point on the order of about 0.8 to 1.5 seconds (e.g., 10 × 150 ms = 1,500 ms), and the weaker links account would predict a small delay in fulcrum point for bilinguals relative to monolinguals.
Alternatively, if category search can proceed in parallel with production of a selected exemplar (for review, see Rohrer, Pashler and Etchegaray, Reference Rohrer, Pashler and Etchegaray1998), then there should be virtually no change in fulcrum points associated with bilingualism, according to the weaker links account. This is because differences of 80–150 ms are negligible when considered with respect to fulcrum points on the order of 25–30 seconds within a minute-long verbal fluency trial, and in a parallel model, the delay associated with bilingualism would not be cumulative across exemplars because bilinguals could search for subsequent exemplars while producing each exemplar. Note that the fulcrum point is an average, therefore, if each bilingual response is slowed by (for example) 150 ms, but category search can proceed at the same time as production, then the fulcrum point will only be right-shifted by 150 ms, according to the weaker links account.
To outline the predictions of the vocabulary size account, we draw a second analogy between category size effects on monolingual fluency and the bilingual effect. Smaller category size introduced the opposite effect on fulcrum point relative to dual-task effects (Rohrer et al., Reference Rohrer, Wixted, Salmon and Butters1995). Whereas dual-task conditions delayed the fulcrum point, when speakers retrieved exemplars from smaller categories they had earlier fulcrum points than when retrieving exemplars from larger categories (Rohrer et al., Reference Rohrer, Wixted, Salmon and Butters1995). This difference was obtained because, when producing exemplars from smaller categories, speakers produced a greater proportion of exemplars at the beginning of the trial, and then approached asymptote more quickly than when retrieving from larger categories. Thus, when speakers can retrieve a smaller number of exemplars, whether because of smaller category size or because of reduction in knowledge as a consequence of Alzheimer's disease, speakers exhaust their knowledge of exemplars by the end of the trial and fulcrum points are shortened (or pushed to the left). Figure 1b illustrates the expected difference between bilinguals and monolinguals in mean fulcrum point if the bilingual fluency disadvantage stems from reduced language-specific vocabulary relative to monolinguals. To illustrate, if bilinguals can only generate four exemplars in a certain category, these might be retrieved at 4, 9, 12 and 21 seconds, resulting in a fulcrum point of (9 + 12 + 21) / 3 (i.e., 14.0) seconds. Monolinguals producing words at the same rate, but who generate more than four words, for example at 4, 9, 12, 21, 28 and 35 seconds, would have later fulcrum points (9 + 12 + 21 + 28 + 35) / 5 (i.e., 21.0) seconds.
To summarize, the bilingual fluency disadvantage can be explained by between-language interference, weaker links or reduced vocabulary, but the reduced vocabulary hypothesis predicts a reduction in the fulcrum point, the weaker links predicts either no difference or a delay in fulcrum point, and interference predicts a delay in the fulcrum point. Additionally, the weaker links and reduced vocabulary accounts predict that bilinguals should produce higher-frequency words on average relative to monolinguals, whereas the interference account predicts that bilinguals should produce lower-frequency words on average relative to monolinguals.
Experiment 1
In Experiment 1, we tested the different predictions of the interference (dual-task analogy), weaker links (slowing without interference) and reduced vocabulary knowledge (category size analogy) accounts of the bilingual fluency disadvantage relative to monolinguals. To this end we compared English-speaking monolinguals to English-dominant Spanish–English bilinguals on semantic and letter fluency tasks. We focused on English-dominant bilinguals because it is important to establish the mechanism of the bilingual disadvantage when bilinguals are tested in a language that allows them to be as fluent as possible.
Method
Participants
Thirty monolinguals and thirty bilinguals participated in the study for course credit. All participants completed a comprehensive language history questionnaire to assess their exposure to, and proficiency in, various languages. Monolinguals were native English speakers with no or limited (and non-native) proficiency in a second language. Although some monolinguals reported learning a second language, it was mainly via classroom instruction and none reported having been exposed at a young age or becoming fluent in that language. The majority of bilinguals reported being English-dominant, or having approximately equal proficiency in English and Spanish (twenty-four out of thirty subjects). Six bilinguals reported being Spanish-dominant and were excluded from our analyses.
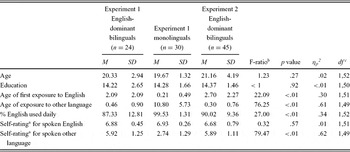
Table 1 shows the participants’ characteristics. Monolinguals and bilinguals did not significantly differ in average age or level of education. However, bilinguals reported a significantly later age at which they began to use English regularly. In addition, monolinguals reported a higher percentage of daily English use than bilinguals, and bilinguals rated their proficiency for speaking English as being significantly lower than monolinguals’ ratings. We replaced two monolinguals who reported exposure to a non-English language at birth and another because of lost data, and we replaced two bilinguals because of lost data.
Means (M) and standard deviations (SD) of participant characteristics in Experiment 1.

aProficiency level based on self-ratings using a scale of 1–7 with 1 being “little to no knowledge” and 7 being “like a native speaker”.
bThe statistics represent the comparison between English-dominant bilinguals and monolinguals from Experiment 1.
cThe degrees of freedom differ from 1,52 in cases where some participants left part of their language history questionnaire blank.
Materials
The materials are listed in Appendix A. We selected categories to include a range of difficulty in terms of both size and frequency of exemplars. We included 15 semantic categories (e.g., “types of clothing”) and 24 double-letter (e.g., “fa”) categories. Within semantic categories we achieved variability in size and frequency of exemplars by making smaller subsets of larger categories (e.g., “supermarket items”, “produce items” and “spices”). Within double-letter categories we used a previous data set (Gollan et al., Reference Gollan, Montoya and Werner2002) in which speakers retrieved members of single letter categories (e.g. “f”) to estimate category size and exemplar frequency. We divided the materials into three lists of semantic categories (with five items in each; blocked by size), and three lists of double-letter categories (with eight items each; mixed in terms of size and frequency). We used an additional two semantic and two double-letter categories as practice trials at the beginning of the testing session.
Procedure
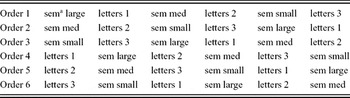
Participants were tested individually. The experimenter recorded responses both manually and by audiotape for later verification during scoring. Participants alternated back and forth between blocks of double-letter and semantic fluency trials, with semantic categories blocked by difficulty so that no single category would benefit exclusively from practice on related blocks (e.g., “supermarket items” should be easier after completing “produce”). Within each list, specific items were presented in a random order. The presentation order of blocks was counterbalanced so that no category type was always administered first or last: half of the participants completed a semantic list first, and half completed a letter list first. The type of list (letter vs. semantic) was then alternated throughout the experiment, so that upon completing all the categories within a letter group, participants would then be asked to switch to a semantic group and vice versa. Table 2 depicts the counterbalancing scheme in greater detail.
Different counterbalancing orders used in Experiment 1.

a Sem is an abbreviation for semantic.
Participants were instructed to name as many examples of things they could think of that belonged to each category without stopping, until the experimenter indicated they should do so. Each trial lasted 60 seconds. During double-letter categories, participants were asked to not use the same word with a different ending (e.g., feel and feeling). Even though it was not explicitly stated, all bilinguals correctly assumed that responses should be given in English (and not in Spanish). Before beginning the experimental trials, the experimenter guided each participant through four practice trials (i.e., two semantic and two double-letter categories). In the practice trial and throughout the experimental trials, participants were instructed to push a button on a response box at the same time as they began to say each category member. Response times were recorded through the button box using PsyScope 1.2.5. (Cohen, MacWhinney, Flatt and Provost, Reference Cohen, MacWhinney, Flatt and Provost1993). On each individual trial, the experimenter was cued by PsyScope as to which category was to be administered next, and she then told the participant the category name with the instruction “Begin”.
Results
Each correct response was given one point. During the initial scoring, a list of acceptable responses was constructed to ensure consistency across participants. In semantic categories, one point was given for exemplars belonging to a superordinate category, but this response was not credited if other subcategory exemplars were given. For example, if a subject said fruit and then apple, pear and banana, she would be credited for producing three correct responses. For each category, we calculated the fulcrum point by taking the average of the times for each correct response from the beginning of the trial (excluding first responses, as in Rohrer et al., Reference Rohrer, Wixted, Salmon and Butters1995). In addition, we obtained the mean CELEX word frequency (Baayen, Piepenbrock and Gulikers, Reference Baayen, Piepenbrock and Gulikers1995) of exemplars produced using a program called N-watch (Davis, Reference Davis2005).
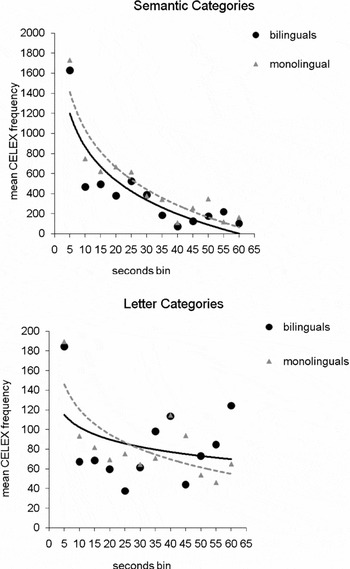
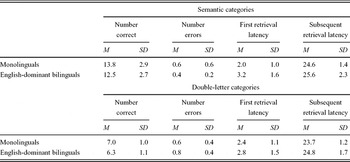
We conducted five 2 × 2 mixed model ANOVAs using participant means with participant type (bilingual vs. monolingual) as a between-subjects variable and category type (semantic versus letter) as a within-subjects variable for each of five dependent variables including: (a) number correct; (b) word frequency count of exemplars produced; (c) rate of cognates produced; (d) first response times; (e) fulcrum points (subsequent retrieval times); and (f) errors. The participant means for word frequency count in each 5-second time bin from the beginning to the end of the fluency trial are shown in Figure 2; means from all other analyses (averaging across specific categories tested) are shown in Table 3. Although tables show times in seconds, the MSE values in the results sections are reported in milliseconds.
Mean CELEX (Baayen et al., Reference Baayen, Piepenbrock and Gulikers1995) frequency of exemplars produced by English-dominant bilinguals in English and monolinguals in semantic categories (top panel) and double-letter categories (bottom panel) in Experiment 1. Lines represent the best-fitting logarithmic for each group.

Means (M) and standard deviations (SD) of response measures in Experiment 1.

Correct responses. Bilinguals produced significantly fewer correct responses than monolinguals (replicating prior work, e.g., Gollan et al. Reference Gollan, Montoya and Werner2002; Rosselli et al., Reference Rosselli, Ardilla, Arujo, Weekes, Caracciolo, Padilla and Ostrosky-Solis2000) [F(1,52) = 4.79, MSE = 5.60, η2p = .08, p = .03]. Also replicating prior work (but see Azuma, Bayles, Cruz, Tomoeda, Wood and McGeagh, Reference Azuma, Bayles, Cruz, Tomoeda, Wood and McGeagh1997), speakers produced significantly more correct responses in semantic than in the double-letter categories [F(1,52) = 331.13, MSE = 3.46, η2p = .86, p < .01]. Bilinguals were equally disadvantaged for semantic and letter categories (but see below), as suggested by the lack of a significant interaction between participant and category type (F < 1).
Word frequency of responses. In the frequency analysis, consistent with the interference account, monolinguals produced words with higher frequency counts than bilinguals [F(1,52) = 8.43, MSE = 27,829.61, η2p = .14, p = .01]. In semantic categories, bilinguals’ exemplars averaged 512.0 occurrences per million, and monolinguals 690.6 occurrences per million, and in letter categories bilinguals’ exemplars averaged 96.2 occurrences per million and monolinguals were slightly higher at 105.1 occurrences per million. The frequency differences between category types were significant, such that participants produced higher-frequency words in semantic than in double-letter categories [F(1,52) = 234.25, MSE = 28,530.05, η2p = .82, p < .01] and, consistent with previous findings of a greater bilingual effect on semantic than on letter fluency (e.g., Bialystok et al., Reference Bialystok, Craik and Luk2008b; Gollan et al., Reference Gollan, Montoya and Werner2002; Rosselli et al., Reference Rosselli, Ardilla, Arujo, Weekes, Caracciolo, Padilla and Ostrosky-Solis2000), there was also an interaction [F(1,52) = 6.73, MSE = 28,530.05, η2p = .12, p = .01], such that the frequency difference between groups was primarily produced by semantic categories. Post-hoc comparisons revealed a significant difference between bilinguals and monolinguals for semantic [F(1,52) = 7.66, MSE = 5,567.10, η2p = .13, p = .01] but not for letter categories [F(1,52) = 1.33, MSE = 792.57, η2p = .03, p = .25].
To moderate the influence of extreme values, we repeated the frequency analyses with log-frequency as the dependent variable (and excluding all exemplars with a frequency of zero). This analysis produced the same pattern of results (a significant difference between bilinguals and monolinguals for semantic but not letter categories). There was some indication of a reversal of the bilingual effect on frequency of exemplars towards the end of the letter trials (with bilinguals producing significantly lower-frequency words than monolinguals early in the trial, and higher-frequency words later in the trial; see Figure 2). An exploratory series of twelve t-tests comparing exemplar frequency count in bilinguals versus monolinguals in each 5-second bin confirmed these differences, with bilinguals producing lowe- frequency exemplars than monolinguals at 25 seconds and 45 seconds, but higher-frequency exemplars than monolinguals at 55 seconds (all ps = .03 level). However, this reversal of frequency effect (in the 55-second bin) was not significant after adjusting alpha level for multiple comparisons (Winer, Brown and Michels, Reference Winer, Brown and Michels1991), and was also not significant after conversion to log-frequency, and as such we do not interpret these results any further.
Rate of cognates produced. To consider the possible effects of cognate status on responses, we classified all responses produced as either cognates or non-cognates. Initial coding was done by the first author (TCS), checked by the second author (THG) and rating disagreements (less than 3% of responses) were settled by a third bilingual assistant who was blind to the first and second authors’ classifications. Responses with one cognate and one non-cognate translation (e.g., doctor can be translated as médico or as doctor) were coded as cognates. For each participant, we then calculated the proportion of responses in letter and semantic categories that were cognates, and considered whether bilinguals produced more cognates than monolinguals in a 2 × 2 ANOVA with category type (letter vs. semantic) and participant type (bilingual vs. monolingual) as predictors and rate of cognate production as the dependent variable.
In letter fluency, bilinguals produced cognates 38% (SD = 7%) and monolinguals 34% (SD = 5%) of the time, and in semantic fluency, bilinguals produced cognates 34% (SD = 2%) and monolinguals 32% (SD = 6%) of the time. This higher rate of cognate production in bilinguals than in monolinguals was significant [F(1,52) = 8.03, MSE = .003, η2p = .13, p = .01], and cognate production was higher in letter than in semantic fluency [F(1,52) = 10.11, MSE = .002, η2p = .16, p < .01]. Though differences between bilinguals and monolinguals in the rate of cognates produced seemed to be larger for letter than for semantic categories, this interaction was not significant [F(1,52) = 1.70, MSE = .002, η2p = .03, p = .20]. Planned contrasts revealed that bilinguals produced a significantly higher rate of cognates than monolinguals in both letter and semantic fluency (both ps < .05).
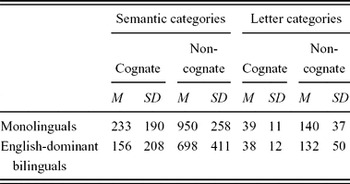
Word-frequency and cognate status. Having observed that bilinguals produce a higher proportion of cognate responses than monolinguals, we next considered whether the above-reported finding that bilinguals produce lower-frequency words than monolinguals in semantic fluency categories is still significant after including only non-cognate responses. Table 4 shows the mean CELEX frequency count of cognate and non-cognate responses. Cognate responses were significantly lower in mean frequency count than non-cognates in both letter and semantic fluency categories for both bilinguals and monolinguals (all ps < .01). Most importantly, the above-reported difference between bilinguals and monolinguals in response word frequency for semantic categories remained significant when considering only the non-cognate responses [F(1,52) = 5.10, MSE = 112.005, η2p = .09, p = .03]. Thus bilinguals’ higher rate of cognate production alone could not explain their production of significantly lower-frequency responses than those of monolinguals.
Means (M) and standard deviations (SD) of CELEX frequency count per million for cognate and non-cognate responses given by bilinguals and monolinguals in Experiment 1.

First response latencies. In the analysis of first response latencies, bilinguals were significantly slower than monolinguals to begin producing exemplars at the beginning of each trial [F(1,52) = 8.63, MSE = 2205.73, η2p = .14, p = .01], whereas first response latencies were equivalent across semantic and double-letter categories [F(1,52) < 1, MSE = 1171.12, η2p = .00, p = .947]. There was some evidence for a greater bilingualism-related slowing on semantic than on letter categories in the form of a marginally significant interaction between participant type and category type [F(1,52) = 3.47, η2p = .063, p = .07]. Planned comparisons showed that bilinguals were slower than monolinguals to begin producing exemplars in semantic [F(1,52) = 12.21, MSE = 1665.99 η2p = .19, p < .01] but not in letter [F(1,52) = 1.61, MSE = 1710.87 η2p = .03, p = .21] categories.
Fulcrum points. Most interestingly, and consistent with the notion of retrieval slowing in bilinguals (either via between-language interference or weaker links; see Table 3), bilinguals had significantly right-shifted (longer) fulcrum points than monolinguals in retrieving exemplars from semantic [F(1,52) = 9.29, MSE = 3244.39, η2p = .15, p < .01] and from letter categories [F(1,52) = 9.41, MSE = 2117.17, η2p = .15, p < .01]. In addition, the magnitude of the bilingual effect on fulcrum points was equally large on letter and semantic fluency (there was no significant interaction between participant type and category type; F < 1).
Errors. The errors analysis revealed no bilingual disadvantage, and no main effect of category type, (both Fs < 1), and a significant interaction such that bilinguals made significantly more errors in the letter categories (M = 0.85) than in semantic categories (M = 0.41), whereas monolinguals made similar numbers of errors in both categories [F(1,52) = 17.70, η2p = .25, p < .01]. This interaction was unexpected (particularly given prior evidence that letter fluency is relatively easier for bilinguals than semantic fluency; e.g., Gollan et al., Reference Gollan, Montoya and Werner2002), however, it should be noted that the number of errors committed by both groups was very low (i.e., less than one error per trial).
To consider how robust the bilingual effect on number correct and fulcrum points were for individual categories, we examined how many individual categories demonstrated an effect in the direction consistent with the group analysis. Bilinguals showed fewer correct responses in 22/24 letter categories, and in 11/15 semantic categories. Bilinguals showed slower first response latencies in 20/24 letter and 13/15 semantic categories. Finally, bilinguals demonstrated longer fulcrum points in 12/15 semantic and 21/24 letter categories.
Discussion
The results of Experiment 1 support the dual-task analogy of the bilingual fluency disadvantage. As with performance under dual-task settings (Rohrer et al., Reference Rohrer, Wixted, Salmon and Butters1995), bilinguals produced fewer correct responses, slower first response times, and right-shifted fulcrum points (see Table 3). The finding of right-shifted fulcrum points for bilinguals relative to monolinguals provides evidence against the reduced vocabulary knowledge hypothesis. If reduced vocabulary knowledge alone were responsible for the bilingual fluency disadvantage, then bilinguals should have exhibited shorter fulcrum points, because bilinguals would exhaust their vocabulary knowledge more quickly than monolinguals at the end of the fluency trial. Right-shifted fulcrum points can be explained by both interference and the weaker links account (if it is also assumed that category search and exemplar production cannot proceed in parallel).
However, other aspects of the data in Experiment 1 are not consistent with the weaker links and reduced vocabulary accounts, and are in line with the predictions of the interference account. Specifically, bilinguals produced significantly lower-frequency words on average than monolinguals (see Figure 2; note that the opposite pattern has been found in fluency deficits associated with Alzheimer's disease; patients produce higher-frequency words than matched controls; Forbes-McKay, Ellis, Shanks and Venneri, Reference Forbes-Mckay, Ellis, Shanks and Venneri2005). Importantly, although bilinguals produced cognates at a significantly higher rate than monolinguals, and cognates were significantly lower in mean frequency count than non-cognates, the bilinguals’ production of lower-frequency words on average relative to monolinguals was significant even when considering just non-cognate responses. This result supports the interference account, which predicts greater interference between languages for production of high-frequency words which are more readily accessible in both languages when compared to low-frequency words (for which bilinguals may be effectively monolingual; Gollan et al., Reference Gollan, Montoya, Cera and Sandoval2008). In contrast, the weaker links and reduced vocabulary accounts predicted that bilinguals should be disadvantaged primarily for the production of low-frequency words, and as such should have produced higher-frequency words on average relative to monolinguals. Thus, the pattern of data observed in Experiment 1 is most consistent with the notion of interference between languages as the primary mechanism of the bilingual fluency disadvantage.
To further examine the bilingual disadvantage in semantic versus letter fluency, we plotted the time-course of retrieval in each group in Figure 3, showing time (in seconds) on the x-axis and mean number correct produced by bilinguals and monolinguals by each 5-second time point on the y-axis. This figure thereby combines number correct and time-course into a single graph and allows for visual inspection of qualitative differences between groups. The most immediately apparent difference between bilinguals and monolinguals is that the bilingual disadvantage emerges early in the minute-long trial. Bilinguals produce fewer exemplars than monolinguals at the beginning of the trial, but by the end of the trial the differences diminish. More specifically, as Figure 3 shows, bilinguals produce fewer exemplars than monolinguals early in the trial (up to about 20 seconds in semantic categories, and up to about 10 seconds in letter categories). The emergence of a fluency disadvantage at the beginning of the fluency trial provides further evidence against the reduced vocabulary mechanism, which predicted that differences between groups should emerge only at the end of the trial. Additionally, assuming that speakers primarily produce high-frequency words at the beginning of the trial (Crowe, Reference Crowe1998; see also Figure 2), the presence of a bilingual disadvantage early in the fluency trial is evidence in favor of the notion that competition between languages primarily affects production of high-frequency words.
Mean number of responses per category retrieved by English-dominant bilinguals in English and monolinguals in semantic categories (top panel) and double-letter categories (bottom panel) in Experiment 1. Lines represent the best-fitting exponentials for each group.

Although we obtained significant clear evidence in favor of the dual-task analogy for explaining the bilingual fluency disadvantage, these differences were relatively small when compared with the effects of dual tasking (Rohrer et al., Reference Rohrer, Wixted, Salmon and Butters1995). The exponentially fitted lines for bilinguals display a clear bilingual disadvantage (in Figure 3), but the disadvantage is much smaller than that observed comparing monolinguals in dual-task versus single-task conditions (in Rohrer et al., Reference Rohrer, Wixted, Salmon and Butters1995). In Experiment 2, we sought corroborating evidence for the hypothesis that between-language interference influences bilingual fluency performance by comparing the time-course of retrieval, and the rate of cross-language intrusion errors, in the dominant versus the non-dominant language.
Experiment 2
Our interpretation of the bilingual disadvantage in Experiment 1 as reflecting interference between languages relies on the notion that the non-dominant language can compete for selection with the dominant language (because English-dominant bilinguals were tested exclusively in English in Experiment 1). However, a number of studies suggest that the dominant language is relatively immune to interference from, or transfer to, the non-dominant language, and that the pattern of observed bilingual disadvantages for dominant language production cannot be explained with an interference mechanism. As noted above, in some cases bilinguals show evidence of non-dominant language activation only immediately after being tested in a non-dominant-language-only block (Jared and Kroll, Reference Jared and Kroll2001). Similarly, masked priming between languages is obtained only when primes are in the dominant language, whereas non-dominant language primes seem to have no effects, or more limited effects, on lexical decision times in the dominant language (Gollan, Forster, and Frost, Reference Gollan, Forster and Frost1997, Jiang and Forster, Reference Jiang and Forster2001; but see Duyck, Reference Duyck2005; for review, see Finkbeiner, Forster, Nicol and Nakamura, Reference Finkbeiner, Forster, Nicol and Nakamura2004). Finally, explicit (e.g., Costa and Caramazza, Reference Costa and Caramazza1999) and implicit (e.g., Gollan and Acenas, Reference Gollan and Acenas2004; Gollan, Montoya et al., Reference Gollan, Bonanni and Montoya2005) activation of translation equivalents seems to facilitate, not interfere with, target language selection in picture naming.
In contrast, there is considerably greater consensus among researchers of bilingualism that the dominant language interferes with production in the non-dominant language (for exceptions, see Costa, Reference Costa, Kroll and de Groot2005; La Heij, Reference La Heij, Kroll and de Groot2005), and all models that accept the notion of interference between languages propose an asymmetry such that interference is greater in non-dominant language production than it is for the dominant language (Green, Reference Green1998; for reviews, see Kroll et al., Reference Kroll, Bobb and Wodniecka2006, Reference Kroll, Bobb, Misra and Guo2008). The strongest evidence in support of this asymmetry comes from the observation of counter-intuitive asymmetry in language switching costs (e.g., Meuter and Allport, Reference Meuter and Allport1999), such that switching costs are greater for the dominant language than for the non-dominant language (even though responses in the dominant language are generally faster). A ready explanation for the asymmetry is the notion that the dominant language must be strongly inhibited to allow non-dominant language production, and undoing this inhibition (to switch back into the dominant language) is costly. In contrast, the dominant language is relatively immune to interference from the non-dominant language and so there is no (or very little) need to inhibit the non-dominant language to produce the dominant one.
If the bilingual fluency disadvantage should be attributed to between-language interference, and if such interference is particularly strong for non-dominant language production, then the predictions outlined above (in Experiment 1) for the bilingual to monolingual contrast should apply when comparing non-dominant to dominant language production within bilinguals. That is, when attempting to produce exemplars in their non-dominant language, bilinguals should unintentionally retrieve and then need to reject non-target language words relatively more often than they did during dominant language fluency, thereby increasing the extent to which the dual task is performed.
Note that the comparison of the dominant to the non-dominant language simultaneously provides a stronger opportunity for examining the possible roles of weaker links (slowing without interference) and vocabulary size on fluency performance because both differences should be relatively greater in the language dominance contrast than in the contrast between bilinguals and monolinguals. We anticipated, for example, that language dominance effects on number correct in Experiment 2 (i.e., the difference in number correct between English and Spanish) would be larger than the subtle bilingual effect on number correct we obtained in Experiment 1 (see Table 3). This expectation was based on prior work, in which we observed the bilingual disadvantage relative to monolinguals to be considerably smaller than the effect of language dominance in picture-naming times and error rates (Gollan et al., Reference Gollan, Montoya, Cera and Sandoval2008) within bilinguals. In anecdotal observations as well, the disadvantage of English-dominant bilinguals relative to monolinguals in natural production of English is barely, if at all, detectable. In contrast, English-dominant bilinguals are obviously less fluent in at least some contexts when they speak in Spanish than in English.
Additionally, because bilinguals likely have smaller vocabularies in their non-dominant than in their dominant language, when retrieving category members in the non-dominant language bilinguals should exhaust their pool of accessible words relatively early in the minute-long trial. As such, language dominance effects on retrieval time-course should resemble category size effects (Rohrer et al., Reference Rohrer, Wixted, Salmon and Butters1995). On this view, we would predict leftward-shifted (shorter) fulcrum points in Spanish compared to English (analogous to retrieval from smaller categories in monolinguals). To illustrate, in Experiment 1 bilinguals continued to retrieve exemplars well into the minute-long fluency trial, thereby providing relatively more long response times and slowing their overall mean response time. In contrast, when asked to retrieve exemplars from the non-dominant language, bilinguals may retrieve relatively high-frequency exemplars early on, but then as the trial progresses may not know (or may be unable to retrieve) the Spanish names for relatively lower-frequency exemplars (see Gollan et al. (Reference Gollan, Montoya, Cera and Sandoval2008) for evidence that language dominance effects are especially robust for the production of low-frequency names), leading to shorter fulcrum points in the non-dominant language. Thus, if language non-dominance instead leads to right-shifted fulcrum points, this would constitute especially strong evidence for the notion that between-language interference influences fluency performance in bilinguals relatively more than any other mechanism.
To test these proposals, in Experiment 2 we examined the time-course of retrieval during verbal fluency in the dominant versus in the non-dominant language. We hypothesized that bilinguals would produce fewer correct responses, slower first response times, and right-shifted (longer) fulcrum points in their non-dominant language (in this case, Spanish) than in their dominant language (English). A confirmation of these predictions, particularly longer fulcrum points in the non-dominant than in the dominant language, would provide additional support for the hypothesis that between-language interference influences fluency performance in bilinguals.
Methods
Participants
Fifty-one Spanish–English bilinguals participated in the study for course credit. Participants completed the same language history questionnaire used in Experiment 1. As in Experiment 1, the majority of bilinguals reported being English dominant, or having approximately equal proficiency in English and Spanish (forty-five out of fifty-one subjects). Six bilinguals reported being Spanish dominant and so were eliminated from the analyses. Table 1 shows the participants’ characteristics.
Materials
We selected twelve semantic categories (e.g., “kitchen appliances”) for Experiment 2. The materials are listed in Appendix B. As part of a separate investigation, participants also retrieved members of six proper name categories (e.g., “UCSD Professors’ names”), but we do not discuss these here because proper names are generally the same across languages, leaving it unclear what predictions should be made for them regarding language dominance effects.
Procedure
Bilinguals were tested individually and responses were recorded both manually by the experimenter and on audiotape for later verification during scoring. Instructions were to name as many members of each category as they could in the target language (English or Spanish) until the experimenter told them to stop. Each trial lasted 60 seconds. For Spanish testing blocks, bilinguals were given instructions in Spanish by a native Spanish–English bilingual experimenter. In English testing blocks, instructions were given in English. Bilinguals tested in English first were not specifically instructed to do the task in English, but all participants assumed that they should. Before the experiment began, participants were guided through a practice trial, similar to Experiment 1, where they learned to press a button on a PsyScope response box at the same time as they said their answers to measure retrieval times. All bilinguals completed half of the categories of each type in each language, with language order (i.e., Spanish first or English first) counterbalanced between participants. Within each language block, each bilingual completed categories in a different random order.
Results
One point was given for each correct response. Correct responses given in the wrong target language were counted as errors, which we coded separately for the errors analysis. During scoring, a list of acceptable responses was constructed to ensure consistency in coding across bilinguals. For each trial, we calculated fulcrum points as in Experiment 1.
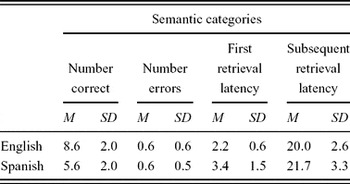
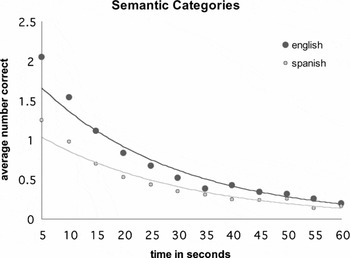
We conducted four one-way ANOVAs using participant means with language (English vs. Spanish) as a within-subjects variable for the following dependent variables: (a) number correct; (b) first response times; (c) fulcrum points (subsequent retrieval times); (d) rate of cognates produced; and (e) within-language errors. The means for these analyses (averaging across specific categories tested) are shown in Table 5, and the time-course of retrieval in terms of number correct in each 5-second bin is shown in Figure 4. Because comparisons across different frequency corpora are not valid, we do not compare word frequency of responses produced in English and Spanish;Footnote 2 however, we consider the rate of between-language errors separately as an additional form of evidence that can distinguish between interference and weaker links in Experiment 2.
Means (M) and standard deviations (SD) of response measures in Experiment 2.

Mean number of responses per category retrieved by bilinguals in Spanish (the non-dominant language) versus in English (the dominant language) in Experiment 2. Lines represent the best-fitting exponentials for each group.

Correct responses, first-response latencies and fulcrum points. Consistent with their reported English dominance, bilinguals produced significantly fewer correct responses in Spanish than in English [F(1,44) = 70.93, MSE = 3.00, η2p = .62, p < .01], and bilinguals were significantly slower to begin producing exemplars in Spanish compared to English [F(1,44) = 33.72, MSE = 930,166.99, η2p = .43, p < .01]. Most interestingly, bilinguals’ fulcrum points were significantly longer in Spanish than in English [F(1,44) = 12.36, MSE = 5,130,866.99, η2p = .22, p < .01]. Thus the analyses of fulcrum points confirmed the proposal that between-language interference is greater during production of the non-dominant than of the dominant language, suggesting that for English-dominant bilinguals, production in Spanish presents more of a dual-task situation than production in English.
Rate of cognates produced. Bilinguals produced cognates at about the same rate (p = .28) in Spanish (M = 36%; SD = 8%) and English (M = 34%; SD = 6%). The lack of a difference between languages in the two languages may simply reflect an upper limit on the amount of cognates available for response.
Errors. A compelling aspect of the error data was that twenty of forty-five bilinguals tested in Experiment 2 accidentally produced at least one English word during Spanish fluency trials. In contrast, during English fluency trials only one bilingual accidentally produced a Spanish word. This asymmetrical pattern of between-language intrusion errors is consistent with the notion that between-language interference is particularly large when bilinguals do the fluency task in their non-dominant language. Aside from this exception, error rates were otherwise relatively low overall, and there were no effects of language dominance; bilinguals produced the same number of errors in English and Spanish (F < 1).
Order effects. Our procedure of counterbalancing the order of language testing provides an opportunity to examine the influence of testing order on dual-language activation. Of particular interest was to determine if activating the non-dominant language on a prior testing block increased the extent to which it could interfere with dominant language production on a subsequent testing block. If the dominant language must be suppressed to allow production in the non-dominant language, and if undoing such inhibition requires some time, then bilinguals may produce fewer exemplars in the dominant language after first being tested in the non-dominant language, and may also exhibit greater evidence of cross-language interference (in the form of longer fulcrum points in English on the second than on the first testing block).
The evidence to support this proposal was limited. In the analysis of number correct, there was a numerical difference in the right direction (bilinguals produced just under 1 fewer correct responses when tested in Spanish first), but this difference was not significant (p = .18). Similarly, in the errors analysis, bilinguals who were tested in English first made more than twice as many cross-language intrusions during subsequent testing in Spanish (M = 1.1; SD = 1.2) as bilinguals tested in Spanish first (M = 0.4; SD = 0.8); however, this difference was only marginally significant (p = .09; note that we could not test for testing-block effects on intrusion rate in English fluency because only one bilingual produced one cross-language intrusion in English fluency). All other pair-wise comparisons of English first to English second, and Spanish first to Spanish second in number correct, first response latencies and fulcrum points were not significant (all ps ≥ .25).
Discussion
In Experiment 2 we observed clear language dominance effects on all response measures. Bilinguals produced fewer responses in Spanish than in English, and were slower to begin naming exemplars in Spanish than in English. Most interestingly, fulcrum points were longer in Spanish than in English, supporting the notion of greater between-language interference for production of the non-dominant Spanish than during production of dominant English. To evaluate how robust these language dominance effects were we examined how many individual categories displayed language dominance effects. Language dominance effects are quite consistent across different categories. Bilinguals produced fewer correct Spanish responses in all categories, and demonstrated longer fulcrum points in Spanish than in English in 10 of 12 categories. Finally, although we observed no significant order effects on any response measures, there was compelling evidence for between-language interference in the form of cross-language intrusion errors, which occurred primarily during non-dominant language (Spanish) fluency trials and, though rarely, were also observed when speakers completed the task in their dominant language (English).
General discussion
This study tested three possible mechanisms of how bilingualism affects verbal fluency: (a) interference between languages; (b) reduced language-specific language use (weaker links); and (c) reduced vocabulary knowledge. All three mechanisms could explain why bilinguals produce fewer correct responses than monolinguals (Experiment 1), and fewer correct responses in the non-dominant language (Experiment 2), but additional measures allow us to distinguish between these possible mechanisms to identify which is primarily responsible for introducing the bilingual fluency disadvantage. Three key types of evidence suggest between-language interference has a powerful effect on verbal fluency: (a) retrieval time-course (in both Experiments 1 and 2); (b) word frequency counts of responses given by bilinguals versus monolinguals in Experiment 1; and (c) the rate of between-language intrusion errors in Experiment 2.
Evidence supporting the interference account and the dual-task analogy
Several findings we obtained support the interference account via an analogy with dual-task effects on monolingual fluency performance (Rohrer et al., Reference Rohrer, Wixted, Salmon and Butters1995). First, bilinguals had proportionally delayed responses (rightward-shifted fulcrum points) relative to monolinguals (see Table 3), and these differences were consistent across a variety of category types. In addition, bilinguals had slower first response times (as seen in dual- versus single-task testing conditions), and the bilingual disadvantage emerged early in the fluency trial (see Figure 3). Given their greater accessibility in both languages, high-frequency words – which are produced to a greater extent in the beginning of the fluency trial (see Figure 2) – should create the most interference between languages (Gollan et al., Reference Gollan, Montoya, Cera and Sandoval2008). In contrast, if the bilingual disadvantage were caused by reduced vocabulary knowledge relative to monolinguals, then bilinguals should have exhibited shorter fulcrum points, and the disadvantage should have emerged towards the end of the fluency trial when production of low-frequency words increases.
Other data supporting the notion that interference from the non-target language influences bilingual verbal fluency performance came from a comparison of dominant vs. non-dominant language fluency in Experiment 2. Despite having a much-reduced vocabulary in Spanish than in English, fulcrum points were longer in Spanish than in English (see Table 5), and this result was consistent across several different categories. Here, as with the bilingual effect in Experiment 1, the difference between dominant and non-dominant languages seemed to emerge at the beginning of the trial (see Figure 4). The lengthening of fulcrum points in Spanish versus English, despite the robust differences in vocabulary size between languages, implies that interference between languages influences verbal fluency performance to a greater extent than differences in vocabulary size. Finally, and perhaps most compelling, nearly half (20/44) of the bilinguals tested in both languages mistakenly produced an English word in the middle of a Spanish fluency trial (on at least one occasion). Cross-language intrusion errors arguably provide the clearest possible evidence for interference between languages.
Lastly, we consider whether the lengthening of the fulcrum point could be attributed to bilinguals’ division of language use across two different languages (i.e., weaker links) without appealing to explicit interference between languages. It might be possible for the weaker links account to explain the small (1.5 seconds) right-ward shift in fulcrum points in bilinguals relative to monolinguals if retrieval slowing is cumulative across each response produced (if semantic search and production of responses cannot be carried out in parallel; see “Introduction”). However, additional evidence provided support for the interference account, and produced results that are difficult to explain from the perspective of the weaker links account. Specifically, bilinguals produced significantly lower-frequency words than monolinguals in Experiment 1. This result contrasts notably with previous data which showed a greater bilingual disadvantage for production of low-frequency than of high-frequency words in a picture-naming task (Gollan et al., Reference Gollan, Montoya, Cera and Sandoval2008; Ivanova and Costa, Reference Ivanova and Costa2008), and implies a stronger role for interference between languages in verbal fluency than in picture naming.
Finally, the higher rate of production of cognate words in bilinguals than in monolinguals is also consistent with the notion that dual-language activation affects response selection in bilinguals completing the fluency task. Although bilinguals in Experiment 1 were English-dominant, immersed in an English-dominant environment, and were tested exclusively in English, their knowledge of Spanish nevertheless influenced the responses they chose to produce. Cognate effects could either reflect the online convergence of activation on shared phonological representations between languages during fluency generation itself (Costa et al., Reference Costa, Caramazza and Sebastián-Gallés2000; Gollan and Acenas, Reference Gollan and Acenas2004), or a joint-language frequency updating mechanism for cognates in bilingual language use (or both; see also “Discussion” in Experiment 1). In either case, dual-language activation at some processing stage must be assumed, and even though cognates themselves facilitate lexical access in bilinguals, the dual-language activation assumption seems quite consistent with the notion of interference. Figure 5 shows how the bilingual fluency disadvantage is driven entirely by monolinguals’ higher production of non-cognates (and no difference between groups for production of cognates).
Mean number of non-cognates and cognates produced per category by English-dominant bilinguals and monolinguals in letter-fluency and semantic-fluency trails in Experiment 1. Error bars show standard errors.

Challenges for the interference account and the dual-task analogy
Although our findings largely confirm the predictions of the interference account, some aspects of the data do present the interference notion with challenges. As compelling as the presence of cross-language intrusions were for supporting the notion of interference during production of the non-dominant language, the almost complete lack of such errors in dominant language production in both Experiments 1 and 2 is puzzling from the perspective of the interference account (not one bilingual in Experiment 1, and only one bilingual in Experiment 2, produced a Spanish intrusion during an English fluency trial). The absence of Spanish intrusions into English fluency trials in Experiment 2 is particularly compelling, given that half of the bilinguals completed a block of Spanish fluency trials prior to the English fluency trials. In a similar vein, order effects were not robust in Experiment 2. The absence of order effects is consistent with the observation of short-lived language switching effects (Meuter and Allport, Reference Meuter and Allport1999), and implies that bilinguals can rapidly shift back into the dominant language (for a different result in bilingual word recognition, see Jared and Kroll, Reference Jared and Kroll2001).
Importantly, cross-language intrusions, even if infrequent, imply dual-language activation. Thus, the presence of at least some intrusions of words from the non-dominant language into dominant language fluency seem to call for an interference-based account, and the presence of a monitoring process that prevents production of words in the non-target language. The rarity of intrusions into the dominant language (see also Poulisse, Reference Poulisse, de Groot and Kroll1997; Poulisse and Bongaerts, Reference Poulisse and Bongaerts1994) may suggest that the monitoring process is frequency sensitive, such that lower-frequency concept names are blocked more easily than high-frequency names (here we assume words in the non-dominant language tend to be lower in frequency than words in the dominant language, as implied in Dijkstra and Van Heuven, Reference Dijkstra and Van Heuven2002; see discussion in Duyck, Vanderelst, Desmet and Hartsuiker, Reference Duyck, Vanderelst, Desmet and Hartsuiker2008; Gollan et al., Reference Gollan, Montoya, Cera and Sandoval2008). The possible sensitivity of a response monitor to frequency leads to a more general prediction that within-language intrusion errors (and perhaps also perseveration errors) may be more likely to occur with relatively high-frequency names (e.g., in generating responses to the category “fruit”, a speaker might be more likely to intrude a high-frequency fruit such as apple than a low-frequency fruit such as pomegranate). Within-language intrusions were rare in the current study. However, the analyses presented here suggest that qualitative analysis of fluency responses and errors (e.g., word-frequency count) may provide further insights into the mechanisms of fluent language production.
Another challenge to the interference account is that, although it was significant, the difference in fulcrum point between monolinguals and bilinguals (in Experiment 1) was only about 4% for semantic categories and 5% for letter categories (see Table 3). Similarly, the differences in fulcrum points between dominant and non-dominant language production was only 9% (see Table 5). In notable contrast, the difference in fulcrum point between single- and dual-task settings was 83% (Rohrer et al., Reference Rohrer, Wixted, Salmon and Butters1995, Experiment 2), a substantially larger difference. An important consideration here is that, at least in some sense, it simply must be the case that the degree of between-language interference is restricted. If knowledge of two languages were fully analogous to constant dual-tasking then bilinguals should be (but are clearly not) obviously impaired in speaking-related tasks, and people would make an effort to avoid becoming bilingual whenever possible. Furthermore, it is important to consider that, to the extent that multiple mechanisms may concurrently affect verbal fluency (i.e., between-language interference which shifts fulcrum points to the right, and bilinguals’ reduced vocabulary knowledge, which shifts fulcrum points to the left), this would reduce our ability to observe the effects of interference on bilingual fluency performance.
A final and more subtle challenge for the interference account was our observation of an equally sized bilingual disadvantage in the number of correct responses in semantic and double-letter fluency. In prior work, bilinguals were more disadvantaged for semantic than letter fluency and this interaction was taken to support the interference notion (Gollan et al., Reference Gollan, Montoya and Werner2002; Rosselli et al., Reference Rosselli, Ardilla, Arujo, Weekes, Caracciolo, Padilla and Ostrosky-Solis2000). Interference between languages is arguably more likely to arise in semantic than in letter fluency because translation equivalents are category members only in semantic, and not in letter, fluency. For example, when producing dog during an “animals” fluency trial, the next word that comes to mind might be the translation for dog (perro), which also fits the category but can't be produced during an English fluency trial. In contrast, during a “d-words” fluency trial, if the translation for dog becomes active it will be relatively easy to suppress because the Spanish word for dog does not begin with the target letter d. Similarly, Rosselli et al. (Reference Rosselli, Ardilla, Arujo, Weekes, Caracciolo, Padilla and Ostrosky-Solis2000) suggested that automatic translation may be more likely during semantic than letter fluency because semantic category members tend to be more concrete (and concrete words are easier to translate than abstract words; Tokowicz, Kroll, de Groot and Van Hell, Reference Tokowicz, Kroll, de Groot and Van Hell2002).
Although we failed to observe an interaction between semantic and letter fluency in number correct (possibly because we used double-letter categories), other aspects of our data are more consistent with prior findings. Most obviously, our analysis of exemplar frequency showed that bilinguals produced responses with significantly lower frequency counts than monolinguals, but this difference was significant only in the semantic fluency task and not in letter fluency (i.e., the interaction between participant and category type was significant; see Figure 2). Similarly, our analysis of first-response latencies produced a trend in the same direction and in Figure 3, which depicts retrieval time course and number correct simultaneously, the bilingual disadvantage appears to be larger in retrieval from semantic (top panel) than double-letter categories (bottom panel).
The mechanism of interference between languages may operate simultaneously with other bilingual advantages that affect letter fluency more than semantic fluency, thus offsetting part of the bilingual disadvantage (Bialystok, Craik and Luk, Reference Bialystok, Craik and Luk2008a; see also Gollan et al., Reference Gollan, Montoya and Werner2002). Importantly, there are many possible differences between semantic and letter fluency and within-category type performance can also vary. For example, in monolingual verbal fluency, semantic categories are usually (Goulet, Pouliet and Joanette, Reference Goulet, Pouliet and Joanette1989; Gurd and Ward, Reference Gurd and Ward1989; Lezak, Reference Lezak1983; Martin, Wiggs, Lalonde and Mack; Reference Martin, Wiggs, Lalonde and Mack1994; Pasquier, Lebert, Grymonprez and Petit, Reference Pasquier, Lebert, Grymonprez and Petit1995; Nelson and McEnvoy, Reference Nelson and McEvoy1979), but not always, more difficult than letter categories (Azuma et al., Reference Azuma, Bayles, Cruz, Tomoeda, Wood and McGeagh1997). As such, there is reason to proceed with caution when interpreting interactions between participant and category type (whether as evidence for, or against, the notion of interference during bilingual fluency performance).
This discussion highlights an important consideration for understanding how bilingualism affects performance in a variety of cognitive tasks. It may seem difficult to understand why bilingual advantages arise in some tasks that require executive control (e.g., Stroop; Bialystok et al., Reference Bialystok, Craik and Luk2008a; ANT; Costa et al., Reference Costa, Hernandez and Sebastián-Gallés2008), with disadvantages in the verbal fluency task, which also requires executive control. If bilinguals are better at managing response conflict than monolinguals, then why doesn't this improved executive control also allow bilinguals to overcome between-language interference in the fluency task? Clearly, multiple cognitive mechanisms influence performance in the verbal fluency task (and in many of the other tasks that exhibit bilingual effects). Hence it appears that the advantage bilingualism confers onto executive control is relatively small compared with the disadvantage it can produce in lexical access. Additionally, executive control may be relatively less important in the verbal fluency task than lexical accessibility.
Conclusions
The results of the current study imply the presence of subtle but significant effects of dual-language activation on language production. Even when speaking in their dominant language, bilinguals are not able to “shut off” activation of the non-dominant language and function like monolingual speakers. A practical implication that follows from this interpretation of our results is that ultimately, bilinguals will be most fluent when they are tested under conditions that minimize dual-language activation. In picture naming tests, bilinguals’ naming scores sometimes improve when they are given the option to use either language (Kohnert, Hernandez and Bates, Reference Kohnert, Hernandez and Bates1998; Gollan and Silverberg, Reference Gollan and Silverberg2001). However, in verbal fluency, bilinguals are still disadvantaged relative to monolinguals, and fluency scores do not improve when bilinguals are given the option of using either language (Gollan et al., Reference Gollan, Montoya and Werner2002). Although the option to use either language clearly confers some benefits, it seems that lexical accessibility alone cannot drive language selection. Thus, although the option of using either-language frees bilinguals from having to restrict production to one language, it also burdens them with having to choose which language to use for each given utterance (for detailed discussion, see Gollan and Ferreira, Reference Gollan and Ferreira2009). Our interpretation of the current results further suggests that language switching in the context of the verbal fluency task may even lead bilinguals to have lower fluency scores in some cases. Consistent with this hypothesis, healthy older bilinguals do (but bilinguals with Alzheimer's disease do not) switch languages voluntarily during the verbal fluency task (de Picciotto and Friedland, Reference de Picciotto and Friedland2001).
The emergence of what appear to be significant interference effects in dominant language production in the context of the verbal fluency task contrasts with previous findings that appeared to run in the opposite direction of what the interference account predicts. For example, in picture-naming tasks, the bilingual disadvantage was greater for low-frequency than for high-frequency words (Gollan et al., Reference Gollan, Montoya, Cera and Sandoval2008), and in another study bilinguals experienced more TOTs than monolinguals even for words they tended to know in just one language (making competition between languages impossible; Gollan and Acenas, Reference Gollan and Acenas2004; see also Gollan, Montoya et al., Reference Gollan, Bonanni and Montoya2005). One way to understand the difference in conclusions drawn across studies is to assume (as outlined in the “Introduction”) that the verbal fluency task is particularly sensitive to the possible effects of interference between languages, as well as competition for selection within languages (for both bilinguals and monolinguals), because verbal fluency is a relatively unconstrained production task. On this view, the fluency task reveals, and possibly even enhances, competitive effects within the production system because speakers are given a single, and arguably quite impoverished, cue for the purpose of retrieving several words in a relatively long time-frame.
The implications of our results for understanding bilingual language processing are that multiple mechanisms are necessary to explain how bilingualism affects language production. Specifically, interference between languages, differences in vocabulary knowledge and differences in frequency of use relative to monolinguals may conjointly affect language production, and different tasks will reveal different mechanisms of bilingual effects in operation. More broadly speaking, our results imply a significant, and perhaps sometimes underestimated, role for selection by competition in language production. A number of recent findings have challenged the notion of language production as a basically competitive process (for review, see Finkbeiner, Gollan and Caramazza, Reference Finkbeiner, Gollan and Caramazza2006). Within the monolingual literature, for example, co-activation of “has-a” forms (e.g., car–bumper) facilitate production (in contrast to coordinate forms which inhibit production; e.g., car–truck; Costa, Alario and Caramazza, Reference Costa, Alario and Caramazza2005). Similarly, within the bilingual literature, co-activation of translation equivalents facilitated production (Costa and Caramazza, Reference Costa and Caramazza1999). Despite such experimental results, it may be premature to abandon the idea of selection by competition (cf. Finkbeiner et al., Reference Finkbeiner, Almeida, Janssen and Caramazza2006). Indeed the presence of bilingual advantages in non-linguistic tasks that require resolution of response conflict (e.g., Bialystok et al., 2005), and the similarities between dual-task effects (Rohrer et al., Reference Rohrer, Wixted, Salmon and Butters1995) and the bilingual effects we observed in the current study, imply a significant role for general mechanisms of cognitive control in language production for all speakers (bilingual and monolingual).