I. INTRODUCTION
Nickel (Ni) is relatively pricey on the market, which breaching the backbone of austenitic producer and end users, therefore, the market is looking an alternative option. Reference Oshima, Habara and Kuroda1 Ferritic and dual-phase (austeno-ferritic) or popularly known as duplex stainless steel (DSS) may fill the gap of this expensive alloying element. Ferritic stainless steels (FSSs) are an economically low-cost alternative of austenitic stainless steels (ASSs) and exhibit greater resistance to stress corrosion cracking (SCC) and pitting corrosion, Reference Mallaiah, Kumar, Reddy and Reddy2 it is also distinguished by higher thermal conductivity and smaller linear expansion. Reference Mallaiah, Kumar, Reddy and Reddy2 Whereas DSSs illustrate higher resistance to SCC and pitting corrosion, also shows higher strength than that of ASSs due to dual-phase (austenite and ferrite) nature and higher pitting resistance equivalent number (PREN). Reference Verma and Taiwade3,Reference Gadelrab, Li, Chiesa and Souier4
Both FSS and DSS are preferably applied in certain environments such as chemical tankers, ocean engineering, pressure vessels, and heat exchanger pipes. Reference Kaçar and Acarer5,Reference Sathiya, Aravindan and Haq6 In addition to these, FSS (especially 430 and 439 grades) and DSS (2205 grade) greatly used together in heat recovery steam generator (HRSG) units to avoid dew-point corrosion. Reference Krafft7 This may also be one of the choices, where Ni-free stainless steels are required, one such application is a TiCl4 reduction retort with Mg, where Mg has the propensity to leach away Ni from the ASS and degrading the mechanical properties. Reference Ramkumar, Chandrasekhar, Singh, Ahuja and Arivazhagan8 Since multiphase steels are in great demand and used in industries; researchers have also focused on the relation between strength, ductility, cold workability, and welding behavior of dissimilar metals for the cost flexibility. Reference Moine, Mary, Normand, Peguet, Gaugain and Evin9
The development of new steels may create new problems in manufacturing and joining, hence there is a continuous demand in welding for increased productivity. However, joint integrity is a very important consideration for the safe service life of the components. Therefore, the careful selection of welding parameters and fillers are very important to balance the phase ratio and prevent weld metal (WM) liquation cracking, heat affected zone (HAZ) cracking, and other welding defects. Reference Ramkumar, Chandrasekhar, Singh, Ahuja and Arivazhagan8,Reference Rahmani, Eghlimi and Shamanian10
Shielded metal arc welding (SMAW) is a popularly used joining process in most of the industrial domains due to economic flexibility and portability. Reference Verma and Taiwade3 Although, in wrought condition, FSSs show useful properties, but, welding reduces its ductility and corrosion resistance due to single phase, resulted in more grain coarsening and formation of hard martensite phase, for this reason, the application of FSSs is limited. Reference Lakshminarayanan, Shanmugam and Balasubramanian11 From the open sources, it is known that the excessive grain coarsening can be avoided by using low welding heat input. Dissimilar joints are also prone to galvanic corrosion due to different electro-potential of the materials. Reference Singh12
The joining of dissimilar metals is usually more complex and challenging because of difference in thermal, physical, and chemical properties, which affects dilution of the materials and further weld microstructure. Reference Verma, Taiwade, Khatirkar, Sapate and Gaikwad13 Dilution is the quantity of the base metals (BMs) that melts and participates in the constitution of the WM. Reference Verma, Taiwade, Khatirkar, Sapate and Gaikwad13 The prediction of microstructure for dissimilar metal weld is mainly done by few constitution diagrams such as WRC-1992, Schaeffler and Delong. Reference Verma and Taiwade14 But, for FSSs, the WRC-92 and Delong diagrams do not provide the range of chromium equivalent (Creq) and nickel equivalent (Nieq) which mainly depend on the chemical composition of the metals.
Generally, Espy a modification of Schaeffler diagram is useful for FSSs and its dissimilar welds. It also accounts the N containing alloys such as DSSs. Reference Verma, Taiwade, Khatirkar, Sapate and Gaikwad13
However, many researchers had carried out the dissimilar joining of FSSs and DSSs with other popular alloys. Sara Aguilar et al. Reference Aguilar, Tabares and Serna15 carried out the SMAW process of AISI 316L ASS with AISI 430 FSS by using two different electrodes namely austenitic AWS E309L and AWS E2209 DSS with a single pass welding by employing a low heat input (700–1000 J/mm range). Authors concluded that the size of the HAZ and the average size of the ferrite grain in the zone of coarse grain, completely depends on the heat input and also stated that the morphological features and the amount of delta (δ) ferrite are a function of the chemical composition of the filler metal. Ramkumar et al. Reference Ramkumar, Kumar, Radhakrishna, Kothari, Sridhar, Arivazhagan and Kuppan16 studied the laser welded Inconel 625 with duplex SAF 2205 and reported successful joint with the comprised microstructure of cellular, dendritic, and equiaxed grains. Verma et al. Reference Verma, Taiwade, Khatirkar and Kumar17 studied the dissimilar joint between 2205 DSS and 316L ASS by employing SMAW process using E309L and E2209 electrodes and concluded that the duplex E2209 electrode showed the better structure–property co-relationship than that of E309L with the dissimilar combination of 2205 DSS and 316L ASS.
However, the influence of welding variables such as heat input, selection of electrodes and their effects on microstructure, mechanical properties, and corrosion resistance, especially, galvanic corrosion of fusion welded FSS and DSS dissimilar metals have hardly been studied. Also, very few electron backscatter diffraction (EBSD) studies are carried out of the solidified structure of welded region and HAZ of DSS and/or FSS. This is the motivation for the present study. This leads to demand for techniques to weld these dissimilar metals and their use in large scale production in many industrial domains.
Researchers recommended either to use faster cooling rate (low heat input) or to use Mo-rich fillers to minimize the effect of Mo-segregation which is also the major problem in FSS. Based on the facts an attempt has been made by selecting Mo-based austenitic electrode (E309LMo) and Mo–N based duplex (E2209) electrode by employing low heat input for dissimilar metal welding of dual-phase DSS 2205 and AISI 430 FSS.
II. EXPERIMENTAL PROCEDURE
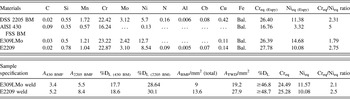
Dual-phase DSS 2205 and AISI 430 FSS base metals and two different electrodes E2209 and E309LMo were used to study. Base metals and electrodes composition are given in Table I. The samples with dimension of 150 (length) × 90 (width) × 3 (thickness) [mm] were cut by wire-cut electrical discharge machine (EDM) followed by solution annealing at a temperature of 1050 °C at 1 h for DSS 2205 BM and 850 °C at 1 h for AISI 430 FSS BM.
Chemical composition of the base materials, different electrodes and weld metal dilution calculation with Creq/Nieq ratio.

Square butt welding (1.2 mm gap, with DCEN polarity) was performed by considering parameters such as current; 120 A, voltage; 25–35 V and welding speed; 4.8 mm/s, heat input was calculated; 515.6 J/mm, assuming 75% efficiency. Reference Verma, Taiwade, Khatirkar and Kumar17 Metallographic samples were prepared (in transverse section of welded region) as per ASTM E3-95, 18 by finishing with 1200 grit emery papers followed by final polishing with diamond (0.25 μm) paste. The samples were micro-etched by Marble’s reagent Reference Verma, Taiwade, Khatirkar and Kumar17 for the reaction time 10 s. Phase identification of solution annealed BM was carried out by X-ray diffraction (XRD) technique. Microstructures of different zones (WM and HAZ) were observed using an optical microscope (Zeiss Axio Lab A1, Carl Zeiss GmbH, Göttingen, Germany) and scanning electron microscope (JEOL 6380A, JEOL Ltd., Tokyo, Japan).
The EBSD measurement was carried out in a JEOL JSM-7100F model field emission gun scanning electron microscope (FEG-SEM; JEOL USA Inc., Peabody, Massachusetts) with Oxford EBSD detector (Oxford Instruments, Abingdon, United Kingdom) and Aztec software (Aztec Software Associates, Springfield Township, New Jersey). Samples were polished first on emery papers followed by alumina polishing, after that Buehler VibroMet 2 vibratory polisher with 50 nm colloidal silica suspension (BUEHLER, Lake Bluff, Illinois) was used, for ∼8 h.
Ferrite content of the welds was measured by Fischer Ferritoscope FMP30 (Fischer Measurement Technologies (India) Pvt Ltd., New Delhi, India). Hardness was obtained by Vickers’s microhardness test (Shimadzu microhardness tester, Shimadzu Corp., Kyoto, Japan) with a load of 500 g for dwell time 10 s. The tensile test was carried out as per ASTM E8M-04 by using Instron Universal Testing Machine (model-4467, Instron, Buckinghamshire, United Kingdom) with a maximum capacity of 30 kN. 19 In sequence, modified Strauss test was also conducted to detect the intergranular corrosion (IGC) attack, if any, in the weldment according to ASTM A 262 practice-E. 20
Impact test was conducted (as per ASTM E23-04) 21 at room temperature. Since the plate thickness was small, hence sub-sized impact specimens were prepared [55 (length) × 10 (width) × 3 (thickness) [mm] with 2 mm V-notch at the center with 45° groove].
Potentiodynamic polarization test (for pitting corrosion) and galvanic corrosion test (with the help of zero resistance ammeter (ZRA) for the period of 12 h) were performed in 3.5 wt% NaCl solution by using an electrochemical analyzer (EC-Lab V10.40 with eight channels Biologic Science Instrument, Seyssinet-Pariset, France). The range of the potential was set to −300 mV (E OCP) to 1400 mV and the scanning speed to 0.5 V/s for pitting corrosion. Ag/AgCl electrode was used as a reference electrode for both the process. The surface area of 0.5 cm2 was adopted for both the welds. Note: tests were made three times for reproducibility.
III. RESULT AND DISCUSSION
A. Microstructural characterization
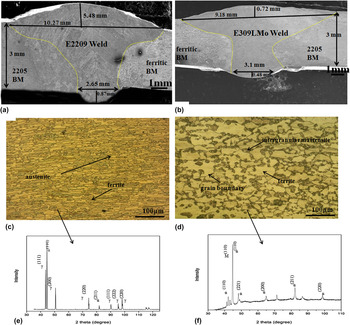
The investigation of welds was performed from BM across the HAZ to WM. Figures 1(a) and 1(b) illustrate the low magnification SEM macrographs of both the welds, sound welded joints without any defects were observed. Figures 1(c) and 1(d) show the optical micrographs of DSS 2205 and AISI 430 FSS BM, respectively. Both BMs had a different microstructure, DSS 2205 BM showed combined ferrite and austenite dual hybrid phases, Reference Verma, Taiwade, Khatirkar, Sapate and Gaikwad13 while AISI 430 FSS BM illustrated ferrite with an island of grain boundary martensite. Reference Ramkumar, Chandrasekhar, Singh, Ahuja and Arivazhagan8
(a) E2209 weld macrograph, (b) E309LMo weld macrograph, (c) DSS 2205 BM microstructure, (d) AISI 430 FSS BM microstructure, (e) X-ray diffraction pattern of DSS 2205 BM, (f) X-ray diffraction pattern of AISI 430 FSS BM.

X-ray diffraction technique [Figs. 1(e)–1(f)] revealed the phases present in the BMs and confirmed the various peaks of austenite [(111), (200), (220), and (222)] and ferrite [(110), (220), and (211)] in DSS 2205 BM [Fig. 1(e)]. Whereas in AISI 430 FSS BM [Fig. 1(f)], (110), (200), (211), and (220) peaks of ferrite and (110) peak of martensite were evident. However, variation in the peak intensity was noticed and no other intermetallics were observed in the BMs.
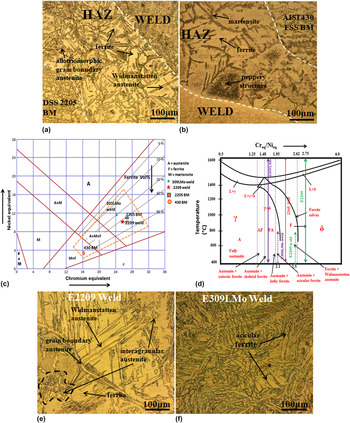
The HAZ of both the BMs side is shown in Figs. 2(a) and 2(b). DSS 2205 side HAZ illustrated ferrite grains with grain boundary austenite (GBA), Widmanstatten austenite (WA) and intragranular austenite (IGA), Reference Verma and Taiwade3,Reference Aguilar, Tabares and Serna15,Reference Lippold and Kotecki22 while large grains of ferrite were observed along with martensite in AISI 430 FSS side HAZ. It was reported Reference Mas, Martin, Lhuissier, Bréchet, Tassin, Roch, Todeschini and Simar23 that the microstructure of HAZ was mainly influenced by welding heat source and physical properties of the materials, whereas WM microstructure can be controlled by both chemical composition of electrodes and welding parameters.
Optical micrographs of dissimilar weldments (a) DSS 2205 BM side HAZ, (b) AISI 430 FSS BM side HAZ, (c) Espy a modified Scheaffler diagram, (d) Fe–Cr–Ni pseudo binary diagram, (e) E2209 weld, (f) E309LMo weld.

The weld microstructure was predicted by Espy diagram [Fig. 2(c)] by considering the chemical composition of BMs, electrodes and weld dilution.
The level of mixing between BMs and electrodes majorly affects solidification mode and ferrite content, as the dilution increases solidification mode changes from fully ferritic (F) to ferritic-austenitic (FA) and fully austenitic (A) mode. Reference Eghlimi, Shamanian, Eskandarian, Zabolian, Nezakat and Szpunar24 The measurement of the WM dilution level was quantified through the area ratio of BM fused [A BMF = (A 430 side BMF + A 2205 side BMF)] of both sides to the total weld deposit (A TWD) and it is expressed as a percentage dilution followed by equation. Reference Verma, Taiwade, Khatirkar, Sapate and Gaikwad13,Reference Verma and Taiwade14,Reference Mukherjeey and Pal25
 $$\% {{\rm{D}}_{\rm{L}}} = {{{A_{{\rm{BMF}}}}} \over {{A_{{\rm{TWD}}}}}} \times 100\quad .$$
Metallographic method (by SEM) and ImageJ software were used to calculate the individual geometrical cross-sectional area of the melted BM and deposited electrode. Since in dissimilar joint both DSS 2205 and AISI 430 FSS showed different dilution behavior due to different thermal properties. The individual dilution of DSS 2205 and AISI 430 FSS in the welds were calculated as mentioned in Table I.
Creq/Nieq ratio of BMs, electrodes and welds (as per ≥46.8 and ≥48.7) were calculated and indicated in Espy diagram [Fig. 2(c)]. The calculation was done as per given equation. Reference Verma, Taiwade, Khatirkar, Sapate and Gaikwad13,Reference Verma and Taiwade14
 $${\rm{C}}{{\rm{r}}_{{\rm{eq}}}} = \% {\rm{Cr}} + \% {\rm{Mo}} + 1.5 \times \% {\rm{Si}} + 0.5 \times \% {\rm{Cb}} + 5 \times \% {\rm{V}} + 3 \times \% {\rm{Al}}\quad {\rm{,}}$$
 $${\rm{N}}{{\rm{i}}_{{\rm{eq}}}} = \% {\rm{Ni}} + 30 \times \% {\rm{C}} + 0.87 \times \% {\rm{Mn}} + 0.33 \times \% {\rm{Cu}} + 30 \times \left( {\% {\rm{N}} - 0.045} \right)\quad .$$
Both the welds showed distinct ferrite and austenite morphology as per Espy diagram.
The Creq/Nieq ratio of the welds and BMs were also plotted in Fe–Cr–Ni pseudo-binary diagram which is the most important tool to predict the final microstructure corresponding to solidification mode Reference Verma, Taiwade, Khatirkar, Sapate and Gaikwad13,Reference Verma and Taiwade14 as it is shown in Fig. 2(d).
Figures 2(e) and 2(f) illustrates the peculiar microstructure of both the welds. In E2209 weld, the morphological features [Fig. 2(e)] were quite different than that of E309LMo weld, it appeared as a hybrid phase of austenite and ferrite due to F mode of solidification, L → L + δ → δ → δ + γ (where “L” is liquid, “δ” is delta ferrite and “γ” is austenite). Reference Verma and Taiwade3 It was reported that if Creq/Nieq > 1.95 considered to be an F mode. Reference Verma and Taiwade3 E2209 weld showed higher Creq/Nieq ratio than that of E309LMo weld, therefore, different microstructure evolved as indicated in Fig. 2(d).
The primary austenite which directly nucleated from columnar ferrite phase during solid state transformation, then WA a needle-like shape, branched from the GBA (primary austenite) showing to displacement and diffusion mechanism of alloying elements and IGA within the ferrite grains precipitated only at a lower temperature with higher undercooling. Reference Verma and Taiwade3,Reference Eghlimi, Shamanian and Raeissi26,Reference Yang, Yan, Li and Wang27
On the other hand, 309LMo weld [Fig. 2(f)] solidified in an F mode with lower Creq/Nieq ratio [Fig. 2(d)] compared to E2209 weld, the reason of shifting toward F mode was due to high dilution of DSS and FSS BMs in the weld. The WM primarily consisted of a solidified dendritic structure of austenite with acicular ferrite in the cores of subgrain of austenite and remain stable as δ-ferrite at room temperature. Reference Eghlimi, Shamanian, Eskandarian, Zabolian and Szpunar28 However, multi-directional grain growth comprising of cellular, dendritic and equiaxed grains were observed due to the chemical composition of the austenitic electrode having more austenite former elements (C, Ni and Mn). Reference Eghlimi, Shamanian, Eskandarian, Zabolian and Szpunar28 Higher dilution of AISI 430 FSS and DSS 2205 was also expected in the weld during welding which increased ferrite content in the weld significantly resulted in acicular ferrite formation in the E309LMo weld.
Ferrite content of the welds was measured by ferritoscope based on the magnetic method. The measured ferrite content [in ferrite number (FN)] of the welds was 47 FN (34.3 vol%) in E2209 and 24 FN (22.9 vol%) in E309LMo. Whereas the predicted ferrite content according to Espy diagram [Fig. 2(c)] in volume percentage (vol%) was measured ∼42 vol% in E2209 and ∼20 vol% in E309LMo weld which was also the good agreement of ferritoscope measurement.
B. EBSD analysis
The EBSD was used to study the evolution of the microstructure (structure of a material revealed by microscopy) and micro-texture (set of crystallographic orientations) with major emphasis on phase analysis of WM and HAZ. EBSD maps were acquired on the transverse direction plane of the rolled sheets that were welded with the welding direction being normal to the plane of the paper.
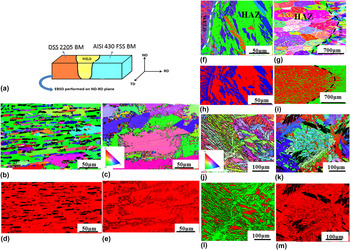
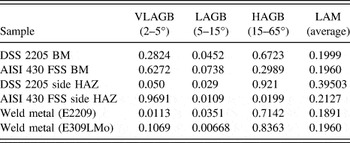
Inverse pole figure (IPF) map in the Z direction (perpendicular to welding direction, i.e., the transverse plane) of different regions (schematic of the welded joint subjected to EBSD) is shown in Fig. 3(a). The various colors of the IPF map indicated crystal orientations. Figures 3(b) and 3(c) show the IPF of DSS 2205 and AISI 430 FSS BM respectively, which indicated heterogeneous structure in the BMs. Duplex 2205 BM [Fig. 3(b)] shows a dual-phase microstructure comprising of body center cubic (BCC) ferrite and face center cubic (FCC) austenite phase. Reference Eghlimi, Shamanian and Raeissi26,Reference Eghlimi, Shamanian, Eskandarian, Zabolian and Szpunar28 Fig. 3(d) shows the phase map of DSS 2205 BM, both the phases showed a typical banded structure and the ferrite phase showed a high volume fraction (0.6723) of high angle grain boundary (HAGB) as it is mentioned in Table II.
Schematic, EBSD IPF map and phase map of both the weldments.

Volume fraction of misorientation angle.

On the other hand, AISI 430 FSS BM illustrates [Fig. 3(c)] ferrite (BCC) matrix with intergranular martensite, Reference Lippold and Kotecki22 XRD patterns [Fig. 1(f)] revealed the presence of martensite phase in AISI 430 FSS BM. The AISI 430 FSS BM was deformed, which reflected very low angle grain boundary (VLAGB) with misorientation angles of smaller than 5°, the measured fraction of VLAGB was 0.6272 (Table II).
Figure 3(f) shows the IPF map of AISI 430 FSS side HAZ, the large size of ferrite grains were observed with large variation of martensite (width and length varying from less than ∼4 µm, similar for both electrode welds). In the HAZ of ferritic BM side, significant grain growth was observed, the higher local average misorientation (LAM) in this region was also the indication of such phenomenon. The fraction of VLAGB was high, which indicated higher dislocation density within the grains. It was reported by Lippold and Kotecki Reference Lippold and Kotecki22 that any austenite which forms at elevated temperature will transform to martensite upon cooling to room temperature leaving no carbon available for carbide formation. There was grain growth in the FSS HAZ due to lack of a significant second pinning phase. Reference Ramkumar, Kumar, Radhakrishna, Kothari, Sridhar, Arivazhagan and Kuppan16
Phase map of ferritic HAZ [Fig. 3(h)] indicated a distinct color to differentiate the phases present in the HAZ, ferrite and martensite phase with the help of color variation (red color = ferrite, blue color = martensite). The large ferrite grain was measured ∼0.31 mm, whereas the average HAZ width was ∼1.2 mm for both the electrode welds, which may be attributed to higher thermal conductivity of FSS. Reference Lippold and Kotecki22
On the other hand, in DSS 2205 side HAZ [Fig. 3(g)] more ferritization occurred due to the higher thermal conductivity of ferrite. Moreover, during heating, some austenite grains were formed and the presence of austenite in the ferritic matrix of DSS 2205 side HAZ controlled the grain growth and hence the width of HAZ (∼0.83 mm) was considerably smaller than AISI 430 FSS side HAZ. Reference Singh12,Reference Lippold and Kotecki22 More grains with 〈111〉 orientation were apparently dominant in the HAZ. However, the presence of 〈111〉 texture along ND can be attributed to the tensile forces along the direction of heat flow that results in compressive stresses along TD.
The large volume fraction of HAGB and LAM (Table II) indicated grain growth. Figure 3(i) illustrates the phase map of DSS 2205 side HAZ.
E2209 weld [Fig. 3(j)] comprised of austenite and ferrite hybrid micro-constituents, but the morphological features and orientation were typically different than that of DSS 2205 BM. In WM region, very large fraction of HAGB (Table II) indicated pronounced nucleation and resulted in relatively small recrystallized grains because of high cooling rate. Reference Verma and Taiwade3,Reference Verma, Taiwade, Khatirkar and Kumar17 It was reported Reference Eghlimi, Shamanian, Eskandarian, Zabolian and Szpunar28,Reference Shamanian, Mohammadnezhad, Amini, Zabolian and Szpunar29 that the dendritic growth with 〈100〉 grains during welding have a detrimental effect on the mechanical properties and leads to brittle fracture.
Phase map [Fig. 3(l)] of E2209 weld distinguished the ferrite and austenite phase with the help of color variation (green color = austenite, red color = ferrite). However, chemistry variation synergistically affects the phase balance. Reference Eghlimi, Shamanian, Eskandarian, Zabolian, Nezakat and Szpunar24,Reference Shamanian, Mohammadnezhad, Amini, Zabolian and Szpunar29
Whereas 309LMo weld [Fig. 3(k)] showed dendritic growth of acicular ferrite (with ∼86 µm length) with 〈111〉 dominated austenite orientation, the formation of acicular ferrite was due to higher ferrite former Mo content, which increased Creq/Nieq ratio (Table I) as mentioned above and depicted in Fig. 2(d). Phase map illustrates [Fig. 5(h)] the ferrite and austenite phases with the help of color variation (red color = austenite, black color = ferrite). Variation in the chemistry changed the solidification mode and phase balance. Reference Eghlimi, Shamanian, Eskandarian, Zabolian, Nezakat and Szpunar24 In both the cases, welded region did not illustrate the presence of substructure or any detrimental precipitates. Substructure is an arrangement of dislocations to form low energy configurations, that is boundaries with <15° misorientation. Reference Eghlimi, Shamanian, Eskandarian, Zabolian, Nezakat and Szpunar24,Reference Shamanian, Eghlimi, Eskandarian and Szpunar30
C. Hardness and tensile test
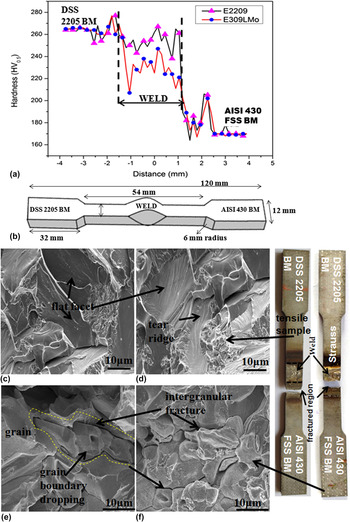
Vicker’s micro-hardness test was carried out on the transverse section of the weldment (BM, HAZ and weld). Figure 4(a) shows the hardness variations of both the weldments. Higher hardness was observed in E2209 weld (258.8 HV0.5) compared to E309LMo weld (236.1 HV0.5) attributed to solid solution strengthening (interstitial solid solution by N and C and substitutional solid solution by Mo and Cr) and the difference in developed microstructure by different Creq/Nieq ratio and level of dilution. Reference Verma and Taiwade3,Reference Aguilar, Tabares and Serna15 The hardness of DSS 2205 BM was measured 264 HV0.5 due to well-balanced ferrite and austenite phases, whereas 176.9 HV0.5 was measured in AISI 430 FSS BM due to lower amount of alloying elements and morphological features. Reference Verma, Taiwade, Khatirkar, Sapate and Gaikwad13,Reference Lippold and Kotecki22
(a) Microhardness profile of the weldments, (b) schematic diagram of tensile specimen, (c) and (d) tensile fractograph of E2209 and E309LMo welds respectively, attached with tested fractured tensile specimen and (e, f) Strauss fractograph of both E2209 and E309LMo welds, attached with tested fractured tensile specimen.

The tensile test was conducted for both the welds and the dimensions are represented in a schematic diagram as it is illustrated in Fig. 4(b). The fractured micrographs of tensile tested samples are illustrated in Figs. 4(c) and 4(d), which belongs to a predominantly brittle fracture. Since both electrodes welded samples were broken from AISI 430 FSS BM, only far distance from the weld, hence it was inconclusive to discuss in detail, only the weld restraint helps to increase the tensile strength of the weld. Reference Sathiya, Aravindan and Haq6
E2209 weld showed higher tensile strength (575 MPa) than that of E309LMo weld (561 MPa). The higher restraint of E2209 weld could be attributed to higher solid solution strengthening due to higher dilution and Creq/Nieq ratio. Reference Verma and Taiwade3,Reference Sathiya, Aravindan and Haq6,Reference Verma, Taiwade, Khatirkar and Kumar17
On the other hand, DSS 2205 BM showed 626 MPa tensile strength, while 430 FSS BM showed 476 MPa, the difference in both the BMs was due to different morphological features and alloying elements. Reference Verma and Taiwade3,Reference Aguilar, Tabares and Serna15
In addition modified Strauss test also carried out to check the susceptibility of weldments to IGC attack. Modified tensile test gives the considerable changes in mechanical properties, like strength and ductility by the intergranular attack in the Strauss test medium.
Tensile specimens were experienced in the Strauss medium (Cu–CuSO4–16% H2SO4), boiling at 100 °C for 36 h and then followed by the tensile test, the fracture occurred from AISI 430 FSS side HAZ in both the welds, which indicated the intergranular attack in the HAZ. Moreover, the significant reduction in strength was evident (295 MPa) in the Strauss test. Fractograph [Figs. 4(e) and 4(f)] revealed the intergranular fracture in both the cases. From the literature, Reference Joshi and Stein31 it was believed that the Cr depletion or carbide formation may cause the IGC attack in this region and more dissolution of the ferrite phase in this environment resulted in the reduction in strength.
D. Impact test
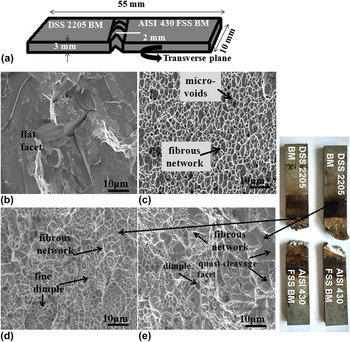
The Charpy V-notch test was conducted at room temperature to know the response of the weldments to sudden impact loads. Reference Verma and Taiwade3 The dimensions were mentioned in the schematic diagram as it is shown in Fig. 5(a).
Fractograph of impact specimen of weldment (a) schematic diagram of impact specimen, (b) AISI 430 FSS BM, (c) DSS 2205 BM, (d) E2209 weld, (e) E309LMo weld, attached with fractured samples.

Experimental results indicated lower impact energy of AISI 430 FSS BM (∼6 J) due to lower alloying elements and formation of hard martensite. Fractograph [Fig. 5(b)] revealed flat facets and a very shallow tearing ridge. Whereas DSS 2205 BM showed higher impact energy (∼69 J) owing to large fibrous network attributed to proper phase balance as it is shown in Fig. 5(c). The next higher impact energy was measured in case of E2209 weld (∼48 J) as compared to E309L weld (∼24 J). The higher impact energy of E2209 weld compared to its counterpart could be attributed to a higher dilution resulted in higher Creq/Nieq ratio and different morphological features. Reference Verma, Taiwade, Khatirkar, Sapate and Gaikwad13,Reference Verma and Taiwade14 It was also reported that the presence of higher N in E2209 weld helps to increase the toughness of E2209 weld. Reference Verma and Taiwade3,Reference Aguilar, Tabares and Serna15
From the fractograph [Fig. 5(d)], it was noticed that E2209 weld showed fine and large amounts of dense, well-developed dimples, indicated adequate ductility. While E309LMo illustrated [Fig. 5(e)] mix dimples with coarse and fine, quasicleavage was also noticed in some region, the fractured sample (in E309LMo weld) showed that the fracture occurred first from the ferritic HAZ side then propagated toward the weld center.
E. Pitting corrosion
Pitting corrosion represents the localized small hole, which causes of catastrophic failure of the materials. Pitting resistance of the materials is indexed by PREN, the sudden change in chemical composition, changes the pitting behavior. Reference Verma and Taiwade3,Reference Yang, Yan, Li and Wang27 This order is consistent with given formula Reference Verma and Taiwade3
 $${\rm{PREN}} = \% {\rm{Cr}} + 3.3\;\% {\rm{Mo}} + 16\;\% {\rm{N}}\quad {\rm{.}}$$
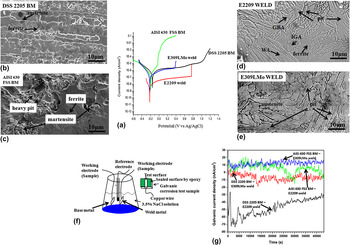
The potentiodynamic polarization curve is shown in Fig. 6(a). From the curve, it was observed that the DSS 2205 BM had highest E pit value, thereby being the most resistant to pitting corrosion among welds and ferritic BM. The balanced phase ratio of austenite and ferrite which can inhibit the preferential dissolution of the ferrite phase due to the galvanic coupling between these two phases. Reference Verma and Taiwade3,Reference Eghlimi, Shamanian and Raeissi26,Reference Yang, Yan, Li and Wang27 From the micrograph [Fig. 6(b)] of DSS 2205 BM, no pit was observed.
(a) Potentiodynamic anodic polarization of weldments, (b) micrograph of 2209 DSS BM, (c) micrograph of AISI 430 FSS BM showing pits, (d) E2209 weld showing pits, (e) E309LMo weld showing pits, (f) schematic diagram of galvanic set-up, (g) galvanic current density/time graph of weld couples.

The next most resistant was E2209 weld (E pit = 0.79 V) followed by E309LMo weld (E pit = 0.32 V. It is well known that, Mo and Cr-enriched the ferrite phase, whereas N promoted the austenite phase. Reference Verma and Taiwade3,Reference Verma, Taiwade, Khatirkar and Kumar17 However, E2209 weld had higher Creq/Nieq ratio and higher dilution than that of E309LMo weld. Nitrogen associates in repassivation, whereas Mo suppresses initiation of pits. Reference Eghlimi, Shamanian and Raeissi26,Reference Yang, Yan, Li and Wang27
Pits were observed mostly in austenite phase in both the welds, E2209 [Fig. 6(d)] and E309LMo [Fig. 6(e)]. However, in E2209 weld more pits were evident in IGA compared to GBA and WA.
DSS 2205 BM showed highest PREN (35.27) followed by E2209 (34.54) then E309LMo (31.2), while ferritic BM showed lowest PREN (16.24). The higher PREN of DSS 2205 BM was attributed to the synergy of higher concentration of Mo, Cr, and N content and hence more immune for pitting corrosion. While AISI 430 FSS BM had the highest content of the C and the lowest content of Cr and Mo, which showed lowest E pit (−0.29 V), therefore, chloride ions easily accumulate in the pits, changing the micro-environment. Heavy pits were observed in martensite phase than ferrite phase as it is shown in Fig. 6(c). From the observed trend, it was suggested that C was detrimental to the pitting resistance.
F. Galvanic corrosion
Figure 6(f) illustrates a schematic diagram for galvanic corrosion test. The couple was formed between WM part (excluding HAZs and BM) and BM. Since HAZ was very small and difficult to test separately, hence only WM was tested.
Figure 6(g) shows the galvanic current densities (I G) of BM and weld couples as a function of time. It was observed that the I G of all the couples were varied with time (12 h test) and showed very low galvanic corrosion rates only in the range of nA/cm2. However, the galvanic corrosion rate of the galvanic couple depends on the potential difference and electrochemical behavior of different materials based on composition and developed microstructure. Reference Tsai and Chen32 From the experimental results, it was noticed that the I G for DSS 2205 BM-E2209 weld couple was lowest (−42.78 nA/cm2) due to the small difference in δ-ferrite between the couple. Reference Tsai and Chen32,Reference Alinejad, Korojy and Ebrahimi33 While highest I G was measured in AISI 430 FSS BM-309LMo weld couple (13.77 nA/cm2) attributed to the large δ-ferrite difference between couple. However, 5 nA/cm2 I G was measured in AISI 430 FSS BM-E2209 weld couple, whereas −7.65 nA/cm2 was in case of 2205 BM-309LMo weld couple. From the results, it was suggested that the large potential difference is enough for an acceleration of the galvanic phenomenon. No pit or discoloration was noticed on the surface (Note: All the data related to pitting and galvanic corrosion can be referred in Supplementary Material Table SI).
IV. CONCLUSIONS
-
(1) Higher dilution and higher Creq/Nieq ratio in E2209 weld promoted GBA, Widmanstatten and IGA. While E309LMo with lower Creq/Nieq ratio promoted acicular delta ferrite in the subgrains of austenite.
-
(2) Significant variations in the feature of base metal, HAZ, and weld illustrated the presence of a very strong texture. The ferritic base metal HAZ side higher LAM indicated significant grain growth. While the large volume fraction of high angle grain boundary and LAM also indicated grain growth in duplex side HAZ.
-
(4) Higher dilution and higher Creq/Nieq ratio in ferritic mode solidified E2209 weld significantly increased the hardness and tensile strength compared to E309LMo weld. Whereas lower hardness and tensile strength were observed in AISI 430 FSS BM.
-
(5) Intergranular fracture in Strauss test revealed the HAZ sensitization of AISI 430 ferritic side in both the weld cases.
-
(6) Very fine, dense dimples, and plastic network in E2209 weld showed high impact energy, while fine dimple along with a quasicleavage appearance reduces impact toughness in E309LMo weld.
-
(7) High alloying elements such as Cr, Mo, and N in E2209 weld promoted higher pitting resistance. Whereas lower pitting potential and higher dissolution were observed in AISI 430 FSS BM.
-
(8) The small difference in delta ferrite between the weld couple (DSS 2205 BM and E2209) showed less corrosion current density resulted in more galvanic corrosion resistance. While more galvanic corrosion showed in AISI 430 FSS BM-E309LMo weld couple.
Supplementary Material
To view supplementary material for this article, please visit https://doi.org/10.1557/jmr.2017.269.
ACKNOWLEDGMENTS
The authors express their sincere thank to Director, VNIT Nagpur for providing facilities and constant encouragement to publish this paper. The authors express their acknowledgment to Dr. Nilesh Gurao, IIT Kanpur for their valuable inputs. The authors are grateful to Texture Laboratory at Advanced Center for Material Science, IIT Kanpur.