INTRODUCTION
Advanced proficiency in a second language (L2) is a highly desirable skill, known to increase academic, economic, and social opportunities. However, few adult learners reach a level of L2 proficiency that enables them to fully exploit these advantages. That is because adults encounter both external and internal constraints to L2 attainment (e.g., Saito et al., Reference Saito, Macmillan, Mai, Suzukida, Sun, Magne and Murakami2020). While these constraints are known to co-occur, their impact on L2 outcomes and L1 maintenance has rarely been evaluated in the same participant sample (Saito et al., Reference Saito, Macmillan, Mai, Suzukida, Sun, Magne and Murakami2020; Schmid & Yilmaz, Reference Schmid and Yilmaz2018). The current study evaluates the contribution of learner-external and learner-internal factors to L2 and native language (L1) speaking proficiency in college-aged L2 learners.
LEARNER-EXTERNAL CONSTRAINTS
Among the learner-extrinsic constraints to L2 acquisition, we consider age of acquisition, linguistic context, and L1–L2 distance. Age of acquisition (e.g., Hartshorne et al., Reference Hartshorne, Tenenbaum and Pinker2018; Johnson & Newport, Reference Johnson and Newport1989) and linguistic context (Bice & Kroll, Reference Bice and Kroll2019; Linck et al., Reference Linck, Kroll and Sunderman2009) influence the relative amount of exposure to the L1 and L2 (see Gollan et al., Reference Gollan, Montoya, Cera and Sandoval2008 and Whitford & Titone, Reference Whitford and Titone2012 for a discussion of the weaker links hypothesis). Intuitively, more opportunities to practice retrieving the L2 have been linked to higher L2 proficiency outcomes in both L2 immersion (Serrano et al., Reference Serrano, Llanes and Tragant2011; Sunderman & Kroll, Reference Sunderman and Kroll2009) and classroom environments (Barcroft, Reference Barcroft2007; Kang et al., Reference Kang, Gollan and Pashler2013). L1–L2 distance contributes to the relative difficulty of L2 acquisition. Learners of a structurally distinct L2 do not experience difficulties acquiring those L2 features that are similar to the L1 (e.g., Malt, Reference Malt2020; Tolentino & Tokowicz, Reference Tolentino and Tokowicz2014). The difficulty comes from acquiring features that are unique to the L2 (e.g., Saito & Munro, Reference Saito and Munro2014; Tolentino & Tokowicz, Reference Tolentino and Tokowicz2014).
LEARNER-INTERNAL CONSTRAINTS
Among the learner-intrinsic constraints to L2 acquisition, we consider individual variation on working memory (Linck et al., Reference Linck, Osthus, Koeth and Bunting2014; Linck & Weiss, Reference Linck and Weiss2015) and cognitive control (Kapa & Colombo, Reference Kapa and Colombo2014).
Working memory
Considered a key component to L2 aptitude (e.g., Robinson, Reference Robinson2001; Skehan, Reference Skehan and Robinson2002), working memory is responsible for storing and organizing information in short-term memory during cognitive tasks (for a review, see Cowan, Reference Cowan and Wixted2017). Working memory also functions to control which information is worth attending to. Early models described working memory as a multicomponent system (Baddeley, Reference Baddeley1986; Baddeley & Hitch, Reference Baddeley, Hitch and Bower1974), comprising two temporary store systems (i.e., a phonological loop for verbal information and a visuospatial sketchpad for visuospatial information) and a central executive system responsible for directing attention, controlling information in each store, and deciding which information to ignore. The more recent version of the model (Baddeley, Reference Baddeley2000) also contains an episodic buffer, which serves as the interface between the two store systems, allowing storage and processing of complex stimuli and linking information to long-term memory. A more contemporary model (Cowan, Reference Cowan1988, Reference Cowan1995, Reference Cowan2005) conceptualizes working memory as involving a subset of prior knowledge elements (i.e., long-term memory) activated in response to external stimuli, which become the focus of attention, being readily available for cognitive processing. The model proposes that an attention-orienting system (driven by novel stimuli) and a central executive mechanism (involving voluntary and controlled attentional processes) come into play to determine which element will enter conscious awareness. Both Baddeley (Reference Baddeley1986) and Cowan (Reference Cowan1995, Reference Cowan2005) agree that memory activation is time limited and is subject to interference and decay if items are not actively rehearsed. The models emphasize the central executive as the determiner of individual differences in working memory.
The link between working memory and L2 learning outcomes in adults has been evaluated in the context of classroom instruction (e.g., Kormos & Sáfár, Reference Kormos and Sáfár2008; Linck & Weiss, Reference Linck and Weiss2015; Sagarra, Reference Sagarra2017; Sparks et al., Reference Sparks, Patton and Luebbers2019) and L2 immersion (e.g., Sunderman & Kroll, Reference Sunderman and Kroll2009; Swanson, Reference Swanson2015; Wright, Reference Wright2013). In both settings, working memory was positively correlated with measures of L2 production and comprehension (e.g., Kormos & Sáfár, Reference Kormos and Sáfár2008; Martin & Ellis, Reference Martin and Ellis2012; Sagarra, Reference Sagarra2017; Swanson, Reference Swanson2015; for a review, see Juffs & Harrington, Reference Juffs and Harrington2011). While most evidence comes from cross-sectional studies, a few longitudinal studies (Linck & Weiss, Reference Linck and Weiss2015; Sagarra, Reference Sagarra2017, Experiment 2; Sparks et al., Reference Sparks, Patton and Luebbers2019; Swanson, Reference Swanson2015) and a meta-analysis (Linck et al., Reference Linck, Osthus, Koeth and Bunting2014) confirm the association between individual differences in working memory and gains in L2 proficiency. However, not all studies replicate this relationship (e.g., Grey et al., Reference Grey, Cox, Serafini and Sanz2015; Juffs, Reference Juffs2005; Wright, Reference Wright2013). Variation in results may be attributed to factors such as task type and learners’ L2 proficiency level. For example, Sagarra (Reference Sagarra2017) found that working memory only predicted L2 grammar and reading development when a working memory test with a taxing processing component was used. Others report that the strength of the relationship is robust at lower levels of proficiency, but decreases in strength as L2 proficiency goes up (e.g., Grey et al., Reference Grey, Cox, Serafini and Sanz2015; Hummel, Reference Hummel2009; Serafini & Sanz, Reference Serafini and Sanz2016).
Cognitive control
Bilinguals’ two languages are activated in parallel, independently of linguistic context (e.g., Van Hell & Dijkstra, Reference Van Hell and Dijkstra2002). This coactivation generates cross-language competition in all language modalities (e.g., Jared & Kroll, Reference Jared and Kroll2001; Kroll et al., Reference Kroll, Bobb, Misra and Guo2008; Spivey & Marian, Reference Spivey and Marian1999). Cognitive control is one of the mechanisms that enable bilinguals to regulate competition and functionally manage their two languages (e.g., Abutalebi & Green, Reference Abutalebi and Green2008). The Inhibitory Control model (Green, Reference Green1998) proposed that this domain-general ability is reactive in nature, being engaged in the detection and resolution of within and cross-language interference. A more recent version of the model (Green & Abutalebi, Reference Green and Abutalebi2013) proposes that bilingual language control may involve the coordinated engagement of both reactive (i.e., detection and resolution of interference) and proactive (i.e., conflict monitoring, interference suppression) control mechanisms.
Cognitive control has been reported to correlate with measures of L2 proficiency (e.g., Bialystok et al., Reference Bialystok, Craik and Luk2008; Luo et al., Reference Luo, Luk and Bialystok2010; Pivneva et al., Reference Pivneva, Palmer and Titone2012). However, the direction of causality in this relationship remains unclear. One proposal is that cognitive control may be improved through the bilingual experience. Lifelong practice resolving competition from the L1 has been linked to more efficient novel language learning (Bartolotti & Marian, Reference Bartolotti and Marian2012) and other long-term cognitive benefits (e.g., Bialystok et al., Reference Bialystok, Craik and Freedman2007; but see Paap & Greenberg, Reference Paap and Greenberg2013). An alternative interpretation is that individuals with better cognitive control may be the ones who achieve higher L2 proficiency. Evidence for this proposal is mixed. Few studies have shown that better reactive control is associated with higher L2 proficiency among adult beginner (Bartolotti et al., Reference Bartolotti, Marian, Schroeder and Shook2011; Kapa & Colombo, Reference Kapa and Colombo2014) and intermediate L2 learners (Luque & Morgan-Short, Reference Luque and Morgan-Short2021). In contrast, other studies suggest that individual differences in working memory, but not cognitive control predict L2 proficiency outcomes (Linck et al., Reference Linck, Hughes, Campbell, Silbert, Tare, Jackson and Doughty2013; Linck & Weiss, Reference Linck and Weiss2015).
CONSEQUENCES OF L2 ACQUISITION ON L1 PROFICIENCY
The underlying assumption of research on L2 attainment is that the L1 is a stable system that is not susceptible to change in the process of bootstrapping the L2. However, as the L2 builds upon the L1 system to facilitate L2 learning (e.g., Lemhöfer et al., Reference Lemhöfer, Spalek and Schriefers2008; Marian & Kaushanskaya, Reference Marian and Kaushanskaya2007), the two systems interact, resulting in L1 changes in the context of L2 learning (e.g., Botezatu et al., Reference Botezatu, Kroll, Trachsel and Guoin press; Linck et al., Reference Linck, Kroll and Sunderman2009). Slower and less accurate L1 lexical retrieval may occur as a consequence of L2 interference (e.g., Jared & Kroll, Reference Jared and Kroll2001) or reduced L1 access (Botezatu et al., Reference Botezatu, Kroll, Trachsel and Guoin press; Ivanova & Costa, Reference Ivanova and Costa2007; Linck et al., Reference Linck, Kroll and Sunderman2009) as a result of L1 inhibition (Guo et al., Reference Guo, Liu, Misra and Kroll2011; Kroll et al., Reference Kroll, Bobb, Misra and Guo2008). However, L2 proficiency is also known to facilitate the speed of L1 lexical retrieval by providing a frequency boost for translation-equivalent L1 words (Higby et al., Reference Higby, Donnelly, Yoon and Obler2020). In light of empirical evidence that the interaction of the two languages in the bilingual mind is bidirectional, reflecting a dynamic language system (for reviews, see Kroll et al., Reference Kroll, Bobb and Hoshino2014, Reference Kroll, Dussias, Bice and Perrotti2015), it becomes critical to consider the consequences of L2 exposure on L1 proficiency when evaluating predictors of L2 outcomes in diverse learner populations. The approach of investigating speakers’ L2 and L1 proficiency has been previously employed with highly proficient bilinguals living in an L2-speaking environment (Schmid & Yilmaz, Reference Schmid and Yilmaz2018), but to our knowledge, it has not been employed with college-aged L2 learners.
THE CURRENT STUDY
This cross-sectional study evaluated the sources of variation in L2 and L1 proficiency among college-aged L2 learners. We focused on outcome measures of language production because fluent language production is among the most difficult skills to achieve in the L2 and one of the first L1 skills to be impacted by L2 acquisition (for reviews, see Kroll et al., Reference Kroll, Bobb and Hoshino2014, Reference Kroll, Dussias, Bice and Perrotti2015). When considering learner-external sources of variation, we predicted that longer cumulated time spent using the L2 (operationalized as younger age of L2 acquisition, higher estimated daily L2 exposure and use and L2 immersion) would be associated with higher L2 proficiency, but also with reduced L1 access. In contrast, if L2 proficiency offers a frequency boost to L1 translation equivalents, then higher L2 proficiency should facilitate L1 access. L1–L2 typological distance was predicted to be associated with poorer performance on features that are unique to the L2. When considering learner-internal sources of variation, we predicted that individual differences in verbal working memory and domain-general cognitive control would account for additional variance in L2 proficiency (regardless of L1–L2 distance and learning context). Alternatively, if no relationship between L2 proficiency and cognitive control was observed, but a correlation between L2 exposure frequency and cognitive control was found, it would suggest that cognitive control may not be among the cognitive resources that support L2 acquisition, but may be improved through the bilingual experience.
METHOD
PARTICIPANTS
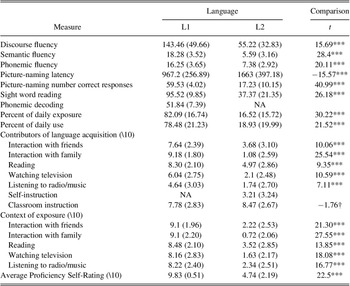
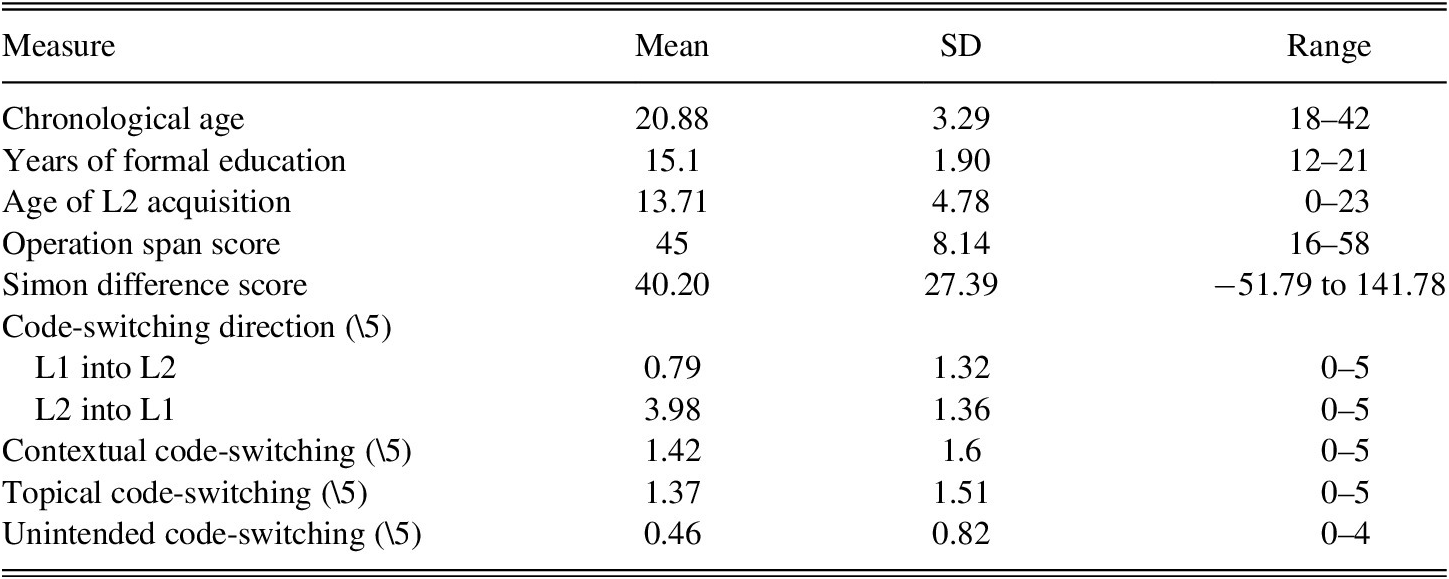
One hundred twelve native English speakers (31 male, mean age = 20.88, age range = 18–42 years) who were classroom L2 learners (i.e., 75 learners of Spanish and 37 learners of Mandarin Chinese) and either lived in the L1 environment (N = 86) or had been immersed in an L2-speaking environment for an average of 6.4 months at the time of the study (N = 26) were recruited from the University of Missouri and Beijing Normal University and completed the study for payment. All participants reported normal hearing and vision and no history of neurological, language, reading, or learning disorders. Participants maintained L1 dominance (operationalized as overall better performance on L1 measures of discourse fluency, verbal fluency, picture naming, word reading, phonemic decoding, and higher self-reported L1 exposure and proficiency; all p < 0.001; see Table 1) and varied on lab-based measures of working memory, cognitive control, and language proficiency, as well as on self-reported L2 exposure and use and code-switching experience (see Table 2). Fifty-two percent of the sample self-identified as code-switchers and reported switching more frequently from the weaker L2 into the stronger L1.
Mean (standard deviation) L1 and L2 performance and self-ratings

† p < .1; * p < .05; **p < .01; ***p < .001.
Means, standard deviations (SD) and ranges for demographic, cognitive, and code-switching measures

MATERIALS AND PROCEDURE
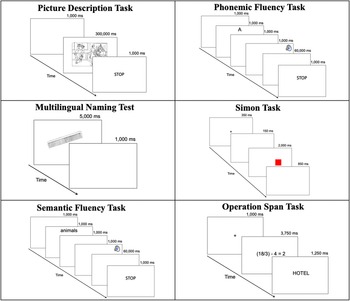
Measures of L1 and L2 proficiency, working memory, cognitive control, language learning experience, and code-switching behavior were collected in one testing session. Equivalent proficiency measures were used in the two languages. Task order was the same within each language. Participants were tested in L1-English first and L2 last to avoid L1 inhibition following L2 performance (Levy et al., Reference Levy, McVeigh, Marful and Anderson2007; Misra et al., Reference Misra, Guo, Bobb and Kroll2012). The majority of tasks were presented electronically using the E-Prime 2.0 software (Psychology Software Tools Incorporated, 2012). Figure 1 summarizes the trial event sequence for each computer-based task. Each task is described in detail in the following text.
Trial event sequence for all computer-based tasks in the study.

Discourse fluency
Discourse fluency was assessed in semistructured contexts using a picture description task and structured contexts using a story tell task. Participants described the Cookie Theft scene from the Boston Diagnostic Aphasia Examination (Goodglass & Kaplan, Reference Goodglass and Kaplan1983) and the Picnic scene from the Western Aphasia Battery (Kertesz, Reference Kertesz1982) and told two stories (“Cinderella” and “The Little Red Riding Hood”) after reviewing the story plot using a picture book. Each trial began with a 1,000 milliseconds (ms) blank screen, followed by a picture (or story name) that cued participants to speak for up to 5 minutes and ended with a 1,000 ms blank screen. The order of trials was counterbalanced within each task. Picture description was assessed first. The resulting language samples were transcribed offline by trained independent raters and scored in terms of average words-per-minute across the picture-description and story-tell tasks (96% interrater reliability), following the system proposed by Nicholas and Brookshire (Reference Nicholas and Brookshire1993).
Word-level fluency
Word-level production fluency was assessed using a minute-long semantic fluency task that required retrieval of lexical items belonging to a named semantic category (animals, clothing, furniture, fruits) and a phonemic fluency task that required retrieval of words that begin with a named letter (F, A, or S in English; P, M, or R in Spanish; not assessed in Chinese due to no agreed-upon equivalent measure). Each trial began with a 1,000 ms blank screen, followed by either a category name (in the semantic fluency task) or a letter name (in the phonemic fluency task) presented in 18-point Courier New bold black font against a white background for 1,000 ms, a 1,000 ms blank screen, a 1,000 ms beep sound that cued participants to start speaking, a 60,000 ms blank screen that marked the time allotted for responding, and a 1,000 ms blank screen that signaled the end of the trial. On each task, participants’ score reflected the average number of correct responses, excluding repetitions (simple or inflected) and proper names (97% interrater reliability).
Expressive vocabulary
Expressive vocabulary was tested using a computerized version of the Multilingual Naming Test (Gollan et al., Reference Gollan, Weissberger, Runnqvist, Montoya and Cera2012). Participants named 68 line drawings of increasing difficulty in sequential order. Each drawing was presented for 5,000 ms or until response onset. Each stimulus was followed by a 1,000 ms blank screen. Response latencies were collected on each trial. Response accuracy was scored offline from audio recordings by independent raters (99% interrater reliability). Performance reflected the average correct-response latency, after excluding incorrect responses and absolute outliers (responses faster than 300 ms or slower than 4,000 ms) and number of correct-response trials.
Speeded word reading
Speeded word reading was assessed in English using the Sight Word Reading subtest of the Test of Word Reading Efficiency (TOWRE; Torgesen et al., Reference Torgesen, Wagner and Rashotte1999), in Spanish using an equivalent list of 104 words (Miller et al., Reference Miller, Heilmann, Nockerts, Iglesias, Fabiano and Francis2006) and in Mandarin using an in-house equivalent list of 92 words. In each language, participants read down a list of words increasing in difficulty, presented in four columns on one sheet of paper. All three tasks measured the number of words read correctly within 45 seconds (98% interrater reliability).
Speeded phonemic decoding
Phonemic decoding was tested in English using the Phonemic Decoding subtest of the TOWRE (Torgesen et al., Reference Torgesen, Wagner and Rashotte1999), which presents a list of 63 nonwords increasing in difficulty. Participants read down a list of nonwords presented in three columns on one sheet of paper. The task measured the number of nonwords read correctly within 45 seconds (98% interrater reliability). Phonemic decoding was not assessed in the L2.
Working memory
Verbal working memory was assessed using the Operation Span task (Turner & Engle, Reference Turner and Engle1989), which required storage of visually presented L1-English words in short-term memory while performing arithmetic operations (unrelated, nonverbal task). The sequence of events started with a fixation cross presented for 1,000 ms, followed by a mathematical equation (e.g., (18/3) – 4 = 2) presented for 3,750 ms that required a button-press judgment of correctness. The mathematical equation was followed by a word (e.g., HOTEL) presented for 1,250 ms that required subsequent retrieval from short-term memory. All events in the sequence were presented in 36-point Courier New bold black font against a white background. Operation-word pair trials were presented in sets ranging from two to six trials. There were three sets of each length, for a total of 60 trials. Participants were instructed to attend to both the processing and storage components of the task. At the completion of each set, participants were asked to recall the words presented in that set. There was no time limit or order requirement on recall. Response accuracy was collected on each trial. The working memory score reflected the number of correctly recalled words from trials on which a correct operation judgment was made (100% interrater reliability).
Cognitive control
Cognitive control was measured using the Simon task (Simon & Rudell, Reference Simon and Rudell1967). The task presented a blue or red square against a white background either on the right, center, or left side of a computer screen, with equal probability of occurrence for each position. Each trial began with a 350 ms fixation cross, followed by a 150 ms blank screen and by either a red or blue square presented against a white background for 2,000 ms. There was an 850 ms intertrial interval. Participants were instructed to press one of two color-coded keys on the standard keyboard to indicate the color of the square, irrespective of the square location. The task consisted of three conditions with 42 trials each: congruent (the square appeared on the same side as the correct-response key), incongruent (the square appeared in the opposite position of the key), and neutral (the square appeared in the center of the screen). By asking participants to attend to the color, but not the location of the square, the task measured their ability to suppress irrelevant information. Response latencies and accuracy rates were collected on each trial. A Simon difference score was computed for each participant as the difference in mean correct-response latency between incongruent and congruent trials. This step occurred after excluding incorrect responses, absolute outliers (responses faster than 200 ms or slower than 2,000 ms), and relative outliers (average reaction time ± 3 standard deviations).
Language learning experience
Language learning experience was measured using the Language Experience and Proficiency Questionnaire (Marian et al., Reference Marian, Blumenfeld and Kaushanskaya2007). Participants rated their L1 and L2 proficiency, learning experience, frequency, and context of exposure and use on a scale from 0 (no proficiency, never) to 10 (nativelike proficiency, always). Code-switching behavior was measured using the Bilingual Switching Questionnaire (Rodriguez-Fornells et al., Reference Rodriguez-Fornells, Krämer, Lorenzo-Seva, Festman and Münte2012). Participants rated their code-switching behavior on a scale from 0 (never) to 5 (always) on the following constructs: switching direction (L2-to-L1 or L1-to-L2 switching to fill lexical gaps), contextual switching (language alternation in response to sociolinguistic cues), topical switching (switching on certain topics), and unintended switching (unawareness of language switching behavior). Both questionnaires were administered electronically using Qualtrics (2019). Individual average self-ratings were computed for each measure.
DATA ANALYSIS
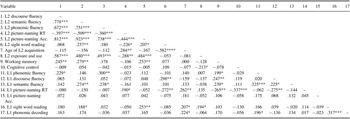
Analyses were implemented in R version 3.6.0 (R Development Core Team, 2016). Twenty-seven missing data points for the L2 phonemic fluency task and English sight word reading task (24% of the sample) and 20 missing data points on the Operation Span task (18% of the sample) were imputed using the Multivariate Imputation by Chained Equations R package (Van Buuren & Groothuis-Oudshoorn, Reference Van Buuren and Groothuis-Oudshoorn2010). Tables 1 and 2 provide descriptive statistics for each measure in the sample. Because the self-ratings of daily L2 exposure and daily L2 use tapped into the same underlying experience and were correlated with each other, a composite z-score was calculated (by adding z scores of the two variables) to obtain a stable measure of daily L2 exposure and use. Zero order correlations, presented in Table 3, suggested that L1 proficiency, age of L2 acquisition, L2 exposure, and use and working memory were related to L2 proficiency levels. We conducted multiple regression analyses to evaluate whether age of L2 acquisition, L2 exposure and use, working memory, cognitive control, L1–L2 distance (English-Spanish vs. English-Chinese), and learning context (classroom vs. immersion) explained variance in a variety of production measures of L2 proficiency after controlling for individual variation in L1-English proficiency. Entered first into the analyses, an aggregate score of English proficiency was computed by adding the z-scores of L1 discourse fluency, semantic fluency, phonemic fluency, picture-naming accuracy, sight word reading, and phonemic decoding measures.
Zero-order correlation matrix among variables examined

* p < .05; **p < .01; ***p < .001.
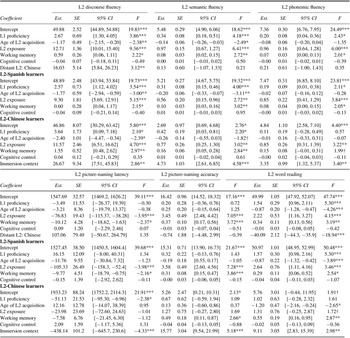
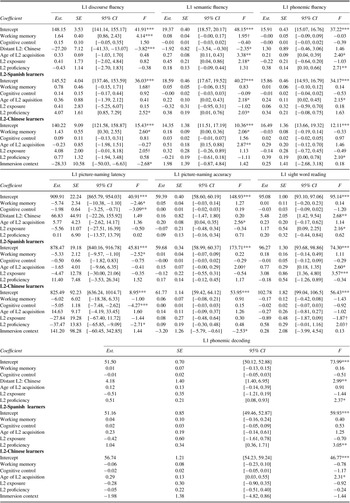
The correlations presented in Table 3 showed that age of L2 acquisition, L2 exposure and use, L2 proficiency, working memory, and cognitive control were also related to measures of L1 proficiency. We conducted multiple regression analyses to evaluate whether age of L2 acquisition, L2 exposure and use, L2 proficiency (an aggregate score of L2 proficiency was computed by adding the z-scores of L2 discourse fluency, semantic fluency, picture-naming accuracy, and sight word reading), L1–L2 distance, and learning context explained variance in a variety of production measures of L1 proficiency after controlling for individual differences in working memory and cognitive control. Continuous predictors were centered before being entered in the analysis. To prevent collinearity, when model predictors were correlated, regression residual scores (computed by regressing one variable out of the other) were used instead. Furthermore, because only L2-Chinese learners varied in learning context in our sample, context was evaluated as an additional predictor for this group. Analyses were conducted with aggregated and disaggregated L2 groups. Tables 4 and 5 present the regression models predicting measures of L2 and L1 proficiency, respectively.
Summary of regression results for six measures of L2 proficiency controlling for L1-English ability

† p < .1; * p < .05; **p < .01; ***p < .001.
Summary of regression results for seven measures of native language (L1) performance

RESULTS
L2 PROFICIENCY
We report results from six measures of L2 production. Th results demonstrate that both learner-external factors (age of L2 acquisition, L2 exposure and use, L1–L2 distance, L2 immersion) and learner-internal factors (L1 proficiency, working memory, but not cognitive control) accounted for variance in L2 proficiency.
L2 discourse fluency
L1 proficiency, age of L2 acquisition, L2 exposure and use, working memory, and L1–L2 distance contributed significantly to the model of L2 discourse fluency, together accounting for 62% of the variance, F(6, 98) = 28.82, p < 0.001. These predictors accounted for 53% of the variance in L2-Spanish learners, F(5, 65) = 16.77, p < 0.001 and for 70% of the variance in L2-Chinese learners, where L2 immersion explained additional variance, F(6, 27) = 13.79, p < 0.001. Overall, higher L1-English proficiency, younger age of L2 acquisition, more frequent L2 exposure and use, better working memory, and a structurally dissimilar L2-Chinese predicted higher L2 discourse fluency.
L2 semantic fluency
L1 proficiency, age of L2 acquisition, L2 exposure and use, and working memory contributed significantly to the model of L2 semantic fluency, together accounting for 45% of the variance, F(6, 101) = 15.61, p < 0.001. These predictors accounted for 49% of the variance in L2-Spanish learners, F(5, 65) = 14.55, p < 0.001; L1 proficiency, L2 exposure and use, working memory, and L2 immersion accounted for 67% of the variance in L2-Chinese learners, F(6, 27) = 12.27, p < 0.001. Overall, higher L1-English proficiency, younger age of L2 acquisition, more frequent L2 exposure and use, and better working memory predicted higher L2 semantic fluency.
L2 phonemic fluency
L1 proficiency, L2 exposure and use, and working memory contributed significantly to the model of L2 phonemic fluency, together accounting for 34% of the variance, F(6, 101) = 10.03, p < 0.001. These predictors accounted for 29% of the variance in L2-Spanish learners, F(5, 66) = 6.88, p < 0.001; L2 exposure and use, working memory, and L2 immersion accounted for 47% of the variance in L2-Chinese learners, F(6, 26) = 5.64, p < 0.001. Overall, higher L1-English proficiency, more frequent L2 exposure and use and better working memory predicted higher L2 phonemic fluency.
L2 picture-naming latency
L2 exposure and use and working memory contributed significantly to the model of L2 picture-naming speed, together accounting for 12% of the variance, F(6, 99) = 3.40, p = 0.004. These predictors accounted for 17% of the variance in L2-Spanish learners, F(5, 64) = 3.91, p = 0.004; L1 proficiency and L2 immersion accounted for 42% of variance in L2-Chinese learners, F(6, 27) = 4.99, p = 0.001. Overall, more frequent L2 exposure and use and better working memory predicted faster L2 picture-naming latencies.
L2 picture-naming accuracy
L2 exposure and use and working memory contributed significantly to the model of L2 picture-naming accuracy, together accounting for 38% of the variance, F(6, 100) = 11.98, p < 0.001. These predictors accounted for 54% of the variance in L2-Spanish learners, F(5, 65) = 17.37, p < 0.001; working memory and L2 immersion accounted for 56% of the variance in L2-Chinese learners, F(6, 29) = 8.41, p < 0.001. Overall, more frequent L2 exposure and use and better working memory predicted more accurate L2 picture naming.
L2 reading
L1 proficiency, age of L2 acquisition, L2 exposure and use, working memory, and L1–L2 distance contributed significantly to the model of L2 reading, together accounting for 86% of the variance, F(6, 101) = 107.5, p < 0.001. These predictors accounted for 55% of variance in L2-Spanish learners, F(5, 65) = 18.21, p < 0.001; age of L2 acquisition, working memory, and L2 immersion accounted for 47% of the variance in L2-Chinese learners, F(6, 26) = 5.79, p < 0.001. Overall, higher L1-English proficiency, younger age of L2 acquisition, more frequent L2 exposure and use, better working memory, and a structurally similar L2 predicted more accurate L2 word reading.
L1 PROFICIENCY
We report results from seven measures of L1 production. The results demonstrate that both learner-external factors (age of L2 acquisition, L2 exposure and use, L1–L2 distance, L2 immersion) and learner-internal factors (L2 proficiency, working memory, but not cognitive control) accounted for variance in L1 proficiency.
L1 discourse fluency
Working memory and L1–L2 distance contributed significantly to the model of L1 discourse fluency, together accounting for 25% of the variance, F(6, 98) = 6.69, p < 0.001. Working memory and L2 proficiency accounted for 15% of variance in L2-Spanish learners, F(5, 65) = 3.39, p = 0.009; working memory, L2 exposure and use, and L2 immersion accounted for 38% of the variance in L2-Chinese learners, F(6, 27) = 4.33, p = 0.003. Overall, higher working memory and a structurally similar L2 predicted higher L1 discourse fluency.
L1 semantic fluency
L1–L2 distance, age of L2 acquisition, and L2 exposure and use contributed significantly to the model of L1 semantic fluency, while working memory showed a trend toward significance, together accounting for 18% of the variance, F(6, 95) = 4.80, p < 0.001. Age of L2 acquisition and L2 proficiency accounted for 12% of variance in L2-Spanish learners, F(5, 68) = 3.05, p = 0.015; working memory and age of L2 acquisition accounted for 27% of variance in L2-Chinese learners, F(6, 27) = 3.08, p = 0.020. Overall, higher working memory, older age of L2 acquisition, more L2 use, and a structurally similar L2-Spanish predicted higher L1 semantic fluency.
L1 phonemic fluency
Age of L2 acquisition and L2 proficiency contributed significantly to the model of L1 phonemic fluency, accounting for 14% of the variance, F(6, 99) = 3.84, p = 0.002. The predictors did not significantly account for variance when L2-Spanish learners, F(5, 62) = 1.63, p = 0.17 and L2-Chinese learners, F(6, 21) = 2.05, p = 0.104 were considered separately. Overall, older age of L2 acquisition and higher L2 proficiency predicted better L1 phonemic fluency.
L1 picture-naming latency
Working memory and cognitive control contributed significantly to the model of L1 picture-naming speed, together accounting for 14% of the variance, F(6, 101) = 4.11, p < 0.001. When the two groups were considered separately, predictors did not significantly account for variance in L2-Spanish learners, F(5, 64) = 1.40, p = 0.24, but cognitive control and L2 proficiency accounted for 57% of the variance in L2-Chinese learners, F(6, 27) = 8.34, p < 0.001. Overall, better working memory and less efficient cognitive control predicted faster L1 picture-naming latencies.
L1 picture-naming accuracy
Age of L2 acquisition contributed significantly to the model of L1 picture-naming accuracy, accounting for 7% of the variance, F(6, 98) = 2.33, p = 0.038. When the two groups were considered separately, predictors did not significantly account for variance in L2-Spanish learners, F(5, 59) = 1.58, p = 0.18, but L2 immersion accounted for 19% of the variance in L2-Chinese learners, F(6, 27) = 2.31, p = 0.06, predicting less accurate L1 picture naming. Overall, older age of L2 acquisition predicted higher accuracy in L1-English picture naming.
L1 sight word reading
L1–L2 distance and L2 exposure and use contributed significantly to the model of L1 sight word reading, together accounting for 19% of the variance, F(6, 98) = 5.00, p < 0.001. When the two groups were considered separately, age of L2 acquisition and L2 exposure and use accounted for 15% of the variance in L2-Spanish learners, F(5, 65) = 3.48, p = 0.008, but none of the predictors significantly accounted for variance in L2-Chinese learners, F(6, 27) = 1.74, p = 0.15. Overall, higher L2 exposure and a structurally distant L2-Chinese predicted more accurate L1-English word reading.
L1 phonemic decoding
L1–L2 distance and L2 proficiency contributed significantly to the model of L1 phonemic decoding, together accounting for 14% of the variance, F(6, 98) = 3.77, p = 0.002. L2 proficiency accounted for 13% of the variance in L2-Spanish learners, F(5, 65) = 3.15, p = 0.013; age of L2 acquisition accounted for 21% of variance in L2-Chinese learners, F(6, 24) = 2.37, p = 0.06. Overall, higher L2 proficiency and a structurally distant L2-Chinese predicted more accurate L1-English phonemic decoding.
DISCUSSION
We evaluated external and internal sources of variation in L2 and L1 proficiency among college students. We found that more frequent L2 exposure predicted higher L2 and L1 proficiency, while earlier L2 exposure predicted higher L2 proficiency, but poorer L1 maintenance. L1–L2 distance limited crosslinguistic transfer of print-to-sound mappings. Critically, better working memory, but not cognitive control accounted for additional variance in L2 and L1 proficiency.
LEARNER-EXTERNAL VARIATION
Younger age of L2 acquisition, higher L2 exposure and use, and L2 immersion improved performance on all measures of L2 proficiency. These results are consistent with previous reports that early (Hartshorne et al., Reference Hartshorne, Tenenbaum and Pinker2018; Johnson & Newport, Reference Johnson and Newport1989) and frequent (Serrano et al., Reference Serrano, Llanes and Tragant2011; Sunderman & Kroll, Reference Sunderman and Kroll2009) L2 exposure leads to higher L2 proficiency outcomes by providing learners more opportunities to practice retrieving the L2 (Barcroft, Reference Barcroft2007; Kang et al., Reference Kang, Gollan and Pashler2013). Higher L2 exposure also predicted higher L1 semantic fluency and faster L1 word reading, consistent with the idea that L2 use may boost L1 activation (Higby et al., Reference Higby, Donnelly, Yoon and Obler2020) as a consequence of L1 mediation (Kroll & Stewart, Reference Kroll and Stewart1994). However, younger age of L2 acquisition and L2 immersion predicted lower L1 fluency and picture-naming accuracy. These results are consistent with previous reports that younger age of L2 acquisition is associated with poorer L1 maintenance (Bylund, Reference Bylund2009; Yeni-Komshian et al., Reference Yeni-Komshian, Flege and Liu2000) and that L2 immersion reduces L1 access (Botezatu et al., Reference Botezatu, Kroll, Trachsel and Guoin press; Linck et al., Reference Linck, Kroll and Sunderman2009). Learning a structurally distant L2 was associated with higher L2 discourse fluency, but lower L1 discourse and semantic fluency, which may be a consequence of the L2 context in which most L2-Chinese learners in our sample were immersed. L2 immersion boosts L2 activation while reducing L1 access (Botezatu et al., Reference Botezatu, Kroll, Trachsel and Guoin press; Linck et al., Reference Linck, Kroll and Sunderman2009). Moreover, having a structurally distant L2 predicted less accurate L2 word reading because native English learners of L2-Chinese could not rely on crosslinguistic transfer when reading a logographic script. However, having a structurally distant L2 predicted higher accuracy in L1 word and nonword reading because the difference in writing script between English and Chinese limited interference from L2 print-to-sound mappings (e.g., Botezatu et al., Reference Botezatu, Kroll, Trachsel and Guoin press).
LEARNER-INTERNAL VARIATION
L1-English proficiency accounted for variance in all measures of L2 proficiency, except picture naming. This suggests that on most tasks, learners transferred lexical knowledge and processing strategies from the L1 to facilitate L2 learning (Lemhöfer et al., Reference Lemhöfer, Spalek and Schriefers2008; Marian & Kaushanskaya, Reference Marian and Kaushanskaya2007). Crosslinguistic transfer may have been a less reliable strategy in the picture-naming task, which only included items with noncognate names (Gollan et al., Reference Gollan, Weissberger, Runnqvist, Montoya and Cera2012). Additionally, higher L2 proficiency predicted higher L1 proficiency, pointing to the bidirectional nature of an inherently dynamic language system (Kroll et al., Reference Kroll, Bobb and Hoshino2014, Reference Kroll, Dussias, Bice and Perrotti2015), where the L1 changes as it supports the acquisition of the L2 (e.g., Botezatu et al., Reference Botezatu, Kroll, Trachsel and Guoin press). The result that higher L2 proficiency facilitates L1 access is consistent with previous evidence from the lexical domain, where L2 vocabulary facilitates the speed of L1 word retrieval (Higby et al., Reference Higby, Donnelly, Yoon and Obler2020) and contributes to increasing the L1 vocabulary (Keuleers et al., Reference Keuleers, Stevens, Mandera and Brysbaert2015).
Working memory accounted for additional variance in all measures of L2 proficiency, regardless of L1–L2 distance, as well as in the discourse fluency, semantic fluency, and picture-naming measures of L1 proficiency. Higher working memory predicted better performance in both L2 and L1 proficiency measures, consistent with previous reports from the L2 literature (e.g., Kormos & Sáfár, Reference Kormos and Sáfár2008; Martin & Ellis, Reference Martin and Ellis2012; Sagarra, Reference Sagarra2017) and L1 literature (e.g., Daneman, Reference Daneman1991; Daneman & Carpenter, Reference Daneman and Carpenter1980; Just & Carpenter, Reference Just and Carpenter1992). Unlike previous reports (Grey et al., Reference Grey, Cox, Serafini and Sanz2015), the relationship was replicated in an L2 setting (within the L2-Chinese learner sample), suggesting that the effect may be modulated by L2 proficiency level, not the intensive nature of language exposure. Notably, working memory accounted for variance in more measures of L2 proficiency than in measures of L1 proficiency, suggesting that the strength of the relationship is more robust at lower levels of proficiency (e.g., Hummel, Reference Hummel2009; Serafini & Sanz, Reference Serafini and Sanz2016) and under explicit learning conditions (Tagarelli et al., Reference Tagarelli, Mota and Rebuschat2011).
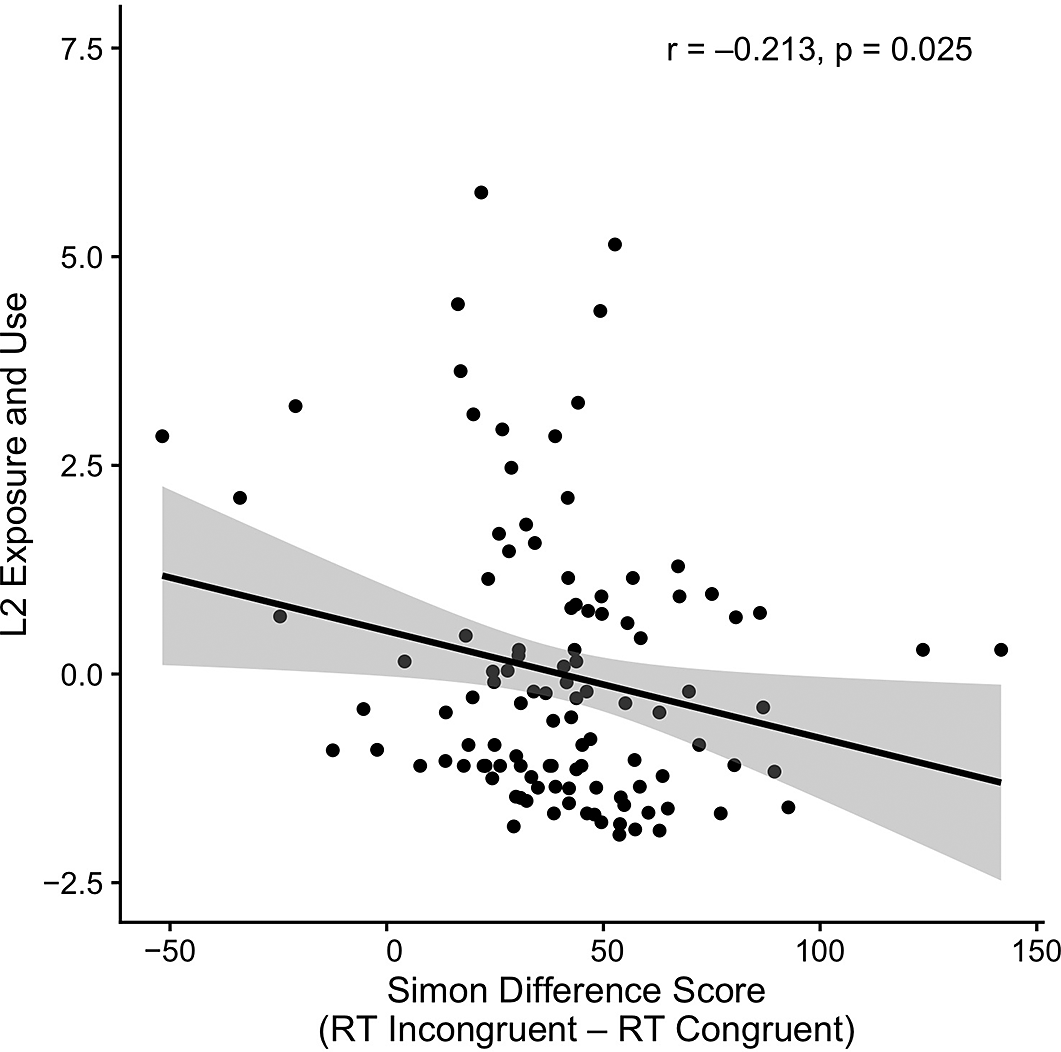
In contrast, cognitive control did not account for variance in any of the measures of L2 and L1 proficiency, with the exception of L1 picture-naming latency, where the effect was driven by the L2-Chinese group. The result that working memory, but not cognitive control, predicted most measures of L2 and L1 proficiency is consistent with previous reports of L2 outcomes following classroom instruction (Linck et al., Reference Linck, Hughes, Campbell, Silbert, Tare, Jackson and Doughty2013; Linck & Weiss, Reference Linck and Weiss2015). The replication of these results across a variety of L2 production measures suggest that good working memory may be a prerequisite to achieving high levels of L2 proficiency, while improvements in cognitive control may be an outcome of the practice of resolving competition from the irrelevant (native) language that is necessary when speaking the weaker L2 (Guo et al., Reference Guo, Liu, Misra and Kroll2011; Kroll et al., Reference Kroll, Bobb, Misra and Guo2008; Linck et al., Reference Linck, Kroll and Sunderman2009). The study provides some evidence in this direction, by showing that learners’ Simon difference scores were negatively correlated with self-ratings of daily L2 exposure and use, r = −0.213, p = 0.025 (see Figure 2). This negative correlation suggests that better cognitive control (i.e., smaller Simon difference scores) was associated with more frequent L2 exposure and use and is consistent with the idea that practice inhibiting the L1 to retrieve the weaker L2 may provide training in competition resolution (e.g., Kang et al., Reference Kang, Fu, Wu, Ma, Lu and Guo2017; Kapnoula & McMurray, Reference Kapnoula and McMurray2016).
Correlation scatterplot of L2 exposure and use self-ratings and Simon difference scores.

FUTURE DIRECTIONS AND PEDAGOGICAL IMPLICATIONS
The current findings have key implications for both research and practice. The result that Simon task performance did not predict most measures of L2 and L1 proficiency raises the question of whether this measure of cognitive control is sufficiently demanding to capture individual differences in young adults at the peak of their cognitive ability (Costa et al., Reference Costa, Hernández, Costa-Faidella and Sebastián-Gallés2009). The Simon task has provided equivocal results in previous research (Bartolotti et al., Reference Bartolotti, Marian, Schroeder and Shook2011; Linck et al., Reference Linck, Hughes, Campbell, Silbert, Tare, Jackson and Doughty2013; Linck & Weiss, Reference Linck and Weiss2015). Recent evidence suggests that more complex and cognitively demanding measures of control may be needed to capture individual differences in this domain for the relationship to emerge (e.g., Kapa & Colombo, Reference Kapa and Colombo2014; Paap & Greenberg, Reference Paap and Greenberg2013). In a recent study, Luque and Morgan-Short (Reference Luque and Morgan-Short2021) collected two independent measures of reactive control using the Flanker task (Eriksen & Eriksen, Reference Eriksen and Eriksen1974) and the Automated Continuous Performance Task (AX-CPT; Morales et al., Reference Morales, Gómez-Ariza and Bajo2013) and one measures of proactive control using the AX-CPT. The authors found that better reactive control (but not proactive control) was associated with higher L2 proficiency among adult intermediate classroom learners of L2-Spanish. Future studies should consider collecting multiple measures of cognitive control to evaluate which one best predicts L2 outcomes. In selecting the tasks, learners’ stage of L2 acquisition shoud be considered, as reactive control processes may be more engaged in early and intermediate stages of L2 learning, whereas proactive control processes may come into play at higher levels of L2 proficiency (Luque & Morgan-Short, Reference Luque and Morgan-Short2021). Future investigations should also consider whether L2 learners vary in their engagement of cognitive control during L2 production as a function of linguistic context, as it has been shown to be the case for highly proficient bilinguals (Beatty-Martínez et al., Reference Beatty-Martínez, Navarro-Torres, Dussias, Bajo, Guzzardo Tamargo and Kroll2020).
We report that more L2 exposure and use improves L2 fluency and may train cognitive control mechanisms. The pedagogical implication of these findings is that learners may benefit from opportunities for retrieval practice (Barcroft, Reference Barcroft2007; Kang et al., Reference Kang, Gollan and Pashler2013). Whether naming objects, describing pictures, telling stories, or engaging in conversation, more opportunities for L2 retrieval help learners link the L2 word form directly to the concept, gradually moving away from L1 mediation (Kroll & Stewart, Reference Kroll and Stewart1994). By engaging in retrieval practice (as opposed to repetition, see Kang et al., Reference Kang, Gollan and Pashler2013) and spacing the practice over time (Namaziandost et al., Reference Namaziandost, Sawalmeh and Soltanabadi2020), learners not only invest effort in strengthening the pathway to the L2 form, but also practice resolving competition from the L1, which may contribute not only to L2 fluency, but may also train domain-general control mechanisms. Additionally, retrieval practice may also include opportunities to engage in (dense) code-switching behavior, which has proven useful in training the cognitive mechanisms involved in language control (e.g., Hofweber et al., Reference Hofweber, Marinis and Treffers-Daller2016; Kang et al., Reference Kang, Fu, Wu, Ma, Lu and Guo2017).
CONCLUSIONS
In the current study, we provided converging evidence from several measures of language production that learner-external and learner-internal factors account for variance in L2 attainment and L1 maintenance. Future studies should consider interactions between extrinsic and intrinsic factors, as they jointly impact L2 and L1 proficiency.