


Introduction
Snow cover plays a major role in the climate of the Earth because of its specific radiative and thermal properties. Snow cover has the ability to evolve very rapidly under varying meteorological conditions. Metamorphism of snow crystals is the principal process responsible for this evolution, which is often very rapid and which may change the physical properties of the snow cover over more than one order of magnitude in a few days. Such changes strongly modify the energy and mass exchanges with the atmosphere.
Parameterizations of snow and specific models have been recently developed to take into account, in global circulation models (GCM), the particular role of snow on the Earth’s climate (Reference Douville, Royer and MahfoufDouville, 1995a,Reference Douville, Royer and Mahfoufb; Reference Loth, Graf and OberhuberLoth and others, 1993; Reference Lynch-StieglitzLynch-Stieglitz, 1994). Despite their sophistication, they do not include a realistic simulation of snow metamorphism, i.e. the change of snow crystals’ shape and size, which strongly influence snow albedo (Reference Wiscombe and WarrenWiscombe and Warren, 1980; Reference Sergent, Pougatch, Sudul and BourdellesSergent and others, 1993).
Instead of developing a new specific model designed for climate simulations) we have coupled the ARPEGE GCM with an existing multi-layered snow model designed for snow science and avalanche forecast. This snow model includes up to 50 snow layers, and takes into account most of the physical processes responsible for the evolution of a snowpack: metamorphism, internal melting and freezing, water percolation, heat conduction and compaction. However, the snow model was originally designed for open sites, and does not include any parameterization to describe the interaction between snow and vegetation. The coupling scheme is based on a synchronous run of the GCM and the snow model, with an exchange of the surface fluxes at every time-step. This is very similar to the schemes used to couple atmospheric models with oceanic models. The purpose of the present work was not to optimize the ratio between the quality and the cost of snow representation, but to show that it was possible to include in a GCM most of the physical processes governing snowpack evolution.
The paper describes the snow model and the coupling scheme. It briefly describes the impact on the climate during a five-year run at a T12 resolution, and focuses on the snowpacks simulated in various climate regions at non-vegetated sites.
The Snow Model (CROCUS)
Crocus is a numerical multilayered snow model that was developed for snow science and avalanche forecasting. Compared to other models dev eloped for snow science or hydrology (Reference ObledObled, 1971; Reference NavarreNavarre, 1975; Reference AndersonAnderson, 1976; Reference JordanJordan, 1991; Reference Bader and WeilenmannBader and Weilenmann, 1992; Reference Yamazaki, Kondo, Sakuraoka and NakamuraYamazaki and others, 1993), the originality of Crocus comes from its ability to simulate snowpack layering. By this, we mean that Crocus calculates the type and size of the ice crystals in each layer of the snowpack. Crystals are described through a specific formalism that may be connected to the international classification of snow (Reference ColbeckColbcek and others, 1990). The calculation of crystal changes is based on a set of parameterizations that describe the different types of snow metamorphisms: equi-temperature, medium- and high-temperature gradient and wet snow. The principal processes taken into account by the model include:
-
(1) Heat diffusion, using an effective thermal conductivity that includes the effect of water-vapour diffusion and depends on snow density.
-
(2) Percolation of liquid water with an irreducible water content depending on the pore volume.
-
(3) Internal melting and refreezing.
-
(4) Settling (considered to be a Newtonian viscosity-driven process, and its rate depends on temperature, density and on the type of the crystals of the different snow layers).
-
(5) Absorption of solar radiation at the surface and at depth using an albedo and a coefficient of absorption depending on the wavelength, the size and type of the crystals, and the age of the surface snow layer. Crocus has been developed (or open sites and hence, in this study, snow albedo docs not depend on land cover.
The model includes up to 50 snow layers. Their number and depth vary automatically at each time-step in order to pre-serve the layering. Fifty layers are used when the snowpack is deep, and includes layers with different characteristics. A detailed description of Crocus is available in (Reference Brun, Martin, Simon, Gendre and ColéouBrun and others 1989, Reference Brun, David, Sudul and Brunot1992).
Crocus has been checked in various contexts at local and regional spatial scales in such a way that it can be considered as one of the most validated of existing snow models. Local validation was performed during the winter season 1988-89 at Col de Porte (French Alps, 1320 m a.s.l.). where all input meteorological data were measured at an hourly time-step air temperature and humidity, wind velocity, incoming longwave and shortwave radiation, rain and snow precipitation). The model proved itself very able throughout the winter season to simulate snow depth, snow surface temperature, bottom-water runoff, internal temperature profile, density and liquid-water content and layering (Reference Brun, David, Sudul and BrunotBrun and others, 1992).
Validation at a regional scale was first carried out by running the model at 37 locations at elevations ranging from 900 m a.s.l. to 3000 m a.s.l. over a period of 10 years. The input meteorological data necessary to run the snow model were naturally not available at these locations, and were provided by a meteorological-analysis model called SAFRAN, which used all meteorological data available inside and around the French Alps Reference Durand, Brun, Mérindol, Guyomarc’h, Lesaffre and MartinDurand and others, 1993). The analysis was not conducted for each location, but for the different massifs regions that are about 1000 km2). Despite the uncertainty in the meteorological data induced by this method, the results of the model without specific calibration compared satisfactorily with snow-depth observations at most locations, except where snowdrift occurred very frequently Reference Martin, Burn and DurandMartin and others. 1994 and where the local meteorological conditions differed too much from the regional ones (i.e. at the bottom of deep valleys).
The second validation on a regional scale was carried out by coupling Crocus with the hydrological model ETH/HBV for an Alpine basin watershed covering an area of 224 km2 (Reference Braun, Brun, Durand, Martin and TourasseBraun and others, 1994). The bottom-water runoff at different elevations and different aspects of the watershed were simulated by using the meteorological analysis conducted by SAFRAN over the relevant massif. Regarding the relative area of the different classes of elevation and aspects, the daily bottom-water runoffs, calculated by SAFRAN and Crocus, were used by the hydrological model to calculate river discharge. A comparison between the daily observed and the simulated discharge over a 10 year period proved to be as satisfactory as the traditional version of ETH/HBV, which represents the evolution covering snow cover with a calibrated index method.
Coupling Scheme Between the Snow Model and the GCM
We have worked with a spectral GCM (ARPEGE), which is used for operational weather prediction as well as for climate simulations. ARPEGE has been jointly developed by the Groupe de Modélisation pour l’Assimilation et la Prévision (GMAP, Météo-France/CNRM) and by the European Centre for Medium-Range Weather Forecasting (ECMMWF) as “ARPEGE-IFS” (Reference Courtier and GeleynCourtier and Geleyn, 1988; Reference Déqué, Dreveton, Braun and CariolleDéqué and others, 1994). A limited-area version of this model is also available as “Aladin”.
Coupling scheme
ARPEGE calculates the energy and mass exchanges between the atmosphere and the continental surface according to the classical force—restore scheme proposed by Reference BhumralkarBhumralkar 1975) and Reference BlackadarBlackadar 1976). The surface is considered a unique layer, with a surface temperature T s and a deep temperature T d. This may be partially covered by snow. The aim of the coupling was to replace this layer with a soil layer partially covered by a multi-layered snowpack evolving according to the snow model (Crocus).
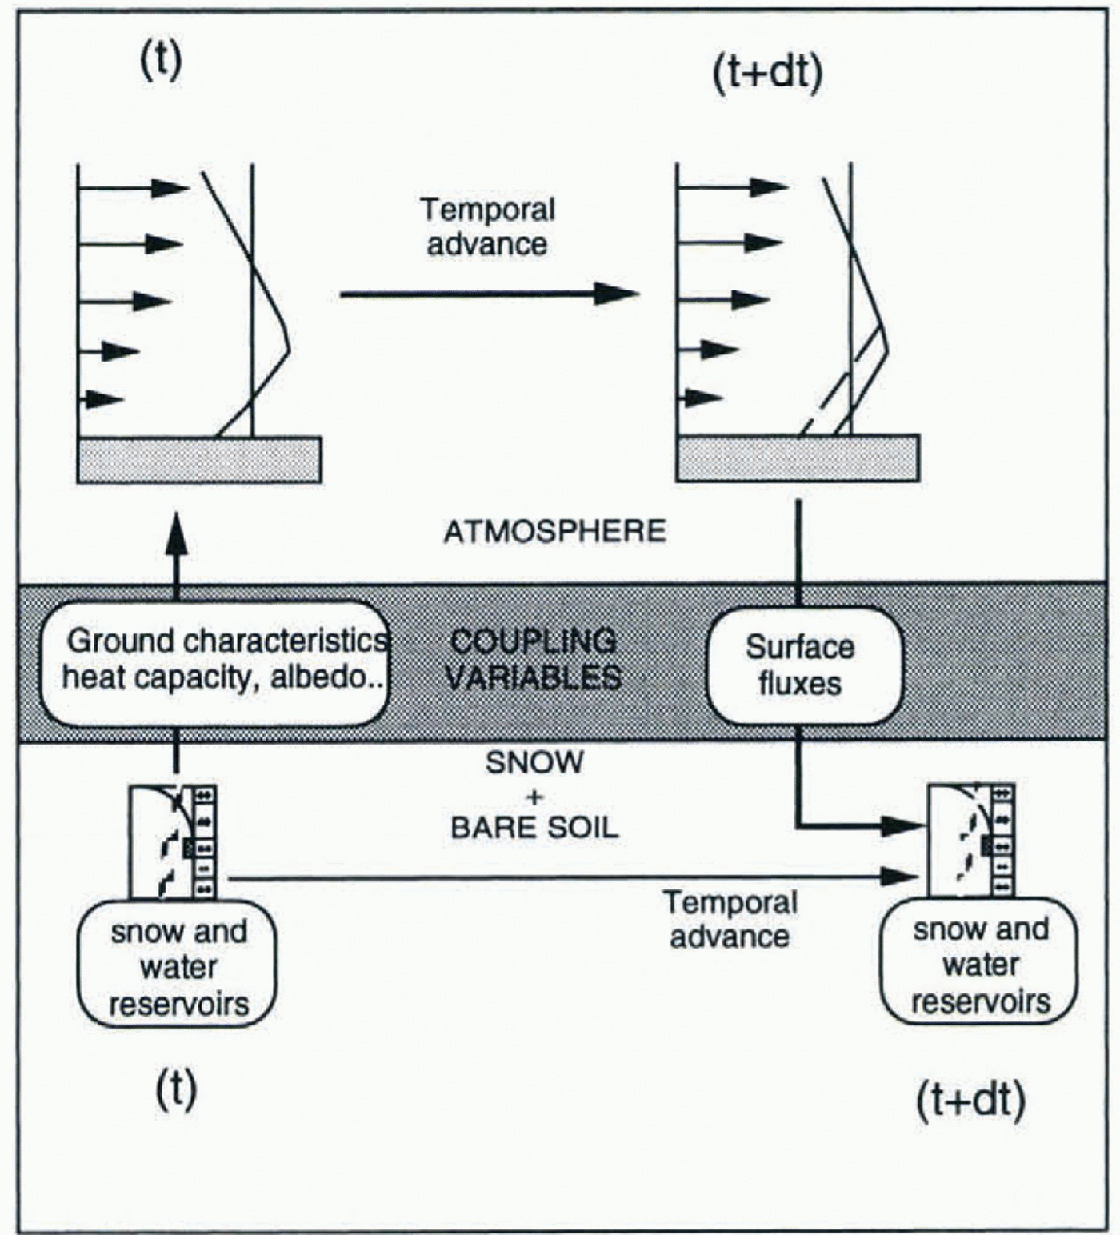
In the classical version of ARPEGE, the evolution during a time-step dt of temperature and humidity in the atmosphere and at the surface are calculated simultaneously through an implicit scheme. The relation linking Surface humidity to surface temperature is used to solve implicitly both equations describing the evolution of these variables. This scheme needs the inversion of a tridiagonal matrix, with terms depending on the temperature and humidity of the atmospheric layers and of the surface. It was impossible to integrate the calculation of snow-layer temperature into this scheme because of the melting–re-freezing process, which makes snow temperature depend on liquid-water content. Therefore. we have chosen to run the two models separately and synchronously. The basic incrementation of the evolution of the atmosphere, soil and the snowpack over a surface gridbox between the time t and the time t + dt includes four steps (Fig. 1):
-
(1) The physical characteristics of the surface heat capacity, thermal conductivity, roughness, albedo and deep temperature), which are used during a time-Step to calculate the energy exchanges in the atmospheric model, are deduced from soil characteristics and from the multi-layered snowpack characteristics simulated during the previous time-step.
-
(2) These characteristics are used by the atmospheric model to calculate the evolution of the temperature and humidity of the atmospheric profile and of the surface.
-
(3) The corresponding energy and water vapour fluxes exchanged between the surface atmospheric layer and the ground during the time t and the time t + dt are used to run the snow model in order to calculate the evolution of the different layers of the snowpack during the time t and the time t + dt.
-
(4) The amount of melting and liquid water runoff from the bottom of the snowpack and the energy flux exchanged between the snowpack and the underlying soil calculated by the snow model between the time t and the time t + dt are used by the atmospheric model to update the snow reservoir, soil temperature and wetness.
Schematic description of the scheme for coupling the GCM ARPEGE with the snow model Crocus.
This scheme is sufficiently similar to the numerical schemes used to couple atmospheric and ocean models, that it allows us to consider it as an actual coupling between a snow and an atmospheric model. It ensures a complete and free interaction between the two models with a minimum of change in each of them.
However, with snowpacks of up to 50 layers, it increases the running cost of the model by about a factor of two (memory and run time). This cost could be reduced by limiting the number of snow layers, but the aim of the present work was to represent most physical processes governing the evolution of snow cover, and this requires a realistic description of the layering.
No special parameterization has been developed to take into account the interaction between snow and vegetation. However, for a given snow mass, ARPEGE considers that the proportion of snow-covered area in a gridbox depends on the roughness of the surface in this gridbox. This means that the average physical properties (i.e. albedo) of a snow-covered gridbox strongly depend on vegetation.
Correction of the turbulent energy fluxes under very stable conditions
Minor changes have been necessary in the GCM and in the snow model. The first test run with the coupled models showed a very rapid surface temperature drop ranging between −20° and −30° over Antarctica. This was because the thermal conductivity of the ground now deduced from snow density was much smaller than the thermal conductivity considered in the classical version of the GCM. It decreased the energy supplied by the deep ground and naturally induced a drop of snow surface temperature in winter. It was unrealistieally amplified by a drastic drop in the turbulent exchanges due to an increase in atmospheric stability because ARPEGE calculates these fluxes using a parameterization (Reference LouisLouis, 1979; Reference Musson-GenonMusson-Genon, 1995) that is not satisfactorily designed for very large Richardson numbers. We solved the problem by limiting the Richardson number in the parameterization of the turbulent exchanges to a critical value of 0.5 (selected after several tests). This is a rather crude method, and should be improved in the future, but it highlights the importance of the parameterization of turbulent exchanges under stable conditions over snow-covcrcd areas.
compaction of snow by wind
The second problem arose from the systematic underestimation of fresh-snow density in the upper layers of polar snowpacks. Indeed, Crocus calculates a settling rate based on a Newtonian viscosity depending on the type, density and temperature of snow. Prevailing low surface temperatures limit settling due to the pressure of the upper layers. In Antarctica, snow-surface density is typically greater than 200 kg m −3 and often reaches 300 kg m−3, although Alpine fresh-snow density is typically 100 kg m−3 and much smaller when it falls at low temperatures and with a weak wind. The high density of Antarctic surface snow is mostly due to snowdrift. Therefore, we have developed a specific parameterization to simulate snowdrift and its effect on the evolution of snow grains and snow density. This is based on the model developed by Reference Guyomarc’h, Merindol, Castelle, Sivardière and BuissonGuyomarc’h and others (1994) from field measurements.
For each type of snow, we calculate a mobility index and a wind threshold above which snowdrift occurs. For example, the wind threshold of fresh snow (dendricity = 1) at a density of 50 kg m−3 = 2.8 m s−1. If, at a gridpoint, wind speed exceeds the threshold corresponding to the snow cover that is simulated at this gridpoint, we assume that snowdrift occurs, which induces an increase in snow density and a change of its crystals. Its efficiency is expressed as a function of the wind, and its effects on snow compaction and metamorphism decreases exponentially as a function of depth and the mobility of the upper layers. For example, at a depth of 10 cm under a fresh-snow layer, the efficiency of the drift is divided by e. Such a parameterization involves a rapid compaction of surface snow in cold regions with windy conditions. This compaction does not necessarily occur during the snowfall itself, but may occur several days or weeks later according to the evolution of the snowpack. An illustration of the effects of this parameterization is given in a later section describing the simulated snow packs.
Test of the Coupled Models
The coupling of Crocus with ARPEGE was first tested with the limited-area version of the model (Aladin). With a grid-mesh of about 15 km, the main point of this test was to verify that the proposed coupling scheme induced no numerical instability. The model was run from the end of December 1994 until the end of January 1995 over an area covering western and central Europe. No numerical instability was observed while the original time-step remained at 120 seconds. In this run, the use of Crocus to simulate the evolution of the snow cover suggested only small changes in atmospheric conditions, compared to the control run carried out with the operational version of Aladin that represented snow cover as a layer differing from the soil only by its albedo. The greatest differences concerned the extent of the simulated snow cover. The coupled version simulated some areas covered with very shallow snowpacks, while the operational version simulated no snow on these areas.
The main test was made by running the coupled models on a global scale for a five-year period at a T42 resolution with 31 vertical atmospheric levels. In this run, the evolution of sea-surface temperature and sea ice was imposed from monthly observed climatology (AMIP 1979–88). The present paper focuses on the quality of the simulated snowpacks and snow climatology, rather than on the impact of the coupling on atmospheric circulation.
The Simulated Snowpacks
As described previously, an original feature of Crocus comes from its simulation of snowpack layering. No global description comparing the internal characteristics of snowpacks from different geographical locations is available in the literature. Therefore, it is difficult to compare the simulated snowpacks with existing data. Thus, in the present research, we restrict ourselves to a description of the simulated evolution of snowpacks from different climatic regions, highlighting the ability of the coupled model to simulate very different snowpacks in connection with different climate conditions.
Figure 2 displays the evolution of four snowpacks located at the same latitude. The colour code corresponds to different snow types (Reference Brun, David, Sudul and BrunotBrun and others, 1992). Green represents dendritic snow types corresponding to recent snow; blue represents faceted crystals and depth hoar; and red represents rounded crystals (wet grains). The hachures show snow layers that have been previously wetted, and which are now refrozen (crusts).
Snowpacks simulated at four different gridpoints at a latitude of 62° N. Each figure displays the layering calculated by Crocus coupled with the GCM ARPEGE during the winter season corresponding to the third year of the run.
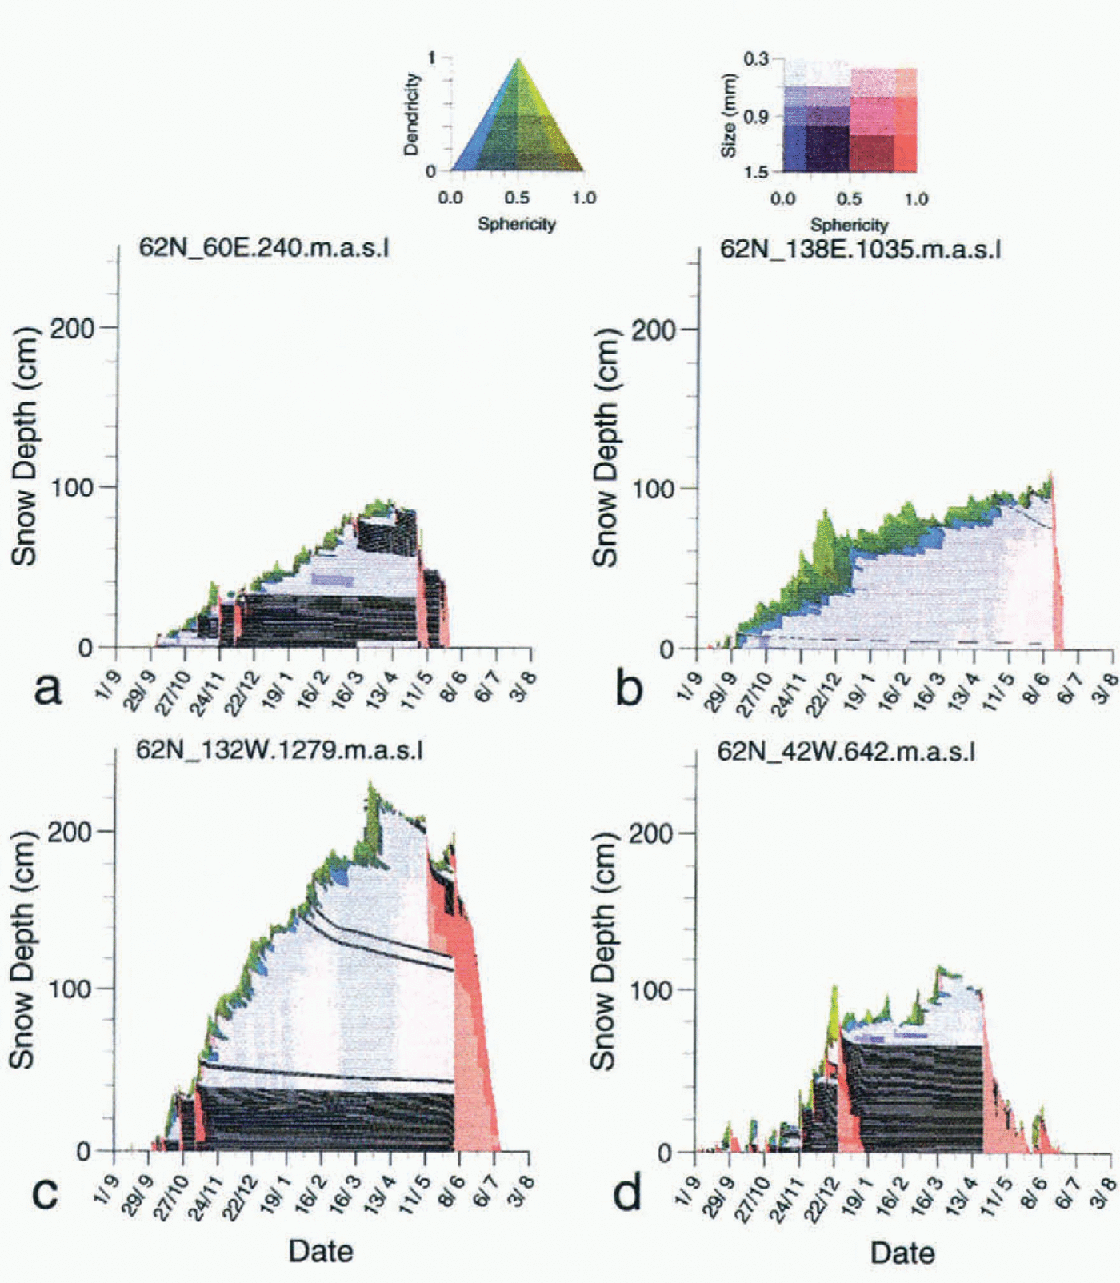
The first simulated snow cover is located in southwest Siberia at 62° N, 60° E (204 m a.s.l.). Permanent snow cover begins in October and suffers wetting events until December. Then, rare snowfalls and cold conditions allow it to dry with the formation of depth hoar until mid-March when a first temporary wetting affects the surface layer. A first complete wetting occurs in May and is followed by complete refreezing. Complete melting is very rapid at the end of May.
The third simulated snowpack is located in Alaska at 62° N, 132° W (1279 m a.s.l.). This snow cover is very different of the previous ones. Accumulation is important and begins in October and wetting occurs until the end of November. A dry snowpack, built up principally with fine snow grains, prevails until the middle of May. Complete melting lasts approximately two months. This region is notable for its deep and relatively dense snowpacks, which are well reproduced by the simulation.
The fourth simulated snowpack is located in southern Greenland at 62° N, 48°W (642 m a.s.l.). This snow cover is characterised by early snowfalls in September, which suffer wetting and sometimes complete melting until the end of December. This is due to the strong influence of the maritime storms that prevail in this region during fall. A dry and cold snowpack is simulated from January until the middle of April, followed by a long period of slow melting interrupted by new snow falls until the middle of June. We can observe the impact of a strong snowdrift event at the end of January, which has compacted about 30 cm of snow that had fallen during the previous month.
Although the snow packs described above are located at the same latitude, their characteristics differ strongly, showing the ability of Crocus coupled with ARPEGE to simulate very different snowpacks in relation to different climate conditions.
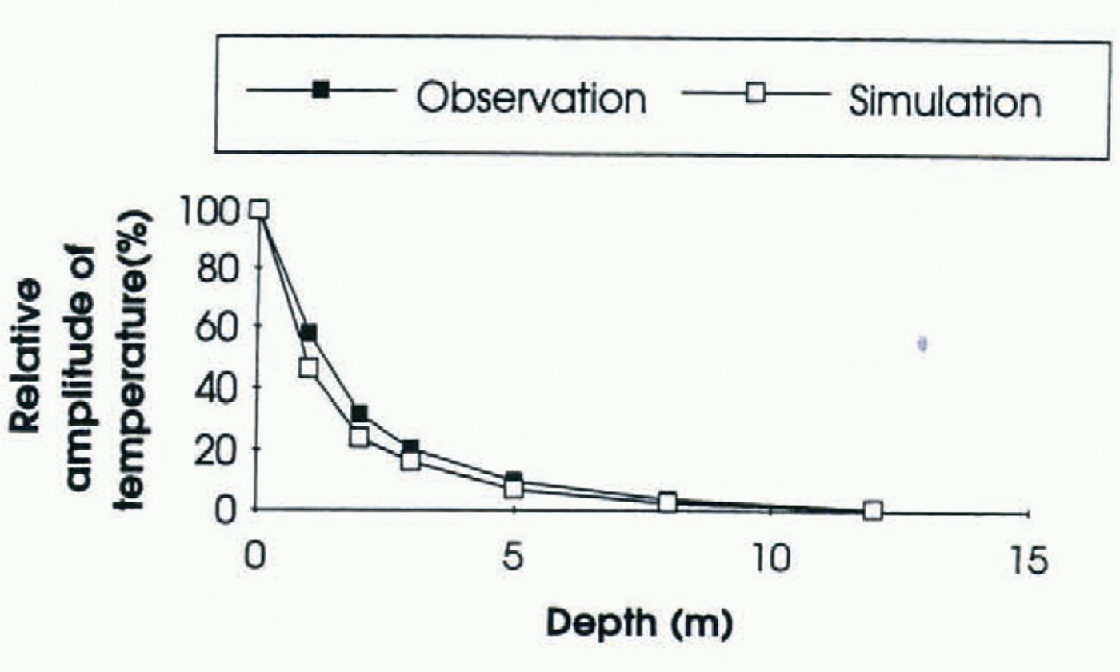
Crocus has the ability to simulate surface snow layers with very low density, which induces a low thermal conductivity and a low heat capacity. It decreases the heat flux from deep snow layers. To illustrate how realistically the coupled models simulate the temperature variation in deep snow, we have compared the simulated and observed attenuation of the annual amplitude of snow temperature with depth (Fig. 3). We used measurements taken at the South Pole in 1958 (Reference Dalrymple, Lettau, Wollaston and RubinDalrymple and others, 1966) and the simulated temperature profile over a five-year run at 88° S, 90° E, 3137 m a.s.l. which, in our simulation, is one of the closest points to the South Pole. The temperature at 10 m is nearly constant and very close to the average annual surface temperature (−52°C for the simulation and −51° C for observations). The slight underestimation of the amplitude of temperature waves in deep snow layers is due to an underestimation of snow-surface density despite the parameterization introduced to take into account compaction due to snowdrift (typically 270kg m−3, rather than 370 kg m−3 at the surface).
Comparison between the simulated and observed attenuation of the annual amplitude of snow temperature with depth at South Pole.
The duration of the snow cover in different regions is an important component of climate. Figure 4 compares the snow-cover duration (in April and May, June–September, October and November, and December March; simulated by the coupled models with the data calculated by Reference Groisman, Karl, Knight and StenchikovGroisman and others (1994). In most regions of the Northern Hemisphere, the model simulates a snow climatology very close to the observed one. The greatest differences occur at locations where the relief of the GCM at a truncature T42 differs significantly from the actual relief (i.e. the Alps and the Rocky Mountains in the southern part of the U.S.A.). In such cases, the difference between the elevation of the considered gridpoints and the actual elevation makes impossible the comparison between the simulated and the actual snow climatology.
Comparison between the snow climatology in the Northern Hemisphere calculated by Reference Groisman, Karl, Knight and StenchikovGroisman and others (1994) (left side) and simulated by Crocus coupled with the GCM ARPEGE (right side). Snow climatology is represented by the fraction of time with snow cover during four periods of the year. (a) for fall and winter.
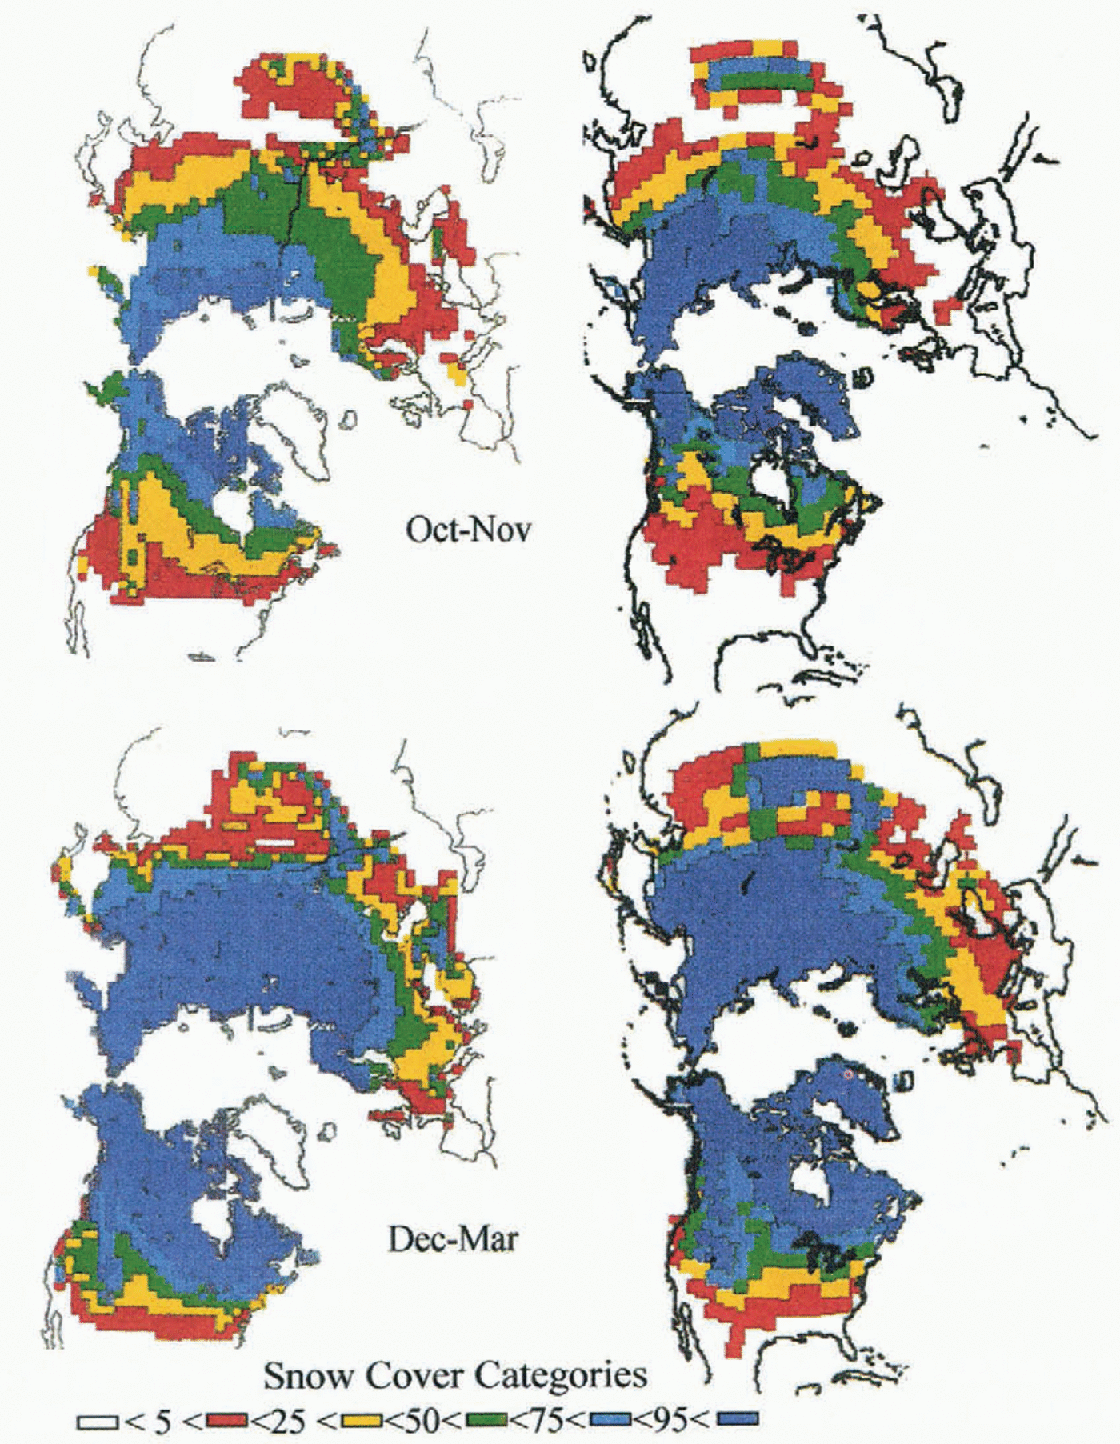
(b) for spring and summer

Impact on Climate
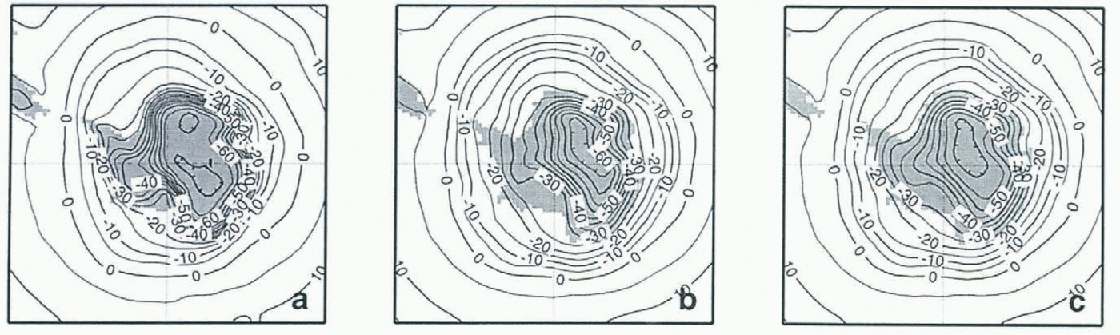
Simulating the evolution of snow cover with a sophisticated snow model, instead of a simple parameterization, during a climate run changes significantly the energy exchanges between this snow cover and the atmosphere. This is not only due to a change in snow albedo, but to a change in the thermal properties of the snow cover, reducing significantly the thermal conduction from the deep soil towards the atmosphere, especially in winter. Globally, the comparison with the reference run shows significant differences only-over snow-covered areas. This is illustrated in Figure 5, which compares the simulated and observed surface-air temperature over Antarctica in July. The simulation of surface temperature with the coupled models over the Antarctic plateau gives a value that is colder and more realistic than the one simulated with the reference run. Since this region is completely snow covered during both runs, and mostly in shadow in July, it highlights the important role played by snow thermal properties on the climate of polar regions that are probably as important as its radiative properties. Additionally, the mean annual albedo over the Antarctic plateau is higher with the coupled model (0.85) than with the reference run (0.80).
(a) Comparison between air temperature over Antarctica in July 2 m above the ground analysed by ECMWF (b) Simulated with the version of ARPEGE GCM coupled with Crocus, and (c) and simulated with the reference version of ARPEGE
In any case, since no special attention has been devoted to the interactions between snow and vegetation, no improvement has been made in the simulation of forested areas, which represent the largest snow-covered areas in the Northern Hemisphere.
Conclusion
The coupling of a GCM with a multi-layered snow model has simulated the evolution of snow cover during climate simulations. The snowpacks simulated in different geographical regions show realistic features, and the impact on snow climatology and the climate of snow-covered regions is important. The chosen coupling scheme insures a complete interaction between the snow cover and the atmosphere, but the large number of snow layers (up to 50 for deep and stratified snowpacks) significantly increases the cost of running climate models. Therefore, it is only practical for climate simulation focusing on cryosphere processes. We have shown that it is possible to simulate interactively the climate of polar regions while also simulating the internal temperature of firn. A realistic simulation of the thermal conductivity of multi-layered snowpacks may improve the simulation of permafrost. Naturally, this coupling also offers the potential to investigate the possible impact of climate change on snow cover while taking into account its feedbacks. The principal limit of the present development is that no specific parameterization has been introduced to simulate the evolution of snow cover in dense forests.
Acknowledgements
The authors are grateful to J. -F. Geleyn (Météo-France/GMAP) who provided us with valuable advice regarding the design of the coupling scheme. They are also grateful to M. Déqué and A. Braun (Météo-Francc/GMGEC) who helped run the climate version of ARPEGE, and to H. Giordani (Météo-France/GMGEC) who helped run the 1-D simulator of the ARPEGE physics package. The authors also wish to thank to E. Guilyardi, who provided the Vairmer graphical package used to draw Figure 5.



