Introduction
The scourge of food and nutrition insecurity remains a challenge worldwide, despite overall progress, with sub-Saharan Africa with the highest prevalence in the world (FAO et al., 2014). Sub-Saharan Africa has made insufficient progress toward international hunger targets, with more than one in four people remaining undernourished (FAO et al., 2014). Accordingly, the IFPRI (2015, p. 74) states: ‘The pace of poverty and hunger reduction has been too slow to prevent the absolute number of poor and hungry from rising, and, on average, Africa as a whole will not meet the first Millennium Development Goal of halving 1990 poverty and hunger rates by 2015’.
About 805 million people face challenges of not having enough calories, but about 2 billion face micronutrient deficiencies—referred to as hidden hunger (IFPRI, 2015). FAO et al. (2013, p. 50), defined food insecurity as, ‘a situation that exists when people lack secure access to sufficient amounts of safe and nutritious food for normal growth and development and an active and healthy life’. Malnutrition is defined as, ‘an abnormal physiological condition caused by inadequate, unbalanced or excessive consumption of macronutrients and/or micronutrients and includes undernutrition and overnutrition as well as micronutrient deficiencies’ (FAO et al., 2013). Women and children are at the helm of these challenges of food and nutrition insecurity. Approximately 23 million primary-school aged children in Africa attend classes hungry (WHO, 2012). Each year more than 3 million children under the age of five pass away, 45% of them due to poor nutrition (Black et al., Reference Black, Victora, Walker, Bhutta, Christian, Onis, Ezzati, Grantham-McGregor, Katz, Martorell and Uauy2013). Drinking water and toilet facilities are also cited as household risk factors affecting child malnutrition (Dinachandra et al., Reference Dinachandra, Alagarajan and Ladusingh2015).
There has been an influx of people in many cities in sub-Saharan Africa, with the urban population rising by 11.3% in 2010 and expected to rise by 20.2% in 2050 (UN-HABITAT, 2014). Increased urbanization has been associated with a decrease in biodiversity and loss of indigenous knowledge on production and utilization of indigenous species in urban areas (Alberti, Reference Alberti2008; McKinney, Reference McKinney2008; Sogbohossou et al., Reference Sogbohossou, Achigan-Dako, Komlan and Ahanchede2015). Several other studies have reported challenges related to the combination of fast-growing cities and food and nutrition insecurity (Hardoy et al., Reference Hardoy, Mitlin and Satterthwaite2001; UN, 2007, 2008; UNFPA, 2007; Naab et al., Reference Naab, Dinye and Kasanga2013). Many studies have recently reported evidence of growing urban poverty in African cities, with food and nutrition insecurity as indicators of urban poverty amongst other indicators (Maxwell et al., Reference Maxwell, Levin, Armar-Klemesu, Ruel, Morris and Ahiadeke2000; Ahmed et al., Reference Ahmed, Hill, Smith, Wiesmann and Frankenberger2007; Tawodzera et al., Reference Tawodzera, Zanamwe and Crush2007; Becquey et al., Reference Becquey, Martin-Prevel, Traissac, Dembele, Bambara and Delpeuch2010a ; Caesar et al., Reference Caesar, Crush and Hill2013; Mvula and Chiweza, Reference Mvula and Chiweza2013). These studies also pointed out the engagement of African urban dwellers in agricultural activities ranging from crop production to livestock keeping in an endeavor to address these challenges. Prain et al. (Reference Prain, Lee-Smith and Karanja2010, p. vii), stated that ‘urban agriculture is uniquely well positioned to respond to these challenges’. Urban agriculture has been argued to improve household dietary adequacy and diversity, with animal source foods reported to have high-quality nutrients which are more readily absorbed into the human body than lower-quality nutrients from other food and non-food sources (Zezza and Tasciotti, Reference Zezza and Tasciotti2010; Schönfeldt et al., Reference Schönfeldt, Pretorius and Hall2013). Nevertheless, the work of Badami and Ramankutty (Reference Badami and Ramankutty2015, p. 8) concluded that: ‘urban agriculture can only make a limited contribution in achieving urban food security in low-income countries’. Agriculture in sub-Saharan Africa, mostly in the Sahel region faces a number of challenges ranging from: erratic rains, poor soils and poor seeds (Kabore and Reij, Reference Kabore and Reij2004; Setimela et al., Reference Setimela, Monyo and Bänzinger2004; Ouedraogo et al., Reference Ouedraogo, Runge, Eisenberg, Barron and Sawadogo-Kaboré2014; Hummel, Reference Hummel2015; Rockström and Falkenmark, Reference Rockström and Falkenmark2015). Some of these challenges in the Sahel region lead to migration especially of young people as a survival strategy (Konseiga, Reference Konseiga2005; Ndao, Reference Ndao2008).
Urban and periurban agriculture is generally defined as the growing of plants and keeping of animals within and around cities. It includes horticulture, floriculture, forestry, aquaculture and livestock production as well as related activities like delivery of inputs and the processing and marketing of products (FAO, 1999; Mougeot, Reference Mougeot2000; Drescher, Reference Drescher2003). Although many dwellers in African cities are engaging in urban agriculture, this activity is often illegalized by city authorities. Prain et al. (Reference Prain, Lee-Smith and Karanja2010) highlighted that the confused statutes in Cameroon, Kenya and Uganda have marginalized urban agriculture. Bopda et al. (Reference Bopda, Brummett, Dury, Elong, Foto-Menbohan, Gockowski, Kana, Ngonthe, Notle, Soua, Tanawa, Tchouendjeu, Temple, Prain, Lee-Smith and Karanja2010, p. 6), emphasized the ambiguity of these regulations' confusion by saying, ‘urban agriculture has been playing hide-and-seek with urban management for a century’. As of 2002, urban agriculture employed nearly 45,000 people in Ouagadougou, Burkina Faso (Bagre et al., Reference Bagre, Kientga, Cisse and Tanner2002). Nevertheless, the legislation in Ouagadougou does not allow urban agricultural activities (Maire de Ouagadougou, 1997; Bagre et al., Reference Bagre, Kientga, Cisse and Tanner2002). About 36% of households in Ouagadougou are involved in urban farming, and urban agriculture sometimes provides nearly 50% of the food consumed by the urban poor in Ouagadougou (Argenti and Marocchino, Reference Argenti and Marocchino2005).
Many studies have been done in African cities on urban agriculture (Asomani-Boateng, Reference Asomani-Boateng2002; Weinberger and Msuya, Reference Weinberger and Msuya2004; Obuobie et al., Reference Obuobie, Keraita, Danso, Amoah, Cofie, Raschid-Sally and Drechsel2006; Voster et al., Reference Voster, van Rensburg, van Zijl and Sonja2007; Prain et al., Reference Prain, Lee-Smith and Karanja2010; Gyasi et al., Reference Gyasi, Kranjac-Berisavljevic, Fosu, Mensah, Gerald and Fuseini2014) and prevalence of food and nutrition insecurity (Tawodzera et al., Reference Tawodzera, Zanamwe and Crush2007; Becquey et al., Reference Becquey, Martin-Prevel, Traissac, Dembele, Bambara and Delpeuch2010a , Reference Becquey, Savy, Danel, Dabiré, Tapsoba and Martin-Prével b ; Daboné et al., Reference Daboné, Delisle and Receveur2011; Mvula and Chiweza, Reference Mvula and Chiweza2013). Nevertheless, little is known about the spatial variation of agriculture, food and nutrition insecurity and their relationship along the urban–rural continuum. We found that periurban areas had the highest relative proportion of food insecurity (household food insecurity access scale (HFIAS) > 11), stunting and wasting prevalence compared with urban and rural areas of Ouagadougou. Many studies have discussed the unique characteristics of periurban areas in terms of social configurations, political–administrative frameworks and natural resource endowment (Rakodi, Reference Rakodi1999; McGregor et al., Reference McGregor, Simon and Thompson2006; Schlesinger, Reference Schlesinger2013; Schlesinger et al., Reference Schlesinger, Drescher and Shackleton2015). Our results show that livestock and crop production contribute to household food and nutrition security (FNS) at different levels; for example, households doing livestock keeping significantly experienced less wasting (weight-for-height index (WHZ)) and overweight (body mass index (BMI)-for-age (BAZ)) compared with households not doing livestock keeping. Funch (Reference Funch2015, p. 10), emphasized the importance of agriculture, FNS in future development goals by saying: ‘How FNS and agriculture will feature in the new post-2015 development agenda is now crucial’. The urban–rural continuum approach enhances formulation of efficient urban sustainability policies as it is inclusive and addresses sustainability in areas large enough to encompass urban, periurban and rural areas unlike other approaches which focus on the dichotomy between urban and rural areas (Forster and Escudero, Reference Forster and Escudero2014). Information on spatial variation of household food and nutrition insecurity can be very useful in understanding its dynamics in various locations and help in resource allocation and proper intervention targeting (Maxwell et al., Reference Maxwell, Caldwell and Langworthy2008). The objective of this study was to determine the contribution of urban, periurban and rural agriculture along the urban–rural continuum in mitigating household food and nutrition insecurity. We tested the hypothesized relationship/association between growing crops, keeping livestock and food nutrition and insecurity using structural modeling. This paper takes a close look at agriculture activities (crop and livestock keeping) and how the related dynamics of food and nutrition insecurity vary along the urban–rural continuum in Ouagadougou, Burkina Faso. The study further uses causal and structural models to infer causality and structural relationships between livestock and crop production and attributes of food and nutrition insecurity.
Materials and Methods
Description of study area
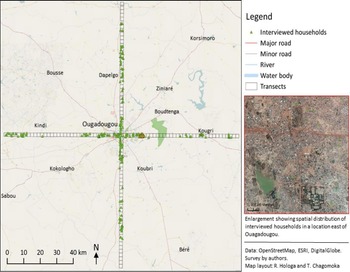
Agriculture is the major contributor to the economy of Burkina Faso and it employs more than 80% of the workforce (INSD, 2009). In 2005, Burkina Faso was ranked number 176 out of 177 countries on the United Nations Development Programme (UNDP) Human Development Index, with an average annual per capita income between 230 and 250 dollars compared with 500 dollars in sub-Saharan Africa (UNDP, 2007). Ouagadougou, the capital of Burkina Faso, is situated on the central plateau with an altitude of around 300 m above sea level (Fig. 1). It is also the country's largest city, with a population of approximately 1,400,000 according to the 2006 census (INSD, 2007). Ouagadougou falls under the Sudano-Sahelian climatic zone. Annual rainfall is around 800 mm, with the rainy season running from May to October. Heavy rains are usually experienced during the months of July and August (Ouédraogo et al., Reference Ouédraogo, Mando, Brussaard and Stroosnijder2007).
Study area location map.

Study design and sampling approach
A transect approach was used to guide data collection. Transects, 2 km wide and 70 km from Ouagadougou central market, were laid radially as shown in Fig. 2. A number of studies have used this approach to analyze vegetation, vegetable production and use of natural resources (Loewenstein and Loewenstein, Reference Loewenstein and Loewenstein2005; Schlesinger, Reference Schlesinger2013; Kamga et al., Reference Kamga, Kouamé, Tchindjang, Chagomoka and Drescher2013). However, the transect approach has not yet been used in studies measuring levels of food and nutrition insecurity in urban, periurban and rural areas in developing countries. The advantage of this approach is the probability of including households which can be excluded in most sampling approaches which follow the linear settling pattern of households along major development lines like main roads. Its disadvantage includes concentration along the transects only and not elsewhere.
Transect sampling.

The terms urban and periurban have faced various definitions and interpretations from one city to another, as there is no universally accepted definition (Iaquinta and Drescher, Reference Iaquinta and Drescher2000; Simon et al., Reference Simon, McGregor, Thompson, McGregor, Simon and Thompson2006). Moustier and Fall (Reference Moustier, Fall, Smith, Moustier, Mougeot and Fall2004) tried to show how this may differ with places by saying, ‘even what authorities in Sierra Leone call “urban” might qualify only as a small town in Nigeria’. Based on the relevant literature, working definitions of urban, periurban and rural areas were established (Adam, Reference Adam, Drechsel and Kunze2001; Moustier, Reference Moustier2001; Erenstein et al., Reference Erenstein, Moussa, Oswald and Keijzer2004; Moustier and Fall, Reference Moustier, Fall, Smith, Moustier, Mougeot and Fall2004; Drechsel et al., Reference Drechsel, Graefe, Sonou and Cofie2006; Simon et al., Reference Simon, McGregor, Thompson, McGregor, Simon and Thompson2006). Within 10 km of the city center was considered as urban areas, between 10 and 40 km as periurban areas and between 40 and 70 km as rural areas. The work of Iaquinta and Drescher (Reference Iaquinta and Drescher2000) strongly supported the identification of the periurban areas. All houses along the transects were digitized based on recent satellite imagery and randomly selected using Geographic Information Systems (GIS) (see Figure 2). The waypoints data were transferred to Global Positioning System, which helped in locating and identification of randomly selected households. Base maps of digitized and randomly selected houses were printed to help in locating and identification of survey households. Households which could not be located, either due to errors in the satellite images used or refusing to take part in the survey were systematically replaced by taking the next house to the east. The survey covered 32 districts (Districts 1, 2, 3, 4, 5, 8, 9, 10, 11, 12, Baskuy, Dapelgo, Dawelge, Doulougou, Ipelce, Kindi, Kombissiri, Komsilga, Mogtedo, Nagreongo, Nandiala, Nongremassom, Ourgou-Manega, Paabre, Roulougou, Saaba, Sapone, Sourgoubila, Tanghindassouri, Zam, Ziniare and Zorgho) in and around Ouagadougou. Data collection was done between August and September 2014 by the first author with the assistance of translator. Household face-to-face interviews were conducted targeting the household head or the person in the household most involved in food preparation, women of reproductive age (15–49 yr) and the youngest child of those under 5 yr. Household in this study refers to those that sleep under the same roof and take meals together at least 4 days a week. This is the period immediately following the rain season and most farmers were weeding their crops. During this time food supplies are low in most households (lean season). The advantage of collecting data during this time of the season is the ability to have a clear picture of household food security situation during the lean season especially when using the HFIAS (Coates et al., Reference Coates, Swindale and Bilinsky2007). Its disadvantage is that the results may not reflect the food security situation during the peak season when households are harvesting their crops and have access to diverse food.
Crop production and livestock keeping
Activities related to crop production and livestock keeping were collected using a pre-tested semi-structured questionnaire. Data on both dry and wet season crop production were collected using the recall method, for data on the previous season.
Household food insecurity
A standardized HFIAS, based on the responses of 18 questions over the past 4 weeks about behaviors and attitudes that relate to various aspects of the food insecurity experience was used to assess household food insecurity (Coates et al., Reference Coates, Swindale and Bilinsky2007). HFIAS ranges from 0 to 27 and the lower the HFIAS the better the household food security and access situation. Based on the distribution in the sample, households were divided into two groups: with a HFIAS of ≤11 as food secure and a HFIAS of >11 as food insecure (FAO, 2011).
Household nutrition insecurity
Women's Dietary Diversity Score (WDDS) developed by FAO (2011) and anthropometric indices for children under 5 yr were used to assess household nutrition insecurity. WDDS and anthropometric indices for children under 5 yr, such as WHZ, are a good proxy of household nutrient adequacy and nutrition security (FAO, 2011; FANTA, 2011). WDDS is based on nine food groups consumed in the past 24 h and an increase in the number of food groups or WDDS is related to increase in nutritional adequacy of the diet. Based on the distribution of WDDS in the sample, households were classified into three groups; ≤3 food groups as lowest dietary diversity, four to five food groups as medium dietary diversity and ≥6 highest dietary diversity.
Anthropometric measurements were collected, guided by the work of Cogill (Reference Cogill2003). Weight was measured using a SECA floor electronic scale (model 881 U) and height and length were measured using an infantometer (light portable wooden board with a graduated tape measure). Nutrition indices such as height-for-age (HAZ), weight-for-age (WAZ), WHZ and BAZ were computed in WHO Anthro Version3.2.2 and used to interpret stunting, wasting and underweight, respectively, among children based on WHO Child Growth Standards (WHO, 2006, 2010a ).
Stunting (HAZ < −2 z-score)—inadequate length or height relative to age (reflects chronic malnutrition) and usually due to long-term nutritional deprivation (WHO, 2010b ; FANTA, 2011). Wasting (WHZ < −2 z-score)—inadequate weight relative to length or height (reflects acute malnutrition) usually due to insufficient food intake or a high incidence of infectious diseases such as diarrhea (WHO, 2010b ; FANTA, 2011). Underweight (WAZ < −2 z-score)—inadequate weight relative to age (reflects both chronic malnutrition and acute malnutrition) (WHO, 2010b ; FANTA, 2011). Overweight (BAZ > +2 z-score)—Excessive fat accumulation that presents a risk to health, childhood obesity is associated with a higher probability of obesity in adulthood (WHO, 2010b ; FANTA, 2011).
Data management and analysis
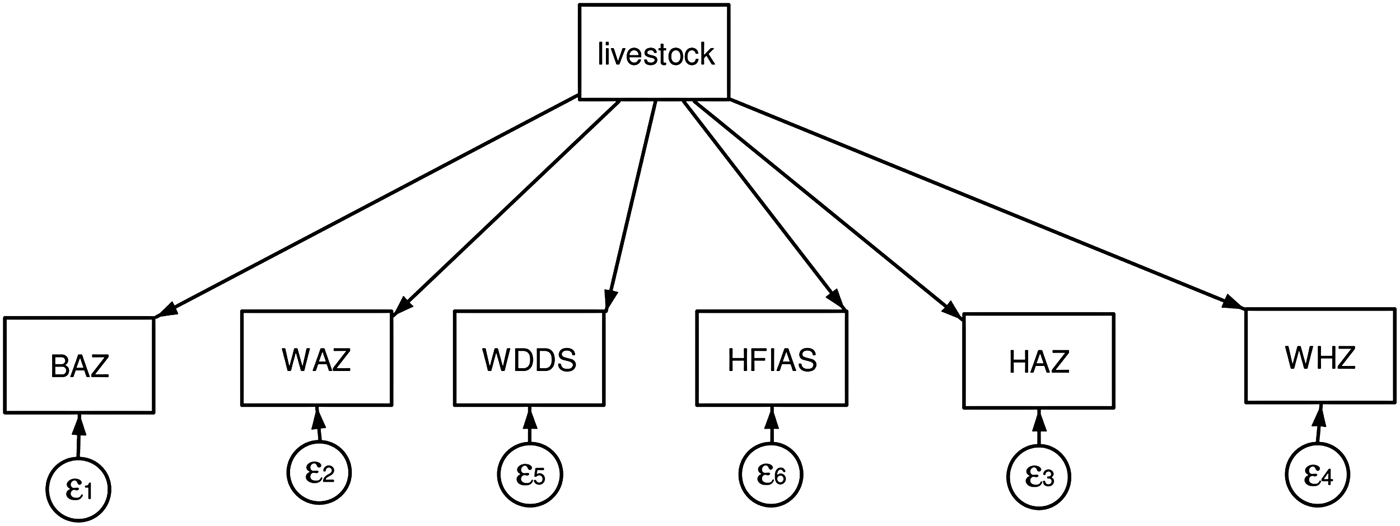
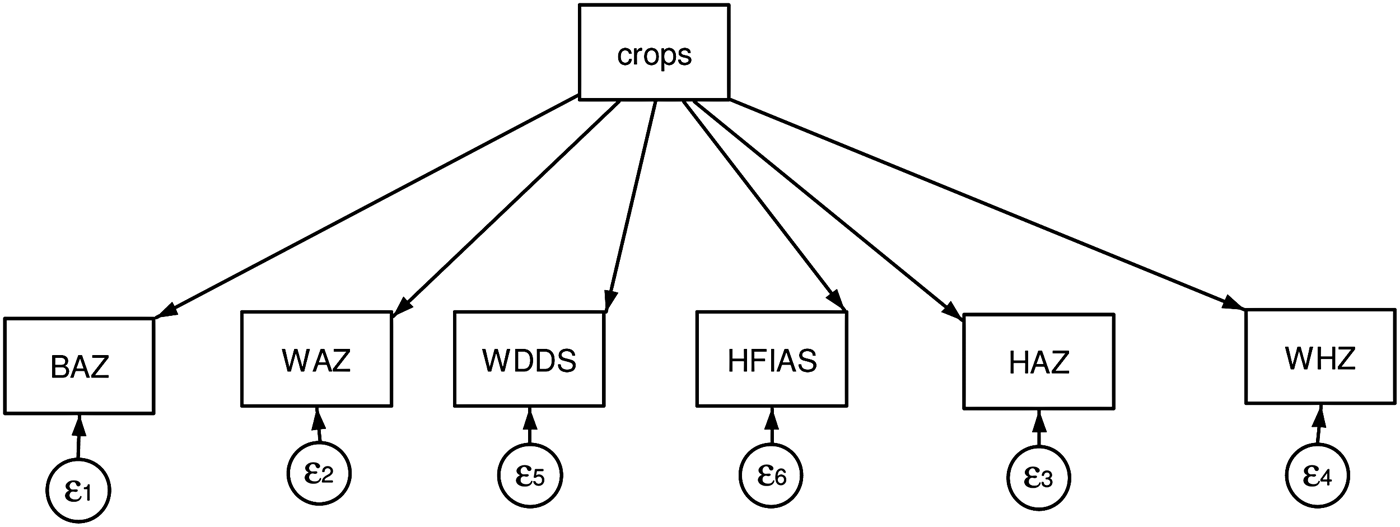
Data entry was done in Epidata 9 and exported to Stata 12 software for cleaning and analysis. The analysis focused on testing associations between categorical variables and confirming hypothesized networks of relationships based on theory through confirmatory analysis and fitting a final structural model. The two chi-square tests were used; the Pearson chi-square, where expected frequency were more than a value of 5 in each cell and the Fisher's exact test, where at least one expected cell frequency had less than a value of 5. Categorical variables associations such as nutritional status versus geographical location along the urban–rural continuum were determined. Confirmatory analysis was done separately for each construct before fitting the final structural model to show the possible effects of livestock keeping and crop production to food and nutrition insecurity. The relationships tested are shown in Figs 3 and 4. The z-scores for anthropometric data of children of 0–59 months were calculated in WHO Anthro Version.3.2.2 and then merged with other variables before analysis in Stata software. GIS was used for random selection of households and compilation of maps.
Structural model showing the contribution of livestock keeping to food insecurity (HFIAS) and nutrition status (WDDS, WHZ, HAZ, WAZ and BAZ) across the urban–rural continuum.

Structural model showing the contribution of crop production to food insecurity (HFIAS) and nutrition insecurity (WDDS, WHZ, HAZ, WAZ and BAZ) across the urban–rural continuum.

Ethical considerations
Study objectives and purpose were communicated to the community leaders and household heads. Permission was sought before data collection from local leaders and respondents. Respondents had the opportunity to stop participating in the research at any time during the interviews. None of the participants opted to stop.
Results
The first section of the results gives a brief background of the demographic profile of the respondents in this study. In the second section, urban, periurban and rural agricultural activities in the study area (livestock keeping, wet and dry season crop production) along the continuum are highlighted. The subsistence nature of crop production, looking at the proportion of the produce consumed versus marketed at household level, is presented in the third section. The fourth section presents various food and nutrition indicators along the urban–rural continuum. The last section of the results highlights the relationship of crop production and livestock keeping on household food and nutrition insecurity.
Socio-demographic profile of study sample
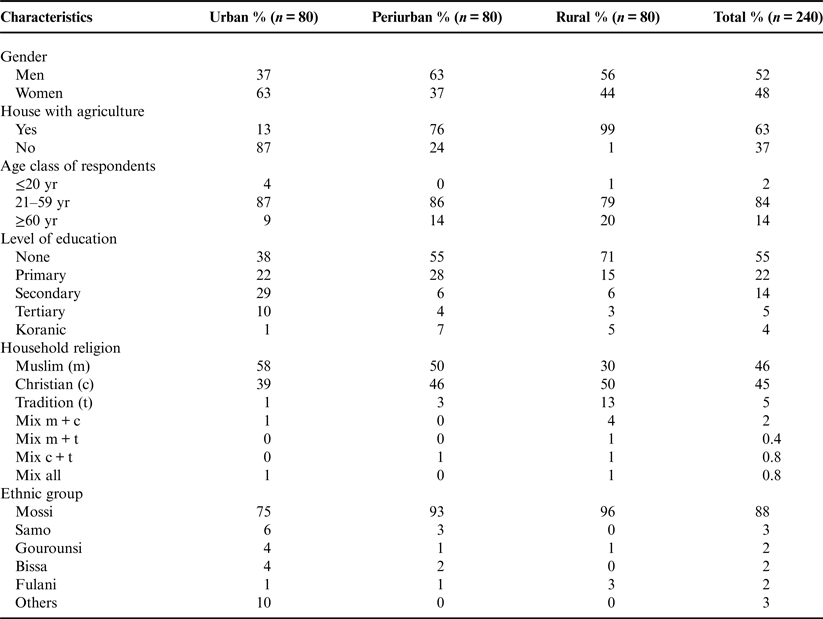
Study respondents consisted of 52% men and 48% women (Table 1). The majority of the respondents was aged between 21 and 59 yr (84%) and had not attended school (55%). Muslim (46%) and Christians (45%) constituted the majority of the survey sample. The Mossi ethnic group (88%) was the majority.
Demographic characteristics of respondents.

Urban, periurban and rural agriculture along the continuum
The most commonly grown crops during the wet season along the urban–rural continuum were: sorghum (Sorghum bicolor), maize (Zea mays), pearl millet (Pennisetum glaucum), okra (Abelmoschus esculentus), roselle (Hibiscus sabdariffa), groundnuts (Arachis hypogaea), roundnuts (Vigna subterranea), cowpea (Vigna unguiculata) and sesame (Sesamum indicum) (Fig. 5). There was no statistically significant association between crops grown during the wet season and the geographical location (chi-square value (d.f. = 38) = 37.94, P = 0.472) (Fig. 5). The majority of crop production took place in periurban and rural areas during the wet and dry seasons compared with urban areas (Figs 5 and 6). About 54% of farmers in the study area used farmer-saved seeds (Table 2).
Wet season crop production along the urban–rural continuum (n = 80 households per area—urban, periurban and rural).

Sources of seeds for crop production.

Tomato (Solanum lycopersicum), onion (Allium cepa), cucumber (Cucumis sativus), eggplant (Solanum macrocarpon), hot pepper (Capsicum spp.), green pepper (Capsicum spp.) and cabbage (Brassica oleracea) were the most grown crops during the dry season along the urban–rural continuum (Fig. 6). Most of the dry season production of crops such as tomato, onion and eggplant took place in the periurban and rural areas. There was statistically significant association between crops grown during the dry season and the geographical location (chi-square value (d.f. = 18) = 82.43, P < 0.001) (Fig. 6).
Dry season crop production along the urban–rural continuum (n = 80 households per area–urban, periurban and rural).

Livestock keeping activities were more present in periurban and rural areas, compared with urban areas, with more households in rural areas keeping livestock compared with other locations (Fig. 7). Goats, donkeys, chicken, sheep and cattle were the most kept livestock. Pigs were the least kept livestock along the continuum, mostly in urban areas compared with periurban and rural areas. Nevertheless, there was no statistically significant association between livestock kept and the geographical location (Pearson chi-square (d.f. = 12) = 19.99, P = 0.067) (Fig. 7).
Livestock keeping along the urban–rural continuum (n = 80 households per area–urban, periurban and rural).

Production and marketing of crops along the urban–periurban continuum
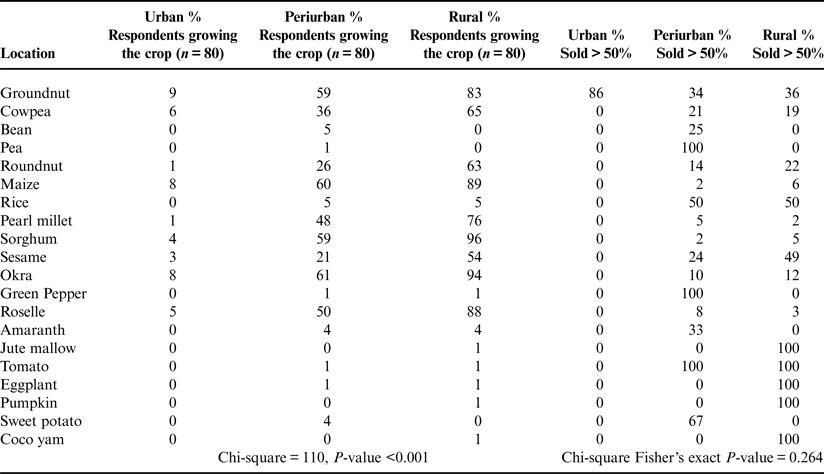
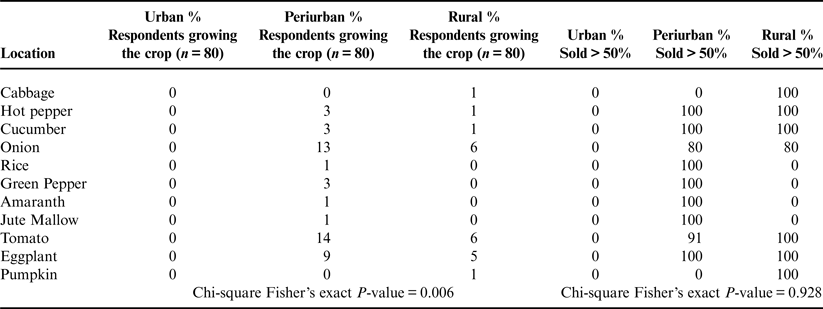
The results in Tables 3 and 4, demonstrate the subsistence nature and income generation of agriculture along the urban–rural continuum during the wet and dry seasons. The results of this study show a general picture of crop production which is more inclined to subsistence during the wet season (Table 3) and income generation during the dry season (Table 4). Most crops grown by urban households during the wet season were mainly for subsistence purposes. Maize, pearl millet and sorghum were mainly grown to feed the households with few households selling them during the wet season production. Crops which are not sold at household level are used to feed the family and the income generated from the crops sold is used to buy non-agriculture food such as salt, cooking oil, sugar and meet other household financial needs.
Wet season crop production and marketing along the urban–rural continuum.

Notes to Table 3: Sold > 50% represents the percentage of respondents growing the crop and selling >50%.
Dry season crop production and marketing along the urban–rural continuum.

Notes to Table 4: Sold > 50% represents the percentage of respondents growing the crop and selling >50%.
Various food and nutrition indicators along the urban–rural continuum
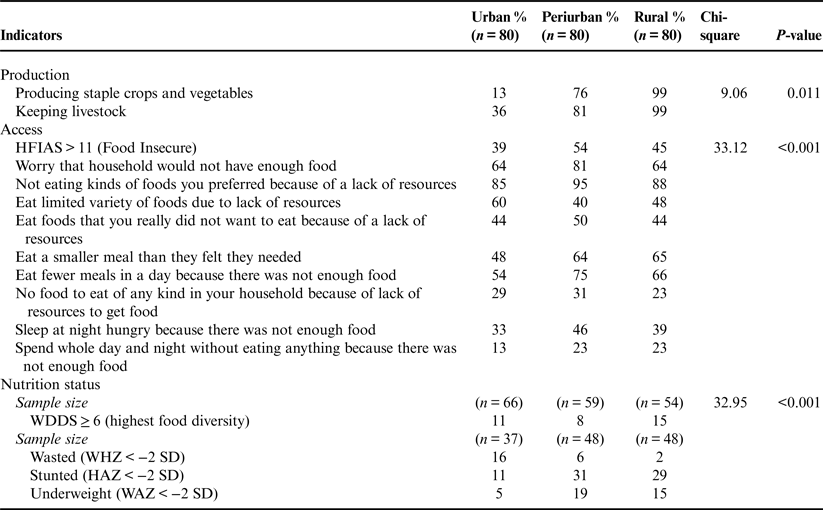
The results of this study show that households in periurban areas had the highest relative proportion of food insecurity (54%) (HFIAS > 11), compared with urban areas (39%) and rural areas (45%) (Table 5). Stunting (31%) and underweight (19%) individuals were also common in periurban areas than in urban (11 and 5%, respectively) and rural areas (29 and 15%, respectively). Households in rural areas (15%) had the highest relative proportion of dietary diversity (WDDS ≥ 6), compared with urban areas (11%) and periurban areas (8%). There was statistically significant association between access indicators and geographical location (chi-square value 33.12, P = <0.001) (Table 5). There was also statistically significant association between nutrition status indicators and geographical location (chi-square value 32.95, P = <0.001) (Table 5).
Various food and nutrition indicators along urban–rural continuum areas.

Periurban households also had the highest prevalence of the following food access indicators: worry that household would not have enough food, eat fewer meals in a day because there was not enough food, and sleep hungry at night because there was not enough food (Table 5).
Attributes of livestock production to indicators of nutrition and food insecurity
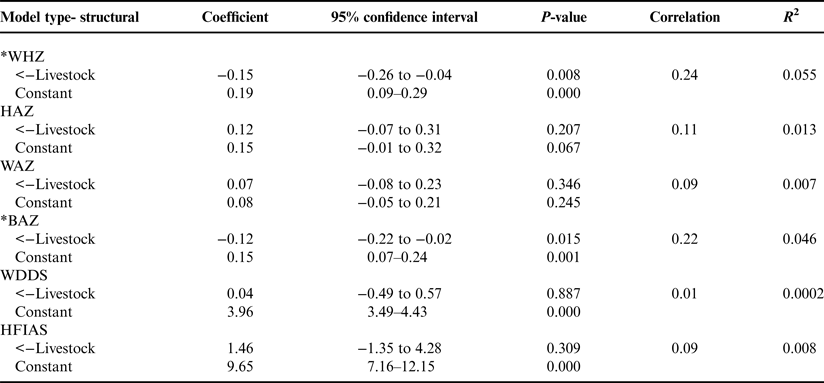
Households doing livestock keeping significantly experienced less wasting (WHZ) (coef. = −0.15; P = 0.008) by a factor of 0.15, and BAZ (coef. = −0.12; P = 0.015) by a factor of 0.12 compared with households not doing livestock keeping (Table 6). However, there were weak correlations between WHZ and keeping livestock (corr. = 0.24) and between BAZ and keeping livestock (corr. = 0.22). The linear model explains a very low percentage of the variation WHZ (R 2 = 5.5%), BAZ (R 2 = 4.6%) in the data, so there is a need to further explore nonlinear models. There was no statistical significance (P-value > 0.05) for other indicators (HAZ, WAZ, WDDS and HFIAS).
Univariate analysis of livestock keeping attributes to indicators of food and nutrition insecurity.

*Statistically significant at 95% level of confidence.
Attributes of crop production to indicators of nutrition and food insecurity
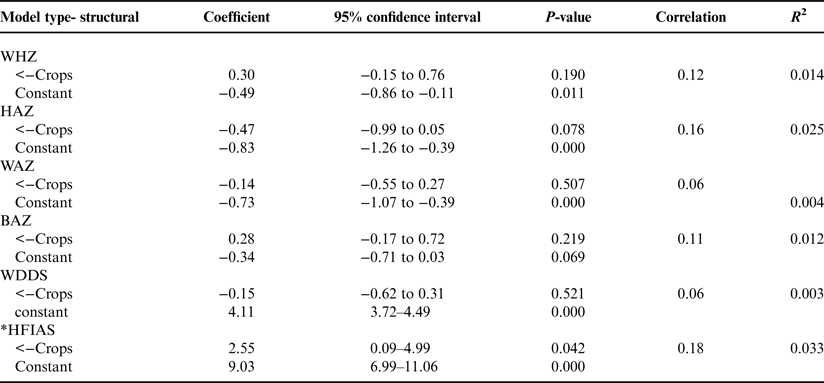
Households involved in crop production significantly experienced more food insecurity HFIAS (coef. = 2.55; P = 0.042) by a factor of 2.55 compared with households without crop production (Table 7). However, there were weak correlations between HFIAS and crop production (corr. = 0. 18). The linear model explains very low percentage of the variation HFIAS (R 2 = 3.3%) in the data, so there is a need to further explore nonlinear models. There was no statistical significance (P-value > 0.05) for other indicators (WHZ, HAZ, WAZ, BAZ and WDDS).
Univariate analysis of crop production attributes to indicators of food and nutrition insecurity.

*Statistically significant at 95% confidence level.
Discussion
This study reveals some relationships and association between crop production and livestock keeping with various food and nutrition indicators. The significance of these various associations varies from one indicator to another.
Urban, periurban and rural agriculture along the urban–rural continuum
Study results show that most agricultural activities, both crop production and livestock keeping took place in periurban and rural areas (Figs 5–7). More urban households engaged in livestock keeping compared with crop production, with chickens, donkeys, goat and sheep being the most commonly kept livestock. One of the reasons urban households opt for livestock keeping versus crop production is large space requirement for most crop production activities compared with livestock pens or corrals. Limited engagement of urban households in agriculture was expected and can be explained by the prevailing statutes by the city of Ouagadougou, which does not allow agricultural activities (Maire de Ouagadougou, 1997; Bagre et al., Reference Bagre, Kientga, Cisse and Tanner2002).
Wet season production was mainly for subsistence while the majority of dry season production was for income generation (Tables 3 and 4). It was observed that during the dry season household heads or young to middle aged boys move from their villages to distant villages where there was water to do dry season farming (rural–rural migration). Interviews revealed that often these household heads and boys stay in the dry season production sites until they harvest and market the crop. Crops produced during the dry season included tomatoes which were marketed as far as Ghana through farm gate sales (buyers coming from Ghana to purchase the produce at production sites). Income generated from dry season production was used to buy food not produced by farmers (such as sugar, cooking and salt) and to meet other household financial needs such as paying school fees. Konseiga (Reference Konseiga2005) discussed another similar form of household regional migration in Burkina Faso and attributed it to a survival strategy in a region confronted with severe scarcity of natural resources. Ndao (Reference Ndao2008), attributed the cause of rural–rural migration amongst young people in West Africa to a lack of access to land, poor soil fertility which limits their income from farming and the unavailability of non-farming employment.
Food and nutrition security along the urban–rural continuum
More households in periurban areas were food insecure (HFIAS > 11), compared with urban and rural areas (Table 5). More problems of stunting and underweight individuals were also observed in periurban areas than in urban and rural areas. Daboné et al. (Reference Daboné, Delisle and Receveur2011, p. 1), also reported that, ‘thinness and stunting were significantly higher in periurban compared with urban schools’. We also observed a number of mud houses constructed around the urban Ouagadougou (periurban), mostly occupied by households either from the urban Ouagadougou or rural areas. Households were building low-cost mud houses as they could not afford modern brick and mortar houses. The results show the complex nature of periurban areas which is associated with an influx of people from urban and rural areas. Periurban areas tend to be seen as safety nets by poor households, often in search of food and other resources like land to improve livelihoods. This, however, is putting pressure on natural resources, which can explain the high levels of food and nutrition insecurity in this area. The periurban study area was characterized by poor infrastructure such as poor access to clean drinking water and lack of toilet facilities; these factors must have contributed to child malnutrition. A study in Northeast India also cited drinking water and toilet facilities as household risk factors affecting child malnutrition (Dinachandra et al., Reference Dinachandra, Alagarajan and Ladusingh2015). The unique characteristics of periurban households have been discussed in a number of studies (Rakodi, Reference Rakodi1999; McGregor et al., Reference McGregor, Simon and Thompson2006; Schlesinger, Reference Schlesinger2013). Schlesinger et al. (Reference Schlesinger, Drescher and Shackleton2015, p. 110) pointed out that these characteristics differ: ‘in terms of social configurations, political–administrative frameworks and natural resource endowment, and that may significantly differ from their urban or rural counterparts’.
Association of urban, periurban and rural agriculture, and household FNS
Households in rural areas had the highest relative proportion dietary diversity (WDDS ≥ 6), compared with urban and periurban areas (Table 6). The subsistence nature of crop production in rural areas, coupled with presence of wild fruits and traditional vegetables offers the opportunity to consume a wide diversity of food groups compared with urban and periurban areas where there is competition to use land for construction and agro-biodiversity (Naab et al., Reference Naab, Dinye and Kasanga2013). Studies have reported an increase in biodiversity with reduced urbanization (Alberti, Reference Alberti2008; McKinney, Reference McKinney2008; Schlesinger, Reference Schlesinger2013). Urban areas are also associated with loss of indigenous knowledge on production and utilization of indigenous species, therefore contributing to limited dietary diversity. The work of Sogbohossou et al. (Reference Sogbohossou, Achigan-Dako, Komlan and Ahanchede2015, p. 9), along the urban–rural continuum of Southern Benin, reported that: ‘urbanization was found to negatively affect the knowledge and uses of wild species’. Although, urban areas had lower WDDS compared with rural areas, they were still better than periurban areas. The difference between urban and periurban areas in terms of dietary diversity can be explained by presence of diverse sources of food outlets in urban areas compared with periurban areas, ranging from food shops, vegetables and fruits markets.
Households doing livestock keeping significantly experienced less wasting and overweight compared with households not doing livestock keeping (Table 6). The work of Zezza and Tasciotti (Reference Zezza and Tasciotti2010, p. 265) based on the household survey data for 15 developing or transition countries also found ‘fairly consistent evidence of a positive statistical association between engagement in urban agriculture and dietary adequacy indicators’. Animal-based foods have been argued to provide much needed micronutrients which are bioavailable to the human body, such as haem iron in organ meat (liver, heart and blood-based foods) (FAO, 2011). The work of Schönfeldt et al. (Reference Schönfeldt, Pretorius and Hall2013, p. 394), highlighted that: ‘In addition to quantity, the high quality of the nutrients in animal source foods is important as high-quality nutrients are more readily absorbed into the human body than lower-quality nutrients from other food and non-food sources’. Livestock keeping was common in rural areas compared with periurban and urban areas, and often households slaughtered livestock such as goats, sheep, chicken and guinea fowl for household consumption.
Households involved in crop production had higher HFIAS compared with households without crop production (Table 7). This result suggests that engagement in crop production was worsening the household food security situation. Ownership of livestock is a sign of wealth in the study area and therefore poorer households often solely engage in crop production. Most households who keep livestock also engaged in non-farm activities like trading and non-farm employment, these helped in generating income to source food for households. Another explanation for crop producers experiencing food insecurity is high use of poor quality farmer-saved seeds by crop producers, 92% of rural households were saving their own seeds (Table 2). If farmers use farmer-saved seeds consecutively for many years without proper selection and going back to the clean parent material, the quality of the seed goes down. Poor quality seed will lead to poor yields and eventually to household food shortages. Setimela et al. (Reference Setimela, Monyo and Bänzinger2004) emphasized the importance of quality seeds as the basis for a meaningful agricultural based food production system. Poor crop yields will worsen the food security situation, mostly of the subsistence households. Other environmental factors such as erratic rains and poor soil fertility can also explain why crop production worsens food security instead of improving it. Rockström and Falkenmark (Reference Rockström and Falkenmark2015, p. 284), pointed out that in Africa: ‘when crops fail, the reason is usually an extended dry spell, or one at a crucial point in the growing season, such as the flowering period, rather than low rainfall. Several weeks without rain are common and may occur each season, sometimes with a devastating effect’. Erratic rains and poor soils are prevalent in the study area and can cause poor yields and perpetrate food insecurity. The work of Ouedraogo et al. (Reference Ouedraogo, Runge, Eisenberg, Barron and Sawadogo-Kaboré2014) based on the analysis of remotely sensed and rainfall data from 1975 to 2011 in Burkina Faso reported experiences of erratic rains. The majority of households relies on rain-fed agriculture in the study area. Hummel (Reference Hummel2015, p. 41), highlighted that in the Sahel: ‘households which are highly dependent on rain-fed agriculture are particularly vulnerable to rainfall variability and ecosystem degradation because these environmental factors have negative effects on crop yields and harvests’. Due to recurrent droughts and frequent harvest failures, farmers in Burkina Faso started improving traditional planting pits (zaï) (Kabore and Reij, Reference Kabore and Reij2004). It was also observed that most of the households not involved in crop production were involved in livestock keeping and non-farming income generating activities such as trading of various goods including food stuffs.
Summary and Conclusions
The results of this study show that livestock and crop production contribute to household FNS at different levels; for example households doing livestock keeping significantly experienced less wasting (WHZ) and overweight (BAZ) compared with households not doing livestock keeping. On the other hand, households engaged in crop production were more food insecure than those not producing crops. Households not producing crops were often involved in livestock keeping and other non-farming income generating activities, like trading small goods and food stuffs.
The periurban areas were worst affected by food and nutrition insecurity in Ouagadougou. Based on our results, we recommend the policy formulation and implementation to support agricultural activities mostly in periurban areas. The following specific recommendations are given to address some of the observed challenges in the study area: First, the provision of quality seed possibly through community based seed groups. This can target common initiative farmer groups and the capacity of these farmers can be built by national organizations such as Institut de l'Environnement et Recherches Agricoles (INERA) and other non-governmental organizations. Secondly, investing in water harvesting techniques as stressed in the work of Rockström and Falkenmark (Reference Rockström and Falkenmark2015) will help crop production which relies on the rain-fed production system in a region of erratic rains. These techniques can take the form of traditional planting pits (zaï) as discussed by Kabore and Reij (Reference Kabore and Reij2004) amongst others. Thirdly, use of organic manure and compost will help to improve soil fertility, to improve the contribution of crop production to food security. These can take the form of compost pits which we observed in some surveyed villages promoted by the Adventist Development and Relief Agency. The complexity of periurban areas coupled with the scourge of food and nutrition insecurity will require more periurban agriculture and food policy consideration.
Acknowledgements
This study is a part of the first author's PhD work, financially supported from the BMBF funded UrbanFoodPlus project. We thank the village chiefs and all the authorities in the surveyed area for their cooperation during the data collection. The authors thank all those who participated in the survey, especially women and children. We thank the field assistants, student assistants and data entry clerks for their dedication during this study.