I. INTRODUCTION
Laser welding is an essential assembly technique in the automobile and aerospace industries. It is, however, also accompanied by residual stress and thermal deformation in the workpiece, which raises significant concerns about reliability in critical applications, such as in a nuclear power plant. Pulsed lasers have been proposed as one of the welding methods for achieving high-precision, as they produce a small heat-affected zone (HAZ), minimal residual stress, and minimal thermal deformation. Thus, pulsed lasers have been used in assembly processes in the nuclear industry.
However, a rapid temperature change in the specimen also occurs during pulsed laser welding using an intense laser beam and a very short pulse duration. The abrupt change in temperature is accompanied by complicated physical phenomena, such as the formation of keyholes, absorption and reflection of the laser beam, phase transition, and the alteration of material properties that are temperature- and phase-dependent. In addition, various welding parameters, such as the pulse power, duration, frequency, and laser beam diameter, affect the welding results. Thus, thorough knowledge of the physical mechanisms and effects of the welding parameters is a prerequisite for understanding the characteristics of laser welding. Weckman reported on the shape of the welding spots with respect to the pulse duration and power.Reference Weckman, Kerr and Liu1 Tzeng experimentally analyzed the parameters of seam welding, such as the average pulse density, maximum power, and frequency.Reference Tzeng2 Pan et al. optimized the parameters of Nd:YAG laser welding by the Tagucci method to derive the ultimate tensile strength of the welding spot of Mg alloys.Reference Pan, Wang, Hsiao and Ho3 Dandras et al. characterized the dependence of the melt pool diameter and welding quality on various laser-welding factors, such as the assist gas and preheat temperature.Reference Dadras, Torkamany and Sabbaghzadeh4
Most of these studies primarily focused on critical manufacturing defects caused by thermal deformation. However, the welding conditions that minimize these defects have been conventionally investigated by experience-based experiments. This is because of the complicated mechanisms and the impractical time and high costs required. In recent years, more efficient numerical methods have been developed for parametric studies to investigate the relationship between the temperature of the welding pool and the specimen behavior. Most welding models are based on the analytical solution of Rosenthal.Reference Rosenthal5 Mazumder and Steen developed the first finite difference model of continuous laser welding using a Gaussian heat source model.Reference Mazumder and Modest6 Frewin and Scott constructed the first simulation model for analyzing the temperature of workpieces during pulsed welding using a finite element method (FEM).Reference Frewin and Scott7 By means of the model, they investigated the time-dependent temperature distribution of the specimen, the diameter of the molten zone (MZ), and the HAZ. De et al. analyzed the spot laser welding process with a 150 ms pulse duration using a double ellipsoidal model.Reference De, Maiti, Walsh and Bhadeshia8 He et al. developed a numerical model for stainless spot welding that incorporated the heat transfer and fluid flow.Reference He, Fuerschbach and DebRoy9 Most of these theoretical studies on welding have focused on analyzing the temperature distribution at the welding spot, including the HAZ, and have given information limited to the shape of the MZ. Several researchers have recently analyzed residual stress and deformation based on the calculated temperature distribution. Tsirkas et al. carried out a study on the deformation of a steel plate after butt welding,Reference Tsirkas, Papanikos and Kermanidis10 and Dacourt et al. analyzed the deformation of a T-shaped structure welded by continuous laser welding.Reference Darcourt, Roelandt, Rachik, Deloison and Journet11 Moraitis and Labeas suggested a numerical method for calculating the residual stress and thermal deformation at an aluminum lap joint.Reference Siefken, Coryell, Harvego and Hohorst12 Tsoukantas and Chryssolouris investigated the geometric characteristics of the weld with respect to the laser beam inclination, while considering other processing conditions such as the laser power and speed.Reference Tsoukantas and Chryssolouris13 Salonitis et al. studied the laser butt welding of steel sandwich sheet composites.Reference Salonitis, Stavropoulos, Fysikopoulos and Chryssolouris14 They analyzed the effects of the welding parameters on the welding geometry and developed a theoretical simulation model to estimate the temperature distribution of the workpiece. Stournaras et al. analyzed the laser grooving process experimentally and theoretically.Reference Stournaras, Salonitis, Stavropoulos and Chryssolouris15 They correlated the thermal energy delivered by a pulsed laser with the groove depth, while considering process parameters including the laser power, pulsing frequency, and scanning velocity. However, these previous studies have been limited to the temperature distribution and mechanical behavior of continuous laser welding and single spot welding. Pulsed laser seam welding incorporates various complicated welding parameters, and the entire process is difficult to simulate numerically because the intervals of the many laser pulses are on the order of milliseconds. Moreover, the behavior of the atypical materials welded by pulsed laser seam welding, such as Zircaloy-4 (which is generally used in the nuclear industry), is rarely studied. The potential consequences of this trend are critical.
In this paper, an enhanced computational approach using an advanced heat source model for Zircaloy-4 is proposed. The developed heat source model effectively describes the higher thermal density produced by increasing the laser power. In particular, the disproportion of the HAZ along the thickness of the Zircaloy-4 sheet in various welding conditions is successfully described by the proposed model, which has been difficult to achieve in previous studies. Moreover, we have used the developed model to comprehensively analyze the characteristics of the pulsed laser seam welding of Zircaloy-4, taking into consideration all the principal process parameters. The dimensions of the MZ, HAZ, and thermal deformation of the thin sheets have been investigated with respect to the process parameters, such as the pulse power, pulse duration, and frequency of the laser. The relationships determined between the process parameters and the thermal deformation offer reliable guidance for the pulsed laser seam welding of Zircaloy-4.
II. MATERIAL PROPERTIES
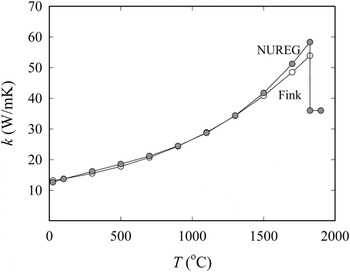
The rapid temperature increase due to an intense laser beam causes a phase transition, which is accompanied by the alteration of material properties. Thus, a computational analysis must incorporate the material properties affected by the temperature and phase transition. The properties of commonly used materials, such as steel and aluminum, are available over a wide range of temperatures. Recent studies on temperature-dependent material properties have used currently available experimental methods to determine these properties at high temperatures.Reference Martinson, Daneshpour, Kocak, Riekehr and Staron16 However, there is limited information on the properties of Zircaloy-4 at high temperatures, especially in the vicinity of the melting temperature, and averaged material properties that are independent of temperature are often adopted.Reference Zhang, Roy, Elmer and DebRoy17 The phase transition of Zircaloy-4 occurs within the temperature range of 1080–1250 K. The cooling rate is assumed to be 0.05 °C/s, because the assembly process for a nuclear fuel spacer grid generally occurs in a gas chamber, and the cooling rate of the chamber has been measured to be 0.05 °C/s.Reference Jeong, Rheem, Choi and Kim18 The material properties for welding simulations are categorized into thermal and mechanical properties. Thermal properties, such as thermal conductivity, specific heat, and density, are required to calculate the temperature distribution from the applied laser heat source. Previous studies have adopted the thermal properties given in the NUREG report. The report experimentally determined the thermal properties. However, as the thermal conductivity was determined without consideration of the thermal diffusivity, for Zircaloy-4, we have adopted the thermal conductivity incorporating the thermal diffusivity reported by Fink, as shown in Fig. 1.Reference Fink and Leibowitz19 The thermal conductivity was determined over ten experiments and fitted from 298 K through 2000 K. It is more reliable than that of the NUREG report, especially at high temperatures.
Thermal conductivity of Zircaloy-4 at various temperatures.

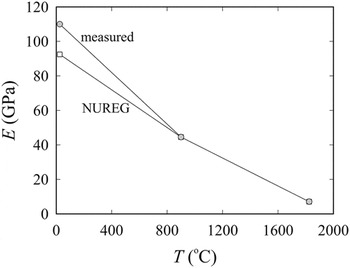
The elastic modulus of a metal is generally affected by various conditions, such as the temperature, oxygen content, neutron content, and work hardening. The temperature and oxygen content particularly cause significant changes in the elastic property. For instance, Northwood and Rosinger reported on the relationship between the oxygen content and elastic modulus.Reference Northwood and Rosinger20 For precision, we experimentally determined the elastic modulus of the specimens at room temperature and used the data for the pulsed laser seam welding tests. The determined elastic modulus of our specimen at room temperature was 108 GPa and was obtained using a tensile speed of 4.8 mm/min on the INSTRON 5882 universal material testing machine. The displacement was measured using an advanced video extensometer (AVE). The elastic modulus of Zircaloy-4 decreases uniformly with increasing temperature. Thus, as shown in Fig. 2, we determined the elastic modulus at over 1250 K by extrapolation of the experimental results obtained at room temperature and the values presented in the NUREG report. When Zircaloy-4 is cooled without quenching, the mechanical properties of the HAZ are not dependent on the site but on the cooling rate.Reference Jeong, Choi and Rheem21 In the case of a nuclear fuel spacer grid, Zircaloy-4 is treated after welding by furnace cooling. Thus, the material properties were uniformly assigned using the experimental results for the HAZ.
Elastic modulus of Zircaloy-4 at various temperatures.

III. MODEL DESCRIPTION
A. Heat source model
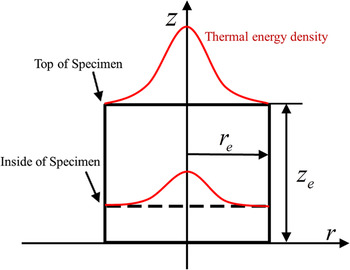
As the shapes and sizes of the MZ and HAZ are significantly determined by the heat source, the detailed development of a reliable heat source model is essential for a computational study of laser welding. Goldak's double ellipsoidal model of the heat source is widely used for tungsten inert gas (TIG) and metal inert gas (MIG) welding.Reference Wu, Hu and Gao22 For laser or electron beam welding, the conical Gaussian model is used for the heat source.Reference Tsirkas, Papanikos and Kermanidis10 For an accurate depiction of a specific welding procedure, both models can be combined.Reference Wu, Hu and Gao22 The shape of the welding spot, which is closely related to the heat density, is affected by the welding method. As observed from our experiments, the MZ during the pulsed laser seam welding of Zircaloy-4 is relatively deep, owing to the very high heat source density and small fusing heat, whereas the HAZ is narrow. To design the pulsed laser welding process of Zircaloy-4, a computational analysis with an accurate heat source model needs to be performed in every possible process condition while varying all the process parameters. Thus, we developed a comprehensive and accurate heat source model, which is a modified Gaussian heat source model. With the developed model, we can precisely calculate the shape of the MZ and HAZ in the pulsed laser seam welding of Zircaloy-4. As shown in Fig. 3, the thermal energy induced by the pulsed laser welding is described by:
 $$Q = {{\eta {P_{\rm{P}}}} \over {\pi r_{\rm{e}}^2{z_{\rm{e}}}}}\exp \left( { - {{{r^2}} \over {r_{\rm{e}}^2}}} \right)\exp \left( { - {z \over {{z_{\rm{e}}}}}} \right) + {Q_1}\quad {\rm{,}}$$
where r e, z e, η, and P P are the initial radius of the heat source, depth of the heat source, mean absorption rate, and laser power, respectively. The modified Gaussian heat source model describes the thermal energy in the z-direction with  $\exp \left( { - {z \over {{z_{\rm{e}}}}}} \right)$ instead of
 $\left( {1 - {z \over {{z_{\rm{e}}}}}} \right)$. From the exponential decay of the thermal energy in the z-direction, a plausible temperature distribution in the thickness direction is precisely calculated. From the modified model, the high-thermal energy can penetrate into the specimen from the welding surface to the depth of the laser source, which generates a wide HAZ in the bottom of the specimen, as observed in experiments. Moreover, from the last term in the equation, Q 1, which is a constant in the welding square cross-section, the high-thermal energy from the laser is additionally maintained in the thickness direction. Thus, the shrinking rate of the HAZ in the thickness direction declines, and the HAZ at the bottom of the specimen expands.
Modified 3D Gaussian heat source model.

B. Numerical model
The computational analysis of laser welding consists of thermal and mechanical analyses. In the thermal analysis, heat transfer from the applied heat source is calculated with thermal material properties. The temperature distribution is obtained for each time step and the results are exported to the mechanical analysis. In the mechanical analysis, the thermal deformation and stress of the specimen due to the temperature gradient are calculated using the appropriate mechanical properties. The calculation continues until the completion of the welding process. We used a transient heat transfer model to investigate the thermal conductivity and heat loss by convection and radiation from the surface of the specimen. The relevant thermal properties of Zircaloy-4 were obtained experimentally and from references. The specific heat of Zircaloy-4 during the phase transition has not been reported. Thus, we determined the specific heat from the enthalpy of fusion, which is 22.5 J/kg, using the following correlation between the two properties:
 $$\Delta {H_{{\rm{liq}}}} = 22.5\,{\rm{J/kg}} = \int c \,{\mathop{\rm d}\nolimits} T\quad {\rm{.}}$$
The total strain rate is composed of the elastic strain rate  $\left( {{{\dot \varepsilon }^{\rm{e}}}} \right)$, plastic strain rate
 $\left( {{{\dot \varepsilon }^{\rm{p}}}} \right)$, transformation plasticity
 $\left( {{{\dot \varepsilon }^{{\rm{tp}}}}} \right)$, and thermal strain rate
 $\left( {{{\dot \varepsilon }^{{\rm{th}}}}} \right)$.
 $$\dot \varepsilon = {\dot \varepsilon ^{\rm{e}}} + {\dot \varepsilon ^{\rm{p}}} + {\dot \varepsilon ^{{\rm{tp}}}} + {\dot \varepsilon ^{{\rm{th}}}}\quad {\rm{.}}$$
 ${\dot \varepsilon ^{\rm{e}}}$ and
 ${\dot \varepsilon ^{\rm{p}}}$ can be measured by a tensile test.
 ${\dot \varepsilon ^{{\rm{th}}}}$ can be obtained by a thermal expansion experiment, and
 ${\dot \varepsilon ^{{\rm{tp}}}}$, which is due to phase transition, can be obtained from the investigation of Magee.Reference Magee and Paxton23 In this research, we considered the total strain rate using a model in which the accumulated strain vanishes above the solidus temperature.
C. Laser pulse model
Pulsed welding is done using discontinuous spot welds and a constant interval. Pulsed welding causes less deformation than continuous welding owing to the small sizes of the MZ and HAZ. However, in the numerical simulation of pulsed welding, it is very difficult to manage the substantial amount of data on the modeling process because of the very small computational time step and the very refined elements necessary to accommodate the intense laser power. The computational study of pulsed laser welding involves more complicated process parameters than for continuous welding, such as the laser power (P P), pulse duration (T P), interval between each pulse (T F), overlap of each pulse (%), and travel speed (v). We developed a laser pulse model that incorporates all of the pulsed laser welding parameters as a function of time. The length and distance of each pulse were described by the welding parameters v × T P and v × T F, respectively. The computational time steps and the interval between them were appropriately adjusted during each spot welding to increase the computational efficiency.
IV. EXPERIMENTAL PROCEDURE
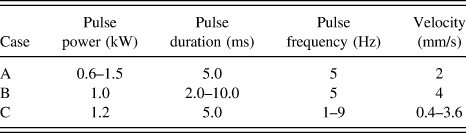
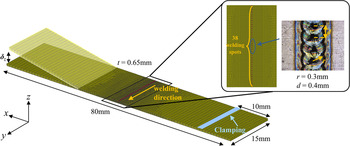
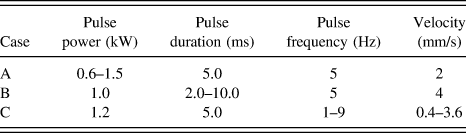
The simulation results were verified by welding experiments performed using sheets of Zircaloy-4. Specimens of dimensions 80 × 15 × 0.65 mm were welded using a pulsed Nd:YAG laser. The middle of each specimen parallel to the shorter sides was welded. Nitrogen gas was injected at 10 L/min to prevent oxidation of the specimens. The specimens were clamped at 10 mm from one of the shorter sides to measure the deformation of the other sides. For each condition, the welding experiments were performed three times and the deformations were measured using an optical microscope. The parameters of the pulsed laser seam welding were the laser power (P P), pulse duration (T P), pulse frequency (f), travel speed (v), and laser beam diameter (d). Using a laser beam diameter of 0.6 mm and an interval of 0.4 mm, the welding speed was expressed as a function of the frequency, i.e., f × v. Thus, the effect of the pulse power, duration, and frequency were thoroughly analyzed. The conditions of the experiments are given in Table I.
Experimental welding parameters.
V. RESULTS AND DISCUSSION
The constructed simulation model is shown in Fig. 4. The model consisted of eight-node brick elements and six-node prism elements. The total numbers of nodes and elements were 58,600 and 49,220, respectively. We used 38 one-dimensional elements at each spot welding site to generate the predefined heat source. Dense elements were used along the weld line to accurately describe any excessive temperature fluctuation and the phase transition along the line. 38 spot welds were done in 3.71 s and subsequently cooled over 20 s. For the numerical study, we used the commercial FEM software SYSWELD. The phase transition of the welding specimen was considered with the transformation kinetics of the Johnson–Mehl–Avrami–Kolmogorov (JMAK) model and the continuous cooling transformation (CCT) curve. The JMAK model is based on the assumption that nuclei are randomly dispersed in the simulation domain and analyzes the isothermal phase transition by nucleation and growth with statistical methods. From the phase transition analysis, the distribution of each phase and the material properties with position and temperature are predicted.
Simulation model and dense elements along the weld line.

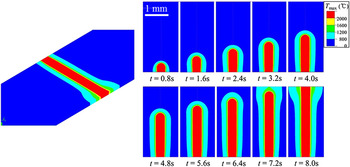
The evolutions of the MZ and HAZ during the welding process are shown in Fig. 5. Generally, the dimensions of the HAZ and the deformation continued to increase after the heat source had passed. However, the MZ (characterized by a temperature of over 2000 °C) and HAZ (with a temperature of 800–2000 °C) had constant widths. The constant widths of the MZ and HAZ can be confirmed from the figure, with the exception of the region at the end of the welding. Because laser welding requires less thermal energy than arc welding, the evolution of the HAZ is almost completed within the pulse interval, and a relatively uniform width is generated.
Evolution of MZ and HAZ during welding.

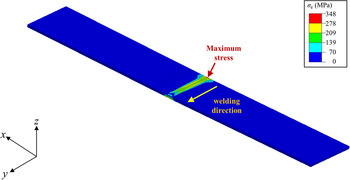
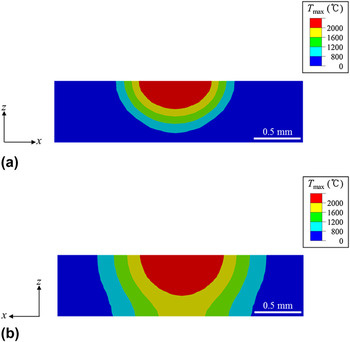
In addition to the deformation generated during pulsed laser welding, the residual stress developed in the specimen is one of the important characteristics for evaluating the welding quality, as the residual stress may induce mechanical failure of the welded joint. The residual stress is generated by the irregular expansion caused by the large temperature gradient during pulsed laser welding. Thus, each parameter of the welding condition would affect the residual stress in the specimen. As the pulsed laser welding proceeds, thermal stress is generated and accumulates around each welding spot due to the temperature gradient. In Figs. 6 and 7, the stress and temperature distribution after pulsed laser welding with 1.5 kW are presented, respectively. Greater residual stress is generated near the initial welding spot than the final welding region. In pulsed laser welding, the preceding welding spots increase the temperature near the region of the next welding spots before the actual welding procedure. Thus, the temperature of the last welding spot is already elevated to 535 °C before welding, and the decay in temperature in the thickness direction decreases. As shown in Fig. 7(a), at the initial welding point, the temperature drops from the melting temperature to the room temperature (20 °C) within 0.52 mm from the welding surface in the thickness direction. However, at the final welding point, the temperature drops to only 1730 °C at the bottom of the specimen. Because of the preheating before welding, the temperature gradient in the thickness direction at the later welding spot becomes smaller, which induces smaller residual stress. At the initial point of welding, the largest temperature gradient is generated, driving a large residual stress. Furthermore, the accumulated residual stress is relaxed when the temperature rises above the melting temperature. Close to the final welding spot, the larger MZ induces more relaxed residual stress. Thus, the maximum residual stress is generated at the initial welding spot.
Residual stress after welding with 1.5 kW pulse power.

Temperature distribution in the thickness direction with 1.5 kW pulse power at the (a) initial and (b) final pulse welding point.

A. Effect of the laser power
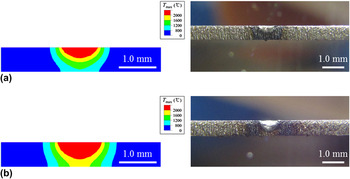
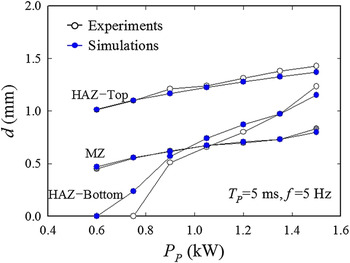
From Eq. (1), the power of the pulsed laser is proportional to the magnitude of the Gaussian heat source. As the initial radius of the heat source r e increases, the width of the MZ also increases. When the depth of the heat source z e increases, the depth of the MZ increases. The initial radius and depth for the heat source model of the Nd:YAG laser beam were appropriately fixed at 0.3 and 0.065 mm, respectively, which are the diameter of the laser beam and 1/10 of the thickness of the specimen, respectively. Although the absorption factor, which depends on the material property, surface treatment, and laser condition, generally increases with the temperature, the absorption factor can be assumed to be constant for conduction welding.Reference Chang and Na24 Here, conduction welding was adopted and a 40% absorption factor was used. Q 1 in Eq. (1) reflects the experimental conditions and is chosen by considering the shape of the MZ. As shown in Fig. 8, the shapes of the MZ and HAZ were analyzed with various pulsed laser powers. The width of the MZ on the top surface of each specimen was calculated. Regarding the HAZ, the widths on the top and bottom surfaces of the specimen were calculated. The HAZ can be generated on the bottom surface because of the thinness of the specimen. To analyze the effect of the pulsed laser power, the same pulse duration and frequency were applied in all cases, namely 5 ms and 5 Hz, respectively. The pulsed laser power was increased in steps of 150 W from 600 to 1500 W. As the pulsed laser power increased, the widths of the MZ and HAZ on the top surface gradually increased, whereas the width of the HAZ on the bottom surface increased more sharply. The HAZ expanded on the bottom surface as the pulsed laser power was increased. Particularly, when the pulsed laser power was greater than 1 kW, the width of the HAZ on the bottom surface of the specimen was comparable to that on the top surface. Moreover, the thermal energy conducted to the bottom of the specimen resulted in the semicircular cross-sectional shape of the HAZ becoming more rectangular and parallel to the z-axis. The reliability of the thermal analysis using the developed heat source model was demonstrated by the consistency of its results with experimental observations.
Comparison of simulation and experimental MZ and HAZ profiles for laser powers of (a) 600 W and (b) 1 kW.

As shown in Fig. 9, when the laser power is increased beyond 1 kW, the shape of the HAZ expands to the bottom of the specimen and eventually becomes parallel to the z-direction. The relatively uniform distribution of the HAZ in the z-direction reduces the contraction of the specimen toward the MZ. Therefore, to minimize deformation in the direction normal to the welding surface, a laser power that is sufficient to make the distribution of the HAZ in the normal direction uniform should be used.
MZ and HAZ for various laser powers.

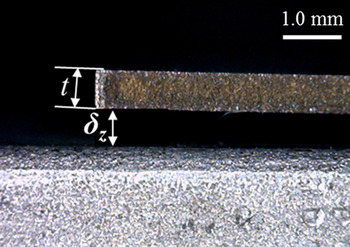
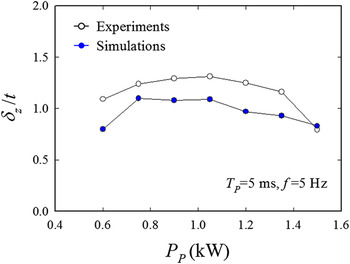
The deformation in the z-direction shown in Fig. 10, which is normalized by the thickness of the specimen, is measured and calculated in Fig. 11. The welding condition corresponds to that of Fig. 4. The deformation increases gradually as the laser power increases. However, when the laser power exceeds about 1 kW, the deformation begins to decrease. As the MZ is produced, the generated thermal strain in the MZ dissipates and the specimen contracts toward the MZ. Thus, deformation in the z-direction is produced. As the laser power is increased beyond 1.0 kW, the MZ region keeps increasing and becomes much larger than half of the thickness of specimen. As the MZ region approaches the bottom of the specimen, the contraction toward the MZ along the thickness becomes more uniform. The relatively uniform distribution of the HAZ in the z-direction with the increased laser power of over 1.0 kW, moreover, reduces the disproportionate contraction of the specimen toward the MZ and does not generate larger deformation in the z-direction than that with 1 kW.
Experimental deformation in the z-direction.

Deformation in the z-direction for various pulse powers.

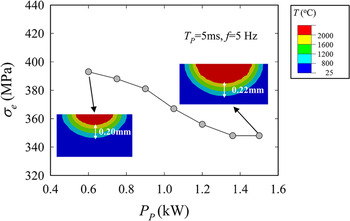
In Fig. 12, the maximum residual stresses after welding with various pulse powers are presented. The maximum residual stress generated in the initial welding spot decreases as the pulse power decreases. As shown in the temperature distributions of the cases with 0.6 and 1.5 kW, the temperature decreases from the melting temperature to the room temperature within 0.20 and 0.22 mm, respectively. As the pulse power increases, the HAZ expands and the temperature decreases slowly from the melting temperature to the room temperature. The smaller temperature gradient generates a smaller residual stress. Moreover, the welding process with 1.5 kW has a larger MZ than that with 0.6 kW, which relaxes more residual stress and eventually generates a smaller residual stress.
Maximum residual stress for various pulse powers.

B. Effect of the pulse duration
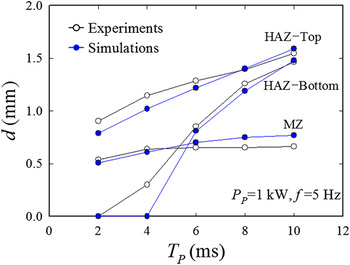
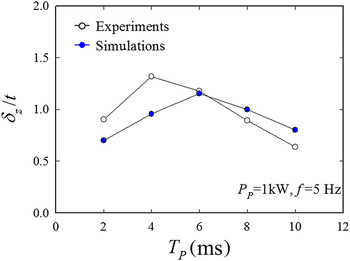
In pulsed laser welding, the welding characteristics are also affected by the pulse duration. To analyze the effect of the pulse duration on the deformation, welding experiments were performed using various pulse durations increased in steps of 2 ms from 2 ms to 10 ms. 1 kW pulse laser power and 5 Hz pulse frequency were used. As shown in Fig. 13, when the pulse duration was increased, the width of the HAZ on the top surface of the specimen increased, and the difference between the widths of the HAZs on the top and bottom surfaces decreased. The shape of the HAZ became more parallel to the z-axis as the pulse duration increased. On the other hand, the variation in the width of the MZ was relatively small. When a system with a constant thermal density attains a quasi-steady state owing to heat loss by conduction, convection, and radiation, the MZ is maintained. Thus, the MZ is more dependent on the pulse laser power than the pulse duration. However, the conduction of the accumulated thermal energy by the increased pulse duration enlarges the size of the HAZ. Figure 14 shows the deformation in the z-direction for various pulse durations. As the thermal energy increased with the pulse duration, the deformation increased until the disproportion of the HAZ in the z-direction gradually became less significant. As the HAZ became more aligned with the z-axis as a result of sufficient thermal energy for the propagation of the HAZ to the bottom of the specimen, the deformation due to asymmetric thermal deformation decreased.
MZ and HAZ for various pulse durations.

Deformation in the z-direction for various pulse durations.

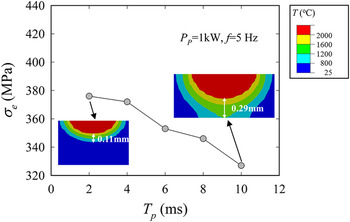
As the pulse duration increases, the residual stress decreases as shown in Fig. 15. For the welding stress with the 2 ms pulse duration, the MZ is considerably smaller than that with the 10 ms pulse duration. Also, for the 2 ms pulse duration, the temperature decreases rapidly within a 0.11 mm region, while the temperature for the 10 ms pulse duration slowly decreases to the bottom of the specimen. As the pulse duration increases, the temperature gradient increases and the size of the MZ that relaxes the residual stress increases, which induces a larger residual stress in the pulsed laser welding process.
Maximum residual stress for various pulse durations.

C. Effect of the pulse frequency
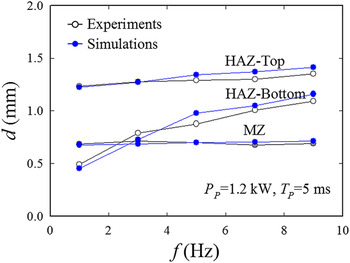
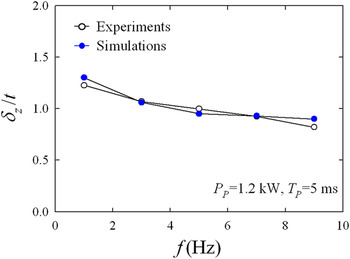
The computational and experimental analyses of the pulse frequency are presented in Figs. 16 and 17. Various pulse frequencies for 1.2 kW laser power and 5 ms pulse duration were considered. The pulse frequency was increased in steps of 2 Hz from 1 to 9 Hz. As shown in Fig. 16, the widths of the HAZ and MZ on the top surface were not significantly affected by the pulse frequency. However, as the width of the HAZ on the bottom surface increased with the frequency, the time interval between the pulses accordingly decreased. Thus, the HAZ expanded to the bottom of the specimen. The deformation in the z-direction is illustrated in Fig. 17. As the frequency increased, the deformation decreased. The deformation was significantly affected by the shape of the HAZ, as observed in the parametric study using the pulse laser power and duration. The deformation decreased as the width of the HAZ on the bottom surface increased, particularly from 1 to 3 Hz. As the difference between the widths of the HAZs on the top and bottom surfaces decreased, indicating a more rectangular-shaped HAZ that is more aligned with the z-axis, the deformation induced by the disproportion of the HAZ decreased.
MZ and HAZ for various pulse frequencies.

Deformation in the z-direction for various pulse frequencies.

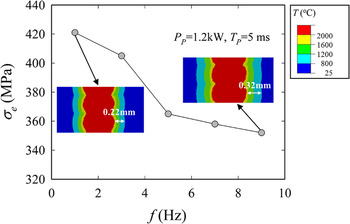
The pulse frequency changes the preheating effect of the preceding welding spot. With a large frequency, the preheating effect becomes more significant and the size of the HAZ increases, which induces a smaller temperature gradient. Thus, as shown in Fig. 18, the smaller temperature gradient causes a smaller residual stress in the specimen as the pulse frequency increases.
Maximum residual stress for various pulse frequencies.

VI. CONCLUSIONS
This study presents a computational analysis of the mechanical behavior of Zircaloy-4 as induced by a pulsed laser. The developed heat source model and the precise thermal and mechanical properties of Zircaloy-4 are very reliable for simulating the phase transition and deformation of Zircaloy-4. The proposed model accurately describes the geometry of the MZ and especially the disproportion of the HAZ along the thickness of the Zircaloy-4 sheet in various welding conditions. The developed model affords a parametric study of the pulsed laser conditions, namely the laser power, pulse duration, and pulse frequency. The geometries of the MZ and HAZ are significantly dependent on the laser power. The sizes of the MZ and HAZ increase with the laser power. Particularly, the shape of the HAZ changes from semicircular to rectangular as the distribution of the thermal gradient along the thickness of the specimen becomes more uniform. Thus, the deformation of the specimen in the z-direction decreases as the geometry of the HAZ is altered by an increase in the laser power. The pulse duration considerably affects the geometry of the HAZ. As the pulse duration increases, the sizes of the HAZ and the deformation increase. When greater thermal energy is conducted to the bottom of the specimen, the disproportion of the HAZ in the z-direction and the deformation decreases. Compared to the other conditions, the pulse frequency has no significant effect on the welding characteristics, especially the phase transition. As the pulse frequency is increased, the geometrical change in the HAZ and the corresponding deformation are similar to those of the other welding conditions. However, the size and decreasing disproportion of the HAZ in the z-direction are insignificant compared to the laser power and pulse duration. The developed model shows that the deformation is strongly dependent on the geometry of the MZ and HAZ, especially the disproportion of the HAZ along the thickness of the specimen, which can be controlled by the laser power, pulse duration, and pulse frequency. This study offers a systematic analysis of the pulsed laser welding of Zircaloy-4 for the assembly of nuclear fuel spacer grids.
ACKNOWLEDGMENTS
This research was supported by the Basic Science Research Program and the National Nuclear R&D Program through the National Research Foundation (NRF) of Korea, funded by the Ministry of Education, Science and Technology (No. 2014R1A2A2A09052374, No. 2013R1A1A2011263, and No. 2013-035148), and by a research grant (No. 2009-0083510) funded by the Korean government (MEST) through the Multi-phenomena CFD Engineering Research Center.