Introduction
The past decade witnessed several technological breakthroughs that have played a critical role in sustaining the performance and density benefits of transistor area scaling. The development of 90-nm Si-CMOS (complementary metal oxide semiconductor) saw the introduction of strained-Si technology.Reference Ghani, Armstrong, Auth, Bost, Charvat, Glass, Hoffmann, Johnson, Kenyon, Klaus, McIntyre, Mistry, Murthy, Sandford, Silberstein, Sivakumar, Smith, Zawadzki, Thompson and Bohr1 Embedded SiGe stressors in the source/drain provided the necessary uniaxial compressive stress in the channel to improve hole mobility. For electron mobility enhancement, a silicon nitride stressor layer induced the required tensile stress in the channel. Since then, several innovations in transistor technology have been built on top of the strained-Si technology to deliver the performance benefits of transistor scaling in accordance with Moore’s law. These innovations include the use of metal gate and high-κ gate dielectric (gate insulator material with higher dielectric constant κ than SiO2) technology,Reference Mistry, Allen, Auth, Beattie, Bergstrom, Bost, Brazier, Buehler, Cappellani, Chau, Choi, Ding, Fischer, Ghani, Grover, Han, Hanken, Hattendorf, He, Hicks, Huessner, Ingerly, Jain, James, Jong, Joshi, Kenyon, Kuhn, Lee, Liu, Maiz, Mcintyre, Moon, Neirynck, Pae, Parker, Parsons, Prasad, Pipes, Prince, Ranade, Reynolds, Sandford, Shifren, Sebastian, Seiple, Simon, Sivakumar, Smith, Thomas, Troeger, Vandervoorn, Williams and Zawadzki2 which helps reduce the equivalent gate oxide thickness (EOT) without incurring a penalty in terms of excessive gate leakage current. Note that future technology nodes beyond 10-nm require an EOT of less than 1 nm. More recently, the migration from conventional planar transistors to non-planar 3D transistors (tri-gate/FinFETs, where a FinFET is a non-planar field-effect transistor in which the conducting channel is patterned into a thin fin-like structure) has enabled further device scaling by providing good electrostatic control of the transistor channel and mitigating the short-channel effects.Reference Auth, Allen, Blattner, Bergstrom, Brazier, Bost, Buehler, Chikarmane, Ghani, Glassman, Grover, Han, Hanken, Hattendorf, Hentges, Heussner, Hicks, Ingerly, Jain, Jaloviar, James, Jones, Jopling, Joshi, Kenyon, Liu, McFadden, Mcintyre, Neirynck, Parker, Pipes, Post, Pradhan, Prince, Ramey, Reynolds, Roesler, Sandford, Seiple, Smith, Thomas, Towner, Troeger, Weber, Yashar, Zawadzki and Mistry3,Reference Hisamoto, Lee, Kedzierski, Takeuchi, Asano, Kuo, Anderson, King, Bokor and Chenming4 As a result, tri-gate/FinFET transistors show reduced leakage compared with their planar counterparts.
As the search continues for technological solutions that can extend the life of Moore’s law beyond Si-CMOS, several options are under investigation that promise to deliver the performance benefits of further device scaling.Reference Kuhn5 Alternate channel materials such as III–V and Ge that show higher electron and hole mobilities compared to Si are being considered for future technology nodes. High channel mobility improves the MOSFET (metal oxide semiconductor field-effect transistor) on-current, reducing the transistor switching delay. This enhancement in the drive current also allows for further reduction in the supply voltage, thereby reducing the active switching power consumption. High electron mobility III–V channel materials such as InGaAs, co-integrated with materials such as SiGe and Ge that show high hole mobility, have been touted as one of the more feasible routes for realizing the next generation of CMOS devices. III–V based proof-of-concept MOSFET devices have already been shown to deliver high performance;Reference Radosavljevic, Chu-Kung, Corcoran, Dewey, Hudait, Fastenau, Kavalieros, Liu, Lubyshev, Metz, Millard, Mukherjee, Rachmady, Shah and Chau6,Reference Del Alamo7 however, such solutions are riddled with formidable challenges in the integration of III–V materials on the Si platform, resulting in potentially higher costs and associated difficulties in high-volume manufacturing. Addressing these challenges continues to be an active area of research.
In this article, we present an overview of the state of the art of Ge and germanium-tin alloys (GeSn)-based transistor research. While Ge is known to exhibit higher bulk electron and hole mobilities compared with Si, recent investigationsReference Gupta, Chen, Magyari-Kope, Lin, Yang, Nainani, Nishi, Harris and Saraswat8–Reference Gupta, Huang, Kim, Sanchez and Saraswat10 have found strained-GeSn p-channel transistors to outperform Ge in terms of inversion layer (a thin layer of carriers formed near the high-κ/channel interface in the strong inversion condition) hole mobility. Undoubtedly, Ge and GeSn represent interesting alternatives to Si as the channel material for high-performance logic applications, generating significant research interest in evaluating and optimizing the performance of MOSFET devices using these materials. The article presents the important surface passivation techniques developed for realizing Ge, GeSn channel transistors, and the successful approaches for achieving low-resistance contacts to Ge, GeSn MOSFETs. The performance of these MOSFETs is benchmarked. Finally, we cover how bandgap and stress engineering using only group IV materials—Si, Ge, and Sn and their alloys—can be employed to design a FinFET-based CMOS solution for the 7 nm technology node and beyond. Through careful selection of channel and source/drain-stressor materials, the CMOS design is shown to achieve performance benefits over strained-Si and meet the off-current requirements. The article concludes by highlighting the open research problems relevant to the materials research community.
Surface passivation
Ge passivation using GeOx interfacial layers
One of the most critical issues in Ge MOSFETs is the fabrication of gate stacks with superior MOS interfaces. In order to simultaneously satisfy good MOS interface properties and thin EOT, gate stacks composed of high-κ layers and interfacial control layers (ILs) have been studied quite extensively. A variety of ILs such as SiO2/Si,Reference Kim, Chui, Saraswat and McIntyre11–Reference Taoka, Harada, Yamashita, Yamamoto, Sugiyama and Takagi14 GeO2,Reference Takagi, Maeda, Taoka, Nishizawa, Morita, Ikeda, Yamashita, Nishikawa, Kumagai, Nakane, Sugahara and Sugiyama15–Reference Lee, Nishimura, Nagashio, Kita and Toriumi28 GeON,Reference Kuzum, Pethe, Krishnamohan, Oshima, Sun, McVittie, Pianetta, McIntyre and Saraswat19,Reference Zhang, Iwasaki, Taoka, Takenaka and Takagi29,Reference Hosoi, Kutsuki, Okamoto, Saito, Shimura and Watanabe30 and Ge3N4Reference Fukuda, Ueno, Hirono and Hashimoto16,Reference Maeda, Yasuda, Nishizawa, Miyata, Morita and Takagi31,Reference Kutsuki, Okamoto, Hosoi, Shimura and Watanabe32 and their MOS interface properties have been reported. In particular, recent studiesReference Takagi, Maeda, Taoka, Nishizawa, Morita, Ikeda, Yamashita, Nishikawa, Kumagai, Nakane, Sugahara and Sugiyama15–Reference Lee, Nishimura, Nagashio, Kita and Toriumi28 have revealed that Ge oxide ILs can provide superior MOS interfaces with low interface state density (D it).
In order to achieve low D it and thin EOT at the same time, a novel IL formation process employing electron cyclotron resonance (ECR) oxygen plasma to form GeOx ILs after deposition of thin Al2O3 using ALD atomic layer depositionReference Zhang, Iwasaki, Taoka, Takenaka and Takagi33–Reference Takagi, Zhang and Takenaka38 is proposed. The basic process flow is shown in Figure 1a. Here, GeOx ILs can be formed beneath HfO2/Al2O3 stacks by plasma post-oxidation. Here, Al2O3 serves as a sufficient oxygen barrier that suppresses the growth of unnecessarily thick GeOx ILs thanks to its intrinsic oxygen permeability. Figure 1b shows a transmission electron microscopy (TEM) image of HfO2/Al2O3/GeOx/Ge gate stacks with an EOT of 0.76 nm. Note that plasma oxidation of HfO2/Ge direct stacks provides inferior MOS interface properties with high D it because of the intermixing of HfO2 and GeOx. Thus, the insertion of ultrathin Al2O3 films is needed as an interdiffusion control layer. This ultrathin GeOx IL is found to effectively reduce D it in both valence and conduction band sides.Reference Zhang, Iwasaki, Taoka, Takenaka and Takagi33–Reference Zhang, Taoka, Huang, Takenaka and Takagi35 The energy distribution of D it exhibits almost a symmetric U-shape. The low D it in the conduction band side, which is advantageous for application of Ge channels in nMOSFETs and resulting CMOS, can be a characteristic inherent to Ge oxide/Ge interfaces. The universal relationship between the GeOx thickness and D it is experimentally obtained, as shown in Figure 2a. This result indicates that a GeOx of ∼0.5 nm (∼0.3 nm EOT) is needed to sufficiently reduce D it. Figure 2b summarizes the relationship between D it and EOT for Al2O3-based gate stacks with and without post-plasma oxidation. Also, it is found that HfO2/Al2O3/GeOx/Ge can yield better D it and lower EOT because of the higher permittivity of HfO2 as compared to Al2O3.
(a) Al2O3/GeOx/Ge gate stack formation process by using an oxygen plasma through a thin Al2O3 layer. Electron cyclotron resonance (ECR) plasma oxidation was performed after atomic layer deposition (ALD) of thin Al2O3 films on Ge substrates to form interfacial GeOx layers. (b) Cross-sectional transmission electron microscope image of HfO2/Al2O3/GeOx/Ge metal-oxide-semiconductor interfaces.

(a) D it of Au/Al2O3/GeOx/Ge metal-oxide-semiconductor (MOS) interfaces at E i-0.2 eV as a function of GeOx interfacial layer thickness for different electron cyclotron resonance plasma power (W). The black symbols represent the change in thickness with various oxidation times. The other data reflect the result of Al2O3/GeOx/Ge with different Al2O3 thickness and plasma power. The data show that D it is a universal function of GeOx thickness. It is found that the GeOx physical thickness and equivalent gate oxide thickness (EOT) of around 0.5 nm and 0.35 nm, respectively, corresponding to the red shaded area, would be sufficient to reduce the D it values. (b) D it as a function of the EOT for Al2O3/Ge and HfO2/Al2O3/Ge MOS interfaces with and without GeOx formed by plasma post-oxidation. The use of HfO2 allows for lower EOT compared with Al2O3-based stacks, as shown by the red arrow. The gate leakage current in the Al2O3/GeOx/Ge gate stacks rapidly increases with thinning EOT down to less than 1 nm, which can be the EOT scaling limit of the gate stacks. Note: D it, interface state density; E i, mid-gap energy. Reprinted with permission from Reference 36. © 2012 IEEE.
Low-temperature Si2H6 passivation of GeSn
Si passivation of Ge or GeSn prior to gate stack formation is particularly effective for pMOSFETs. For GeSn pMOSFETs, the Si deposition temperature should be as low as possible (typically less than 450°C) to suppress surface segregation of Sn. To achieve low-temperature Si passivation, higher order silane precursors can be used. As a technology demonstration, disilane (Si2H6) was selected for Si deposition on GeSn at 370°C using an ultrahigh vacuum chemical vapor deposition (UHVCVD) tool.Reference Gong, Han, Bai, Su, Guo, Yang, Cheng, Zhang, Zhang, Xue, Cheng, Pan, Zhang, Tok, Antoniadis and Yeo39–Reference Guo, Han, Gong, Liu, Yang, Wang, Zhou, Pan, Zhang, Tok and Yeo41 The high-resolution TEM image of the TaN/HfO2/SiO2/Si stack on the GeSn (100) substrate shown in Figure 3a shows excellent interface quality and a uniform SiO2/Si interfacial layer. The Ge 2p 3/2 and Sn 3d 5/2 x-ray photoelectron spectroscopy spectra in Figure 3b show that Si2H6 passivation effectively suppresses the formation of Ge–O and Sn–O bonds. The GeSn surface is covered with a uniform Si layer that is several mono-atomic layers thick. The smallest EOT achieved so far using Si2H6 passivation is ∼1.2 nm. Mid-gap D it extracted by the charge pumping method is ∼2 × 1012 cm–2·eV–1.
(a) High-resolution cross-sectional transmission electron microscope image of TaN/HfO2 stack formed on a Si2H6-passivated Ge0.97Sn0.03 substrate. An ultrathin SiO2 was formed due to the partial oxidation of the Si passivation layer. The thickness of the HfO2 is 4.3 nm. (b) High-resolution x-ray photoelectron spectroscopy spectra reveal the bonding structure at the HfO2/SiO2/Si/GeSn interfaces. The symbols show the raw data, and the lines are obtained by fitting. Ge 2p 3/2 and Sn 3d 5/2 spectra show the suppression of Ge–O and Sn–O bonds, contributing to the improved interfacial quality. The existence of both Si–Si and Si–O bonds indicates that the Si passivation layer was partially oxidized. Reprinted with permission from Reference 41. © 2013 AIP Publishing LLC.
Ozone oxidation for GeSn surface passivation
A low-temperature ozone oxidation method for the formation of an interface passivation layer of GeOx and GeSnOx between a high-κ material and GeSn is presented in Reference 42. This is achieved by depositing ∼1 nm of ALD Al2O3, followed by in situ O3 oxidation at 400°C. The resulting gate stack containing an IL of GeSnOx on GeSn (6 at.% Sn) is shown in Figure 4a. This surface passivation scheme has been shown to achieve interface trap density in the 1011 cm–2 over the entire range of energies in the bandgap. Moreover, if GeSn is capped with a thin layer (∼2 nm) of Ge, controlled ozone oxidation results in an IL of GeOx on GeSn. This helps in further reduction of interface traps, as shown in Figure 4b–c.
(a) Ozone oxidation for formation of interface passivation layer of GeSnOx or GeOx. Transmission electron microscope image showing ∼2.6-nm-thick GeSnOx on GeSn (6% Sn). D it near the (b) valence band edge and (c) conduction band edge for samples with 6 at.% Sn and 8.5 at.% Sn stays in the low-1011 cm–2 range. Some of the samples also have a thin (∼2 nm) Ge cap. Controlled oxidation of thin Ge cap to form an interfacial control layer of GeOx is identified as the optimal route for GeSn surface passivation. Note: E V, valence band energy; E, trap energy within the bandgap; D it, interface state density. Reprinted with permission from Reference 42. © 2012 IEEE.
Low resistance contacts to doped Ge and GeSn
M-I-S contacts to n+ Ge
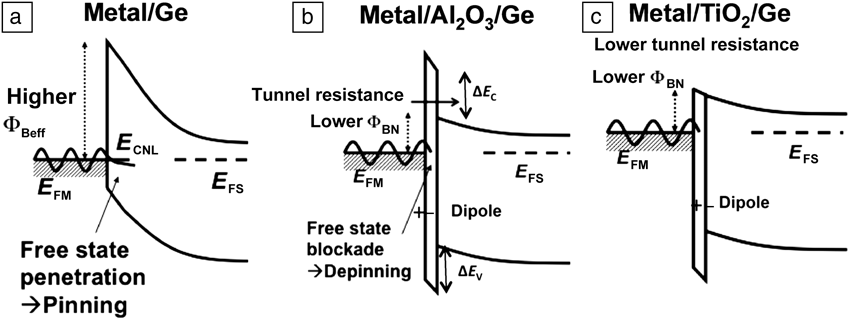
As device dimensions shrink, parasitic source/drain (S/D) resistance plays an increasingly important role in determining the overall device performance. This parasitic S/D resistance is largely dominated by the contact resistance and becomes a limiting factor to the drive current. The specific contact resistivity ρc of a metal-semiconductor (M/S) contact is dependent on the Schottky barrier height ΦBN (see Figure 5a) and the electrically active dopant density N at that interface. As shown in Figure 5a, the metal Fermi level is pinned near the Ge valence band, resulting in a high value of ΦBN and ρc. A possible method to reduce ρc is by increasing N to > 5 × 10¹⁹/cm3, thereby thinning the electron tunneling barrier and allowing more tunneling current. However, the inability to achieve high n-type dopant activation in Ge limits the usefulness of this approach.
Band diagram for (a) metal/Ge, (b) metal/Al2O3/Ge, and (c) metal/TiO2/Ge MIS contacts. Note: ΦBeff, effective Schottky barrier height; ΦBN, Schottky barrier height for electron tunneling; E FM, metal Fermi level; E CNL, charge neutrality level; E FS, Fermi level in the semiconductor; ΔE C, conduction band offset; ΔE V, valence band offset; MIS, metal-insulator-semiconductor. Reprinted with permission from Reference 48. © 2011 AIP Publishing LLC.
A more promising method to reduce ρc in metal/n +-Ge contacts is by inserting a thin dielectric between the metal and semiconductor with the aim of reducing the Schottky barrier height.Reference Connelly, Faulkner, Clifton and Grupp43 The ultrathin insulator allows the metal electron wave function to be attenuated in the insulator prior to penetrating the semiconductor, resulting in depinning the metal Fermi level. This method has been used to obtain low ΦBN in n +Ge and other semiconductors. Recent experiments have demonstrated Fermi level depinning by inserting thin insulating tunnel barriers such as Si3N4,Reference Connelly, Faulkner, Clifton and Grupp43 Ge3N4,Reference Lieten, Degroote, Kuijk and Borghs44 and Al2O3Reference Nishimura, Kita and Toriumi45 at the metal-semiconductor interface. However, these materials introduce additional tunneling resistance due to the large conduction band offset ΔE C between the insulator and semiconductor, as shown in Figure 5b. In this setting, low ρc to n-type semiconductors can be achieved only if ΔE C can be reduced. Simulations have shown that TiO2 and ZnO are the best candidates for this, as these insulators have near zero ΔE C to Ge and many other semiconductors, including Si, GaAs, and GaSb.Reference Roy, Lin and Saraswat46,Reference Shine and Saraswat47 Low ρc has been experimentally demonstrated using TiO2Reference Lin, Roy, Nainani, Sun and Saraswat48 and ZnOReference Manik, Mishra, Kishore, Ray, Nainani, Huang, Abraham, Ganguly and Lodha49 in the case of n-Ge doped to about 1019 cm–3. With heavier doping, it should be possible to depin the metal Fermi level without offering any tunneling resistance and provide ρc in the range of ∼10–8 ohm-cmReference Mistry, Allen, Auth, Beattie, Bergstrom, Bost, Brazier, Buehler, Cappellani, Chau, Choi, Ding, Fischer, Ghani, Grover, Han, Hanken, Hattendorf, He, Hicks, Huessner, Ingerly, Jain, James, Jong, Joshi, Kenyon, Kuhn, Lee, Liu, Maiz, Mcintyre, Moon, Neirynck, Pae, Parker, Parsons, Prasad, Pipes, Prince, Ranade, Reynolds, Sandford, Shifren, Sebastian, Seiple, Simon, Sivakumar, Smith, Thomas, Troeger, Vandervoorn, Williams and Zawadzki2.Reference Shine and Saraswat47
Nickel stanogermanide contact formation on p+Ge0.947Sn0.053
Nickel germanide (NiGe) is widely used as the S/D metal contact on p +Ge for Ge pMOSFETs. With the incorporation of Sn into Ge, nickel stanogermanide [Ni(Ge1–xSnx) or Ni(GeSn)] can be formed. Cross-sectional TEM images of a Ni(Ge1–xSnx)/p +Ge0.947Sn0.053 contact and a NiGe/p +Ge contact are shown in Figure 6a–b, respectively.Reference Han, Su, Zhou, Guo, Yang, Zhan, Wang, Wang, Wang, Xue, Cheng and Yeo50 Twenty nm of Ni consumed 43 nm of Ge0.947Sn0.053, forming 50 nm of Ni(Ge1–xSnx), which is very close to the consumption ratio of Ni and Ge during nickel germanidation. Ni(Ge1–xSnx) has the nickel monostanogermanide phase with sheet resistivity comparable to nickel monogermanide. In addition, the lattice constant of Ni(Ge1–xSnx) increased by 0.28%, as compared to NiGe due to the incorporation of Sn. Figure 6c shows the secondary ion mass spectrometry (SIMS) profiles of various elements obtained for the Ni(Ge1–xSnx)/p +Ge0.947Sn0.053 sample. A boron (B) peak is observed at the Ni(Ge1–xSnx)/p +GeSn interface and was found to be stronger than that at the NiGe/ p +Ge interface. This suggests a more pronounced dopant segregation effect in Ni(Ge1–xSnx)/p +GeSn as compared to that in NiGe/p +Ge. The more pronounced dopant segregation at the Ni(Ge1–xSnx)/p +GeSn interface, together with the smaller bandgap of Ge0.947Sn0.053 than that of Ge, leads to a reduced effective Schottky barrier height and an order of magnitude lower contact resistivity ρc in comparison with those for NiGe/p +Ge.Reference Han, Su, Zhou, Guo, Yang, Zhan, Wang, Wang, Wang, Xue, Cheng and Yeo50
Cross-sectional transmission electron microscope images of (a) Ni(Ge1–xSnx)/p +Ge0.947Sn0.053 contact and (b) NiGe/p +Ge contact. The contacts were formed at 350°C. (c) Secondary ion mass spectrometry profiles of various elements obtained for the Ni(Ge1–xSnx)/p +Ge0.947Sn0.053 sample. The Sn plateau indicates the uniform distribution of Sn in the Ni(Ge1–xSnx) layer. B segregation was observed in the Ni(Ge1–xSnx)/p +Ge0.947Sn0.053 sample and is more pronounced in comparison with NiGe/p +Ge. Reprinted with permission from Reference 50. © 2012 IEEE.
Performance benchmarking
In spite of the abundance of research reports on Ge-based MOSFETs, a comprehensive understanding of the physical mechanisms limiting inversion layer mobility in Ge n- and pMOSFETs remains elusive. Nonetheless, high-κ/Ge interfaces with low D it and small interface roughnessReference Zhang, Iwasaki, Taoka, Takenaka and Takagi36–Reference Takagi, Zhang and Takenaka38 are widely recognized as critical factors to obtain higher inversion-layer electron and hole mobilities through reduction in Coulomb scattering and interface roughness scattering. Si passivation is known to provide high hole mobility in Ge pMOSFETs, which is attributable to low D it as well as reduced interface scattering in the buried Ge channel.Reference De Jaeger, Bonzom, Leys, Richard, Van Steenbergen, Winderickx, Van Moorhem, Raskin, Letertre, Billon, Meuris and Heyns13,Reference Taoka, Harada, Yamashita, Yamamoto, Sugiyama and Takagi14,Reference Taoka, Mizubayashi, Morita, Migita, Ota and Takagi51 However, this Si passivation does not improve electron mobility in Ge nMOSFETs.
In contrast, surface passivation by Ge oxides has been found to enhance both electron and hole mobility. Also, similar to high-κ/Si gate stacks, the inversion-layer mobility tends to decrease when reducing the EOT. The electron and hole mobility in Ge n- and pMOSFETs with a variety of high-κ gate stacks are shown in Figure 7a–b, respectively.Reference Takagi, Zhang, Kim, Taoka, Yokoyama, Suh, Suzuki and Takenaka52,Reference Zhang, Huang, Lin, Taoka, Takenaka and Takagi53 The Ge n- and pMOSFETs with HfO2/Al2O3/GeOx/Ge exhibit significantly enhanced mobility, attributed to the sufficient passivation of Ge MOS interfaces by the GeOx ILs. The electron mobility in the HfO2/Al2O3/GeOx/Ge nMOSFETs with an EOT of 0.76 nm is comparable to the Si universal electron mobility and approaching the mobility of ∼20-nm-thick thermal oxidation GeO2/Ge n-MOSFETs.Reference Morii, Iwasaki, Nakane, Takenaka and Takagi26 For the HfO2/Al2O3/GeOx/Ge pMOSFETs with an EOT of 0.76 nm, hole mobility is much higher than that for Si universal and even higher than that in the thick thermal oxidation GeO2/Ge pMOSFETs.Reference Nakakita, Nakakne, Sasada, Takenaka and Takagi27
(a) Electron mobility of the Ge nMOSFETs (metal oxide semiconductor field-effect transistors) and (b) hole mobility of the Ge pMOSFETs with the HfO2 (2.2 nm)/Al2O3 (0.2 nm)/GeOx (0.35 nm)/Ge gate stacks, compared with those of the Ge MOSFETs having HfO2/Al2O3/Ge, HfO2/Ge, and 20-nm-thick GeO2/Ge gate stacks (solid black line). Si-universal mobilities are shown by the solid green line. In (a), the HfO2/Al2O3/GeOx/Ge gate stacks provide much higher electron mobility than HfO2/Al2O3/Ge and HfO2/Ge direct interfaces. Also, in the high N s region, the mobility is comparable or higher than the Si universal mobility and the mobility in thick GeOx. In addition, the Al2O3/GeOx/Ge stack with a post-deposition anneal (PDA) using atomic deuterium (D) shows higher electron mobility than Si-universal and the thick GeO2/Ge stack. In (b), the HfO2/Al2O3/GeOx/Ge stack achieves higher hole mobility than Si universal and the thick GeO2/Ge stack. These results indicate that the existence of GeOx interfaces with low D it is essential to higher electron and hole mobilities of Ge MOSFETs. Note: N s, inversion charge density; EOT, equivalent gate oxide thickness; PPO, plasma post-oxidation. Reprinted with permission from Reference 53. © 2013 IEEE.
These results strongly demonstrate that HfO2/Al2O3/GeOx/Ge gate stacks can realize high-performance Ge n- and pMOSFETs with minimal mobility expense under aggressive scaling of EOT. It is expected, on the other hand, that the present mobility is further enhanced through reduction in MOS interface roughnessReference Zhang, Lin, Yu, Takenaka and Takagi54,Reference Lee, Nishimura, Tabata, Lu, Zhang, Nagashio and Toriumi55 and interface defects near the band edge or inside the band.Reference Zhang, Huang, Lin, Takenaka and Takagi56 It has been found through Hall measurementsReference Zhang, Huang, Lin, Takenaka and Takagi56 that the decrease in free carriers due to trapping into those interface defects significantly reduces the effective mobility. Post-deposition annealing in atomic deuterium (D), generated by cracking D2 in heated W filaments, has led to a reduction in the interface states inside the conduction band and resulted in an increase in effective electron mobility,Reference Zhang, Lin, Yu, Takenaka and Takagi57 which is also shown in Figure 7a.
In comparison, with a Ge, GeSn-based device, research is still in its nascent stages, and only a very limited number of successful experimental demonstrations of GeSn channel MOSFETs have been reported in the literature.Reference Gupta, Chen, Magyari-Kope, Lin, Yang, Nainani, Nishi, Harris and Saraswat8–Reference Gupta, Huang, Kim, Sanchez and Saraswat10,Reference Gong, Han, Bai, Su, Guo, Yang, Cheng, Zhang, Zhang, Xue, Cheng, Pan, Zhang, Tok, Antoniadis and Yeo39–Reference Gupta, Vincent, Yang, Lin, Gencarelli, Lin, Chen, Richard, Bender, Magyari-Kope, Caymax, Dekoster, Nishi and Saraswat42,Reference Gupta, Vincent, Lin, Gunji, Firrincieli, Gencarelli, Magyari-Kope, Yang, Douhard, Delmotte, Franquet, Caymax, Dekoster, Nishi and Saraswat58–Reference Lieten, Maeda, Jevasuwan, Hattori, Uchida, Miura, Tanaka and Locquet62 With the exception of Reference 62, all other studies of carrier transport in GeSn MOSFETs have relied on the use of thin, pseudomorphic layers of GeSn grown on a Ge substrate or Ge-on-Si virtual substrate as the starting material. This is mainly due to the fact that such a growth method can achieve high-quality, defect-free GeSn with large Sn mole fraction. Due to the larger lattice constant of GeSn compared with Ge, as-grown pseudomorphic layers of GeSn are biaxially compressively strained, and pMOSFETs fabricated on these layers show higher hole mobilities than control (unstrained) Ge devices. Figure 8a shows improvement in the measured hole mobility over Ge for compressively strained GeSn pMOSFETs as a function of the channel Sn composition. Note that an increase in alloy Sn composition in GeSn layers grown pseudomorphically to Ge is accompanied by a proportionate increase in the channel compressive strain. As a comparison, the theoretical calculationsReference Riddet, Watling, Chan, Parker, Whall, Leadley and Asenov63 of hole mobility improvement in strained-Ge are also plotted in Figure 8a. The inversion channel hole mobility in GeSn increases with increasing Sn (and hence increasing compressive strain) and closely follows the expected hole mobility enhancement in strained Ge, implying that alloy scattering is not the dominant hole scattering mechanism in strained GeSn inversion layers for Sn% as high as 7%. Figure 8b shows the hole mobility as a function of inversion charge density for compressively strained GeSn pMOSFETsReference Gong, Han, Bai, Su, Guo, Yang, Cheng, Zhang, Zhang, Xue, Cheng, Pan, Zhang, Tok, Antoniadis and Yeo39–Reference Guo, Han, Gong, Liu, Yang, Wang, Zhou, Pan, Zhang, Tok and Yeo41 fabricated using the low-temperature Si2H6 passivation scheme.
(a) Calculated hole mobility enhancement in strained-Ge over relaxed-Ge as a function of in-plane biaxial strain (blue line). Also shown are experimental results (symbols) for hole mobility enhancement in strained GeSn pMOSFETs (metal oxide semiconductor field-effect transistors) over relaxed-Ge, as obtained in References 8–10. (b) Effective hole mobility in GeSn pMOSFETs fabricated using Si2H6 passivation for different surface orientations and Sn composition.Reference Gong, Han, Bai, Su, Guo, Yang, Cheng, Zhang, Zhang, Xue, Cheng, Pan, Zhang, Tok, Antoniadis and Yeo39–Reference Guo, Han, Gong, Liu, Yang, Wang, Zhou, Pan, Zhang, Tok and Yeo41 It is evident that an increase in channel Sn% (and hence an increase in compressive strain) increases the effective hole mobility. Note: ML, monolayers of Si passivation; μGeSn, hole mobility in GeSn pMOSFETs; μGe, hole mobility in Ge pMOSFETs.
Experimental investigationsReference Gupta, Vincent, Yang, Lin, Gencarelli, Lin, Chen, Richard, Bender, Magyari-Kope, Caymax, Dekoster, Nishi and Saraswat42,Reference Gupta, Vincent, Lin, Gunji, Firrincieli, Gencarelli, Magyari-Kope, Yang, Douhard, Delmotte, Franquet, Caymax, Dekoster, Nishi and Saraswat58,Reference Han, Su, Wang, Wang, Gong, Yang, Ivana, Guo, Guo, Zhang, Pan, Zhang, Xue, Cheng and Yeo59 aimed at comparing the inversion channel electron mobilities in GeSn and Ge nMOSFETs have not found GeSn to offer any significant benefit over Ge as the nMOSFET channel material. This poorer performance of GeSn nMOSFETs has been attributed to the comparatively lower quality of a high-κ/GeSn interface achievable using current techniques and the residual compressive strain in the GeSn layers lattice-matched to Ge. Nevertheless, it is speculated that nMOSFETs utilizing tensile-strained GeSn as the channel may show improvement in the electron mobility due to preferential conduction in the direct conduction band valley (Γ valley) that has low electron effective mass and high electron mobility.
A design for 7 nm FinFET CMOS: Materials-centric perspective
Compatibility with conventional Si technology is perhaps one of the most important practical advantages of Ge and GeSn-based devices. In addition, Ge and Sn-based group IV alloys significantly expand the design space beyond Si and SiGe and provide new tools for continued bandgap and stress engineering—all in a Si-compatible platform. Figure 9a shows this concept on the plot of bandgap versus lattice constant, along with one of the several possible choices for selecting CMOS channel and S/D materials.
(a) Bandgap versus lattice constant for the group IV materials: Si, SiGe, Ge, and GeSn. Practical constraints limit the maximum concentration of Sn to 8%. The plot also shows the material choices for the complementary metal oxide semiconductor design under consideration. Simulations comparing the ballistic saturation drain current (I D) for (b) strained-Si and GeSn (4% Sn) pMOSFET (metal oxide semiconductor field-effect transistor) and (c) strained-Si and Ge nMOSFET as a function of the parasitic source resistance R S. Strained Ge and GeSn MOSFETs show higher I D than Si. Note: S/D, source/drain. Reprinted with permission from Reference 64. © 2013 IEEE.
In a FinFET-based CMOS design proposed in References 64 and 65, the p-channel transistors are compressively strained and composed of GeSn (4% Sn) as the channel and boron-doped GeSn (8% Sn) as the S/D stressors. Likewise, the tensile-strained nMOSFETs are formed by a Ge channel and phosphorus-doped Si0.3Ge0.7 S/D. Both n and pMOSFETs utilize a common buffer layer, which is lattice matched to Ge. Process simulations of the standard gate-last process flow with in situ doped epitaxial re-growth of S/D regions and fin dimension expected in the 7 nm technology node reveals the average longitudinal stress in pMOSFET (nMOSFET) to be –1 GPa (+1 GPa). The drain current (I D) in the ballistic limit (no carrier scattering in the channel) for the proposed CMOS design is compared with strained-Si CMOS in Figure 9b–c. The results shown take into account the effect of parasitic S/D resistance in the FinFET. The channel to S/D spreading resistance, doped S/D sheet resistance, and contact resistance are lumped into a single parameter—source resistance R S. Note that in total S/D parasitic resistance, R ext = 2R S. For more details on device design and simulation results, see References 64 and 65.
The transistor off-current (I off) is a critical design metric. The CMOS design discussed previously relies on the use of high-mobility channel materials—strained-Ge and strained-GeSn—in order to achieve high on-current (I on). However, the bandgap of both Ge and GeSn is much smaller than that of Si, and this may cause excessive drain band-to-band tunneling (BTBT) leakage, thereby increasing the transistor off-current. Additionally, stress-induced bandgap shrinkage in Ge and GeSn may exacerbate this problem. However, for fin dimensions in the 7 nm technology node, a strong quantum confinement effect in the channel causes an increase in the effective channel bandgap E G. For a channel stress of ±1 GPa and 6 nm fin width, a net increase in E G as compared with unstrained, bulk material is observed, as shown in Figure 10a.Reference Gupta, Moroz, Smith, Lu and Saraswat64,Reference Gupta, Moroz, Smith, Lu and Saraswat65 This increase in E G is essential in reducing the BTBT leakage. Note that quantum confinement and channel stress have opposite effects on E G. The increase in E G due to confinement partly offsets the stress-induced reduction in E G.
(a) Effect of channel stress and fin width (W FIN) on channel bandgap (E G) for GeSn (4% Sn) pMOSFET (metal oxide semiconductor field-effect transistor) and Ge nMOSFET. Bandgap of unstrained, bulk material is shown as Bulk E G. At large stress, a net reduction in E G compared with the bulk is observed. (b) Calculated I D-V G characteristics of 7 nm FinFET complementary metal oxide semiconductor with W FIN = 6 nm showing that I off meets International Technology Roadmap for Semiconductors (ITRS) requirements. Note: I D, drain current; V G, gate voltage; I off, off-current; BTBT, band-to-band-tunneling; DIBL, drain-induced barrier lowering; SS, subthreshold slope; V DD, supply voltage; HP, high-performance technology; LSTP, low standby power technology. Reprinted with permission from Reference 64. © 2013 IEEE.
For the Ge/GeSn CMOS, the simulated drain current (I D) versus gate voltage (V G) characteristics shown in Figure 10b indicate that the BTBT-limited I off stays below the International Technology Roadmap for Semiconductors66 requirement for both high performance (100 nA/μm) and low standby power (10 nA/μm) technology at a supply voltage of 0.7 V. Continued scaling beyond 7 nm entails further reduction in fin width. The resulting enhancement of the confinement effect provides the additional E G bandwidth for incorporating larger stresses in the channel, boosting the I on at the same I off. Thus, this CMOS design illuminates a clear path for further technology scaling.
Summary
In this article, we reviewed the state-of-the art in Ge and GeSn-based transistor research for post-Si computing. For using Ge and GeSn as the MOSFET channel material, techniques that achieve high-quality high-κ/semiconductor interface and low resistance S/D contacts were presented. We also discussed one of the many possible CMOS solutions for future technology nodes that use Ge and GeSn as channel materials. From this discussion, it is evident that inclusion of Ge or GeSn expands the device design space beyond strained-Si and provides new tools for continued bandgap and stress engineering in a Si-compatible platform. Note that several combinations of S/D and channel materials may be contemplated depending upon the application requirements and practical constraints, and the CMOS solution presented here represents an exemplary demonstration of the bandgap and stress engineering capabilities of group IV elements—Si, Ge, and Sn. Furthermore, a practical realization of the Ge/GeSn CMOS design is contingent upon a successful implementation of several underlying technologies. In addition to the daunting process complexities involved in FinFET fabrication at the 7 nm technology node, the use of Ge and GeSn as channel materials introduces unique challenges that need to be addressed to preserve the feasibility of the proposed design.
The low solid solubility (<1%) of Sn in Ge, SiGe, and the resulting metastability of supersaturated solid solutions of Sn with Ge and SiGe raises concerns over the synthesis and subsequent processing of Sn-based group IV alloys. Overcoming these challenges has been an active area of materials research and motivated development of severalReference Vincent, Gencarelli, Bender, Merckling, Douhard, Petersen, Hansen, Henrichsen, Meersschaut, Vandervorst, Heyns, Loo and Caymax67–Reference Lieten, Seo, Decoster, Vantomme, Peters, Bustillo, Haller, Menghini and Locquet69 innovative, non-equilibrium growth techniques that achieve high-quality epitaxial GeSn layers. Furthermore, a recent study finds compressively strained GeSn with 10% Sn to withstand temperatures up to 450°C without showing any signs of degradation in material quality.Reference Chen, Huang, Gupta, Lin, Sanchez, Kim, Saraswat, Kamins and Harris70 A comprehensive study of the effect of strain and Sn composition on the maximum allowable thermal budget can greatly help in designing processes for GeSn device fabrication.
The presence of a large number of trap states at the high-κ/semiconductor interface is known to degrade subthreshold behavior, cause threshold voltage instability, and reduce the device drive current. The results presented previously represent significant progress in achieving superior quality high-κ/Ge and high-κ/GeSn interfaces. Extending these methods to nonplanar devices and arbitrary surface orientations forms an important module in Ge, GeSn FinFET fabrication. Lastly, the mitigation of parasitic S/D resistance is necessary to obtain high drive current, and a large S/D resistance may potentially erode the benefits of replacing strained-Si with Ge and GeSn as channel materials. Low-temperature (<450°C) epitaxial growth methods that achieve selective area deposition of highly doped SiGe and GeSn are critical modules in the scaled FinFET CMOS technology. Investigations into the growth kinetics and in situ dopant incorporation in SiGe and Si layers have been the subject of several reports.Reference Jang, Liao and Reif71–Reference Hartmann, Py, Barnes, Prévitali, Batude and Billon74 Hartmann et al.Reference Hartmann, Py, Barnes, Prévitali, Batude and Billon74 have shown that it is possible to achieve up to 9 × 1019 cm–3 of P doping in epitaxial SiGe. On the other hand, in situ B doping of GeSn remains a topic that requires more attention. Vincent et al.Reference Vincent, Gencarelli, Bender, Merckling, Douhard, Petersen, Hansen, Henrichsen, Meersschaut, Vandervorst, Heyns, Loo and Caymax67 have demonstrated B-doped GeSn (GeSn:B) containing up to 1.7 × 1019 cm–3 B but found competition between Sn and B incorporation during selective epitaxy of GeSn:B. Nevertheless, these challenges in low-temperature, selective epitaxy of SiGe:P and GeSn:B provide interesting avenues for further research.