Implications
The study supplies methods for calculating the net energy value of broiler diets and feedstuffs to be used by feed manufacturers.
Introduction
The expression of energy value of diets as net energy (NE) is widely used in ruminant and pig nutrition, whereas the NE expression is practically never used in poultry. In poultry, dietary energy value is expressed as metabolisable energy (ME), which is preferred to digestible energy (DE) because, in birds, faeces and urinary losses are voided together through cloaca. In most cases, ME is expressed as apparent metabolisable energy (AME) corrected to zero nitrogen retention (AMEn).
Reviews on the efficiency of ME for NE in poultry were performed in 1974 by De Groote and in 1999 by Pirgozliev and Rose. It appears from these reviews that the number of studies devoted to NE calculation was much more limited in poultry than in ruminants or pigs. In ruminants or pigs, the interest in using NE instead of DE or ME comes from the fact that the NE/DE or NE/ME ratios are affected by the extent of fibre digestion (Jarrige, Reference Jarrige1980; Just et al., Reference Just, Fernandez and Jorgensen1983; Noblet et al., Reference Noblet, Fortune, Shi and Dubois1994). In poultry, the extent of fibre digestion is very low (Carré et al., Reference Carré, Derouet and Leclercq1990), which would decrease variations in NE/ME ratios and thus, would reduce the interest of an NE system.
We conducted a study in broiler chickens to supply reliable data allowing both AMEn and NE values to be predicted and evaluated, using 30 different diets. A first publication (Carré et al., Reference Carré, Lessire and Juin2013) reported in vivo measurements and predictions of AMEn values. In the current publication, in vivo measurements, calculations and predictions of NE values are reported using the same set of experimental data (Carré et al., Reference Carré, Lessire and Juin2013). NE values were determined with the method based on body analyses, measuring protein and lipid depositions from 21 to 35 days. The component of NE associated with maintenance was calculated on the basis of mean metabolic weight using a coefficient obtained in an experiment (Van Milgen et al., Reference Van Milgen, Noblet, Dubois, Carré and Juin2001; Noblet et al., Reference Noblet, Dubois, Labussière, Carré and van Milgen2010) conducted with birds from the same commercial strain.
Material and methods
Bird management
The experiment was conducted in 1996. AMEn and NE values of 30 diets were measured in male broiler chickens from 21 to 35 days of age. AMEn and NE determinations were carried in the same trials, but they were not measured in the same birds. Birds for measuring AMEn and NE values were placed in two different rooms having the same environmental conditions. Diets, bird management, housing system and results of AMEn data were previously reported (Carré et al., Reference Carré, Lessire and Juin2013). The whole experiment was divided into three successive trials at 4 weeks interval. In each trial, a total of 400 male broiler chickens (IJV 915, ISA) were used. Among these 400 broiler chickens, 180 birds were selected at 21 days of age in order to obtain 20 groups of 8 birds homogeneous for their BW and a group of 20 birds showing similar mean BWs (680 g). This group of 20 birds was killed by cervical dislocation for measurement of initial body composition. Among the 20 other groups, 10 were used for measurements of NE and growth performances, each group being randomly allocated to a specific experimental diet. The last 10 groups received the same diets for measurements of AMEn and digestibilities (Carré et al., Reference Carré, Lessire and Juin2013). Each bird was placed at random in individual wire cages (44 cm length, 33 cm width and 50 cm height) supplied with individual feeder and drinker, in two environmentally controlled rooms (a room for ME and another for NE determinations), as previously described by Carré et al. (Reference Carré, Lessire and Juin2013).
Measurements of NE values and growth performances
Each bird assigned to NE determination was weighed at the beginning (21 days) and the end of the experiment (35 days). Birds were ad libitum fed and individual feed intakes were measured on a feed dry matter (DM) basis. NE values were determined using the body analysis method. At 35 days, birds were killed by cervical dislocation, feathers were removed and weighed, feathers and carcasses were frozen (−20°C). Then, each frozen carcasses were first cut in small pieces with an electric band saw and ground with an electric table top meat grinder. Ground carcasses were freeze-dried and individually analysed for nitrogen (Kjeldahl method) and lipids, with no acidic treatment before the lipid extraction by petroleum ether (Carré et al., Reference Carré, Lessire and Juin2013). A pooled sample of feathers was also analysed for their nitrogen content. Total body nitrogen content was obtained by adding nitrogen from feathers and carcass. The 20 birds killed at 21 days were analysed in the same way. The relationships between body composition and BW measured at 21 days were used to evaluate the initial body composition of birds killed at 35 days. For each bird killed at 35 days, the lipid and nitrogen body accretions from 21 to 35 days were deduced from BW and body composition at 21 days and 35 days.
Diets
As previously reported (Carré et al., Reference Carré, Lessire and Juin2013), the 30 experimental diets were formulated in order to obtain independent variations of proteins, lipids, starch, available sugars (sucrose and glucose) and fermentable sugars (α-galacto-oligosaccharides and lactose). Calculated AMEn values (adult cockerel) ranged from 10.48 to 13.76 MJ/kg (as-fed) and calculated CP from 16.0% to 26.5% (as-fed). Diets differed between trials, except diets 11.1, 11.2 and 11.3 used in trial 1, 2 and 3, respectively. Diets were attributed to trials in such a way that similar mean diet compositions were obtained for each trial. Except for diet 26, amino acids were formulated on the basis of ratios to CP (Carré et al., Reference Carré, Lessire and Juin2013), not to ME, with the limiting amino acid being either lysine (minimum ratio to CP: 0.046) or sulphur amino acids (minimum ratio to CP: 0.035), which gave an ideal protein content of CP of about 70% for each diet. Diet 26, a low protein diet formulated as diet 6, was supplemented with pure amino acids on the basis of ratios to ME. All diets were distributed as pellets. Diets were analysed as previously described (Carré et al., Reference Carré, Lessire and Juin2013).
Calculations
The AME value of diets was the mean in vivo AMEn value previously measured (Carré et al., Reference Carré, Lessire and Juin2013), corrected by the addition of the urinary energy equivalent to the measured body nitrogen gain (0.0344 MJ/g nitrogen; Hill and Anderson, Reference Hill and Anderson1958) related to feed intake from 21 to 35 days. The coefficients expressing the gross energy value of body proteins (23.69 MJ/kg) and lipids (39.18 MJ/kg) were issued by Znaniecka (Reference Znaniecka1967). The coefficient expressing the basal metabolism measured as the activity-free fasting heat production (0.50 MJ/kg BW0.60/day) was obtained from a previous experiment (Van Milgen et al., Reference Van Milgen, Noblet, Dubois, Carré and Juin2001; Noblet et al., Reference Noblet, Dubois, Labussière, Carré and van Milgen2010) conducted in 2000 with broilers from the same genetic cross. The NE value of diets was calculated as follows for each bird, using individual data for each parameter of equation:
 $$\eqalign{NE\left( {MJ/kg} \right) = [14{\times}0.50\left( {BW_{1} ^{{0.60}} {\plus}BW_{2} ^{{0.60}} } \right)/2{\plus}23.69{\rm }PD \cr \quad{\plus}39.18{\rm }LD]/FI_{t} $$
where 14 is the number of days, BW1 the BW (kg) at 21 days, BW2 the BW (kg) at 35 days, PD the protein deposition (kg) from 21 to 35 days, LD the lipid deposition (kg) from 21 to 35 days and FIt the total feed intake (kg) from 21 to 35 days.
Statistical analyses
Statistical analyses were performed using the SuperAnova software (1989 to 1991, version 1.11, Abacus Concepts Inc., Berkeley, CA, USA). The analyses testing the diet effect were conducted by adding the trial effect in models and by considering the diet effect as being nested in the trial effect.
For regressions with no intercept, R 2 values were calculated as [1−r.s.d.2/σ 2 y ], with r.s.d. and σ 2 y being the residual standard deviation of the regression equation and the variance of the dependent variable, respectively. Trial effects were estimated in regression calculations by adding trial effect in regression models with intercept; thereafter, the dependent variable was corrected according to the estimations of trial effect and the regression calculation was conducted again with the same scheme without including the trial effect.
Results
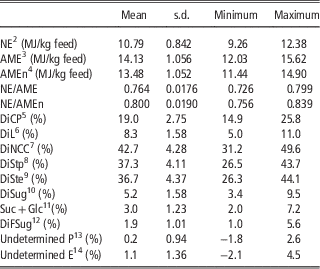
Table 1 shows the variations in energy values and contents of digestible components among the 30 diets. Mean NE and AMEn values displayed the same CV (0.078) and varied within similar relative ranges. Regarding contents of digestible components, absolute variations were the highest for digestible starch and digestible non cell-wall carbohydrates (17% and 18%, respectively). Absolute variations in digestible proteins and digestible lipids represented 11% and 6%, respectively, and, for digestible sugars, they were close to 5%. Contents of undetermined components were generally very low, with values rather close to 0% (Table 1).
Energy valuesFootnote 1 and digestible component contentsFootnote 1 of diets (mean, s.d., minimum and maximum values for the 30 experimental diets) measured in broiler chickens (IJV 915, ISA)

1 Data expressed on feed dry matter basis. AMEn values, crude component contents and digestibilities were shown for each diet in a previous publication (Carré et al., Reference Carré, Lessire and Juin2013).
2 Net energy (NE) value of diets, measured with the body analysis method conducted from 21 to 35 days of age, with eight birds per diet (r.s.d.=0.444).
3 Apparent metabolisable energy value of diets calculated from AMEn by the addition of the urinary energy equivalent to the body nitrogen gain.
4 AME corrected to zero nitrogen retention, measured (together with digestibilities) from 27 to 31 days of age. NE and AMEn experiments were conducted in the same time, but not with the same individual birds.
5 Apparent digestible CP.
6 Digestible lipids B (acidic treatment before extraction).
7 Digestible non cell-wall carbohydrates. Non cell-wall carbohydrates=100−N×6.25−Lip. B−WICW−Ash; WICW=water-insoluble cell-wall.
8 Digestible starch P (Polarimetric method).
9 Digestible starch E (DMSO-enzyme method).
10 Digestible total sugars (reducing sugar method).
11 Sucrose+glucose.
12 Digestible fermentable sugars (lactose and α-galacto-oligosaccharides).
13 100−N×6.25−Lip. B−Starch P−total reducing sugars−WICW−Ash.
14 100−N×6.25−Lip. B−Starch E−Sucrose−Glucose−Fermentable Sugar−WICW−Ash.
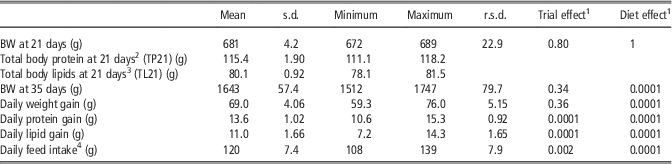
Table 2 shows the distribution of data used for calculating NE values. Despite rather wide variations in diet compositions, BW at the end of the experimental period (35 days) did not show great variations between diets with 14% variation between minimum and maximum mean diet values. Protein and lipid depositions showed much higher variations, especially lipids, than final BW (Table 2).
Data used for NE calculations: BW, weight gain, protein and lipid depositions, and feed intakes in broilers from 21 to 35 days (3 trials, 30 different diets with 10 diets/trial and 8 broilers/diet; n=240)

Mean, s.d., minimum and maximum are calculated on the basis of mean diet values.
1 P values. Diet effect was nested in trial effect.
2 Individual values deduced from 20 other birds from each trial according to the following regression lines: TP21=0.247 BW−55.0 (R 2=0.70); TP21=0.136 BW+24.5 (R 2=0.55); TP21=0.138 BW+21.9 (R 2=0.58); for trials 1, 2 and 3, respectively.
3 Individual values deduced from 20 other birds from each trial according to the following regression lines: TL21=0.143 BW−18.0 (R 2=0.14); TL21=0.175 BW−39.7 (R 2=0.18); TL21=0.068 BW+34.5 (R 2=0.12); for trials 1, 2 and 3, respectively.
4 Dry matter basis.
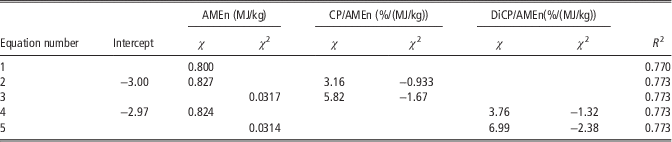
When calculating the multiple regressions predicting NE using AMEn as independent variable (Table 3), the only feed characteristics that were observed to improve predictions were the CP/AMEn or ((digestible CP)/AMEn) ratios (Table 3). Moreover, additions of these variables marginally improved R 2 values (Table 3). The significant effect of trials detected with these regression calculations (Table 3) showed the same pattern in each calculation, with NE values that were lowered by about 0.39 MJ/kg DM in trial 2 compared with other trials.
Regression calculations (n=240) predicting individual in vivo net energy (NE) valuesFootnote 1 of diets (MJ/kg) in 4w broilers, using mean AMEnFootnote 2 values of diets (MJ/kg), CP/AMEnFootnote 3 and DiCP/AMEnFootnote 3 ratios

All dietary energy values and dietary contents were expressed on dry matter basis.
1 For each regression model, NE values were corrected for the trial effect previously determined in the regression models having the trial effect added in models (trial 1: from −0.130 to −0.115; trial 2: from +0.258 to +0.265; trial 3: from −0.142 to −0.130). Coefficients assigned to AMEn and AMEn2 were highly significant (P=0.0001). Coefficients assigned to other variables were also highly significant (P=0.0001) except in equations (2) and (4) (0.037<P<0.049). Models were all significant (P=0.0001). r.s.d. ranged between 0.451 and 0.454.
2 AMEn values (Carré et al., Reference Carré, Lessire and Juin2013) were measured in the same time as NE values, but not with the same individual birds.
3 Ratio of CP (%) or apparent digestible protein content (DiCP, %) to AMEn value (MJ/kg) of diets.
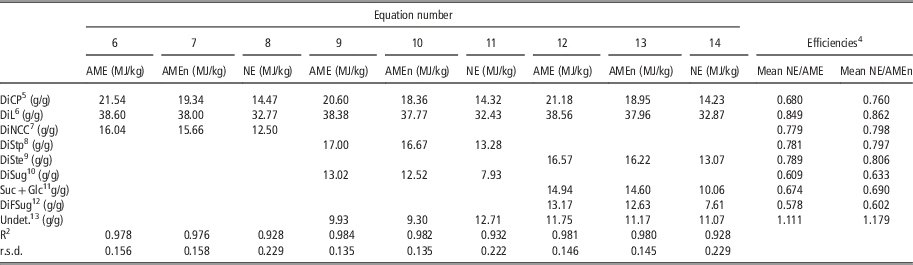
The regressions calculating NE and ME values of diets as functions of digestible components were performed with the same schemes in order to calculate the ratios of NE to ME to be assigned to each digestible components (Table 4). The dietary content of water-insoluble cell-wall (WICW) did not appear in these schemes as its coefficient was not significant when it was added. The three prediction schemes differed for the expression of carbohydrate fractions. NE/ME ratios for protein and lipids varied very little between the three different prediction schemes. Mean NE/AME and NE/AMEn ratios were 0.680 and 0.760 for proteins, 0.849 and 0.862 for lipids, respectively. For carbohydrate fractions, the differences between NE/AME and NE/AMEn ratios were slightly more pronounced than for lipids. The mean NE/ME ratios were 0.793, 0.621, 0.682 and 0.590 for starch, total sugars, sucrose+glucose and fermentable sugars, respectively. For non cell-wall carbohydrates, the mean NE/ME ratio was 0.788 (Table 4).
Regression calculations without interceptFootnote 1 (n=30) predicting mean in vivo AMEFootnote 2 , AMEnFootnote 2 and NEFootnote 2 values of diets (MJ/kg) in 4w broilers, using mean digestible nutrient contentsFootnote 3 , and calculations of efficiencies of ME for NE

All dietary energy values and contents are expressed on dry matter basis.
1 NE values were corrected for the trial effects previously determined in the regression models having the trial effect added in models: −0.07, +0.23, −0.15 (equation scheme number 8); −0.07, +0.23, −0.16 (equation scheme number 11); −0.06, +0.22, −0.15 (equation scheme number 14); for trial 1, 2 and 3, respectively. AME and AMEn values were not affected by trial effect. Coefficients were all highly significant (P=0.0001), except for the coefficients of sugar components (0.004<P<0.086) and ‘undetermined’ (0.0001<P<0.022). Models were all significant (P=0.0001).
2 AME=apparent metabolisable energy; AMEn=AME corrected to zero nitrogen retention; NE=net energy. AMEn values (Carré et al. Reference Carré, Lessire and Juin2013) were measured in the same time as NE values, but not with the same individual birds.
3 Data were those shown in the study published by Carré et al. (Reference Carré, Lessire and Juin2013). For starch P, total reducing sugars and non cell-wall carbohydrates, the digestibility values used for calculation of digestible nutrient contents were obtained by using starch E and fermentable sugars digestibilities, and by considering sucrose and glucose 100% digested components.
4 Efficiencies assigned to nutrients were calculated as ratios of their NE coefficient to their ME coefficient.
5 Apparent digestible CP.
6 Digestible lipids B (acidic treatment before extraction).
7 Digestible non cell-wall carbohydrates. Non cell-wall carbohydrates=1−N×6.25−Lip.B−WICW−Ash; WICW=water-insoluble cell-wall.
8 Digestible starch P (Polarimetric method).
9 Digestible starch E (DMSO-enzyme method).
10 Digestible total sugars (reducing sugar method).
11 Sucrose+glucose.
12 Digestible fermentable sugars (lactose and α-galacto-oligosaccharides).
13 Undetermined=(1−N×6.25−Lip. B−St. P−total sugars−WICW−Ash) or (1−N×6.25−Lip. B−St. E−Sucr−Glc−Fermentable Sugar−WICW−Ash).
Discussion
In the current experiment, the proportion of energy deposited as lipids varied in a wide range between diets (44.5% to 69.1%). Moreover, no significant relationship (R 2=0.004; P=0.96; n=240 individuals) was observed between lipid and protein deposition. Thus, the regressions found for predicting NE values (Tables 3 and 4) corresponded to a wide range of metabolic situations.
As previously reported by Hill and Anderson (Reference Hill and Anderson1958), in vivo NE determinations showed evidences of rather low precision, as shown by the rather high r.s.d. value found for NE values (0.444 MJ/kg DM; Table 1). Trial effects on NE were found whatever the regression calculations (Tables 3 and 4) and showed with very similar patterns in each regression. As rearing conditions were very similar in each trial, these trial effects on NE probably came from difference in chicken metabolism between trials. For instance, difference in bird activity between trials could produce difference in heat production and, hence, difference in NE values between trials.
The mean diet NE/AME ratios (Table 1) were in the range of values previously reported by Farrell (Reference Farrell1974) (0.56 to 0.87). The general mean NE/AME ratio (0.764; Table 1) was slightly lower than the mean NE/AME ratio (0.814) found by Geraert et al. (Reference Geraert, MacLeod, Larbier and Leclercq1990) in growing chicks from two different genetic lines fed with various diets and higher than the mean NE/AME ratio (0.705) more recently reported by Yang et al. (Reference Yang, Iji, Kocher, Thomson, Mikkelsen and Choct2008).
Investigations in the predictions of NE based on AME or AMEn values failed in finding additional feed characteristics that would improve clearly the NE prediction (Table 2). This has to be associated probably with the rather low variations observed in NE/AME and NE/AMEn ratio between diets (CV of 0.023 and 0.024 between diets, respectively; Table 1).
These low variations in NE/AME and NE/AMEn ratio between diets were in agreement with a previous experiment conducted by Farrell in Reference Farrell1976 in growing chicks, characterised by very small variations in heat production parameters between diets despite great differences in diet composition. Other studies also showed that NE/ME ratio was not affected by diet composition in broilers, even when variations in dietary protein content and composition were large (Geraert et al., Reference Geraert, MacLeod, Larbier and Leclercq1990; Macleod, Reference MacLeod1997; Swennen et al., Reference Swennen, Janssens, Decuypere and Buyse2004).
The proportion of NE derived from the ME fraction originating from fermentative digestion was shown to be low in pigs, compared with other ME sources (Just et al., Reference Just, Fernandez and Jorgensen1983; Noblet et al., Reference Noblet, Fortune, Shi and Dubois1994). Thus, dietary fibre content and digestion were important sources of variation in the NE/ME ratio of diets and feedstuffs for pigs (Noblet et al., Reference Noblet, Fortune, Shi and Dubois1994). In chickens, fibres cannot represent a noticeable source of variation in the NE/ME ratio, because of the low digestibility of fibres in chickens (Carré et al., Reference Carré, Derouet and Leclercq1990). This was confirmed by the fact that the WICW parameter was observed to be non significant when introduced in the direct equations predicting ME or NE values (Table 4). This probably explained in part the low variability of the NE/ME ratios observed in the current experiment (Table 1). The absence of fibre effect on NE/ME ratios in chickens automatically implies that the NE/ME ratios assigned to various feedstuffs vary less in chickens than in pigs.
The current experiment was characterised by the use of pelleted diets with constant amino acid composition of their proteins (except diet 26; Carré et al., Reference Carré, Lessire and Juin2013) and ad libitum feeding. It is possible that other conditions would have changed the results. However, the diet 26 formulated with a high amino acid concentration in their proteins (Carré et al., Reference Carré, Lessire and Juin2013) showed NE/AME and NE/AMEn ratios (0.744 and 0.775) that did not significantly differ from the ratios obtained with the diet 6 (0.769 and 0.796) formulated with a low amino acid concentration in proteins, as a counterpart of diet 26 (Carré et al., Reference Carré, Lessire and Juin2013).
The ad libitum feeding system used in the current experiment is a common practice in broiler experiments, whereas feed is often distributed as a limited meal in other animal species. It is not excluded that the nutritional physiological processes differ between ad libitum and meal feeding systems, because ad libitum fed animals may eat up to a limit corresponding to some physiological limitations (for instance, heat production or lipid deposition) or corresponding to a precise body requirement. In case of meal feeding, the nutritional physiology may proceed according to an economical efficiency process, which is rather different.
As the cross correlations between contents of digestible components were low (Carré et al., Reference Carré, Lessire and Juin2013), sound values can be expected for the coefficients appearing in multiple linear regressions combining these components (Table 4). The values for NE/AME ratios assigned to proteins, lipids and non cell-wall carbohydrates were found to be 0.680, 0.849 and 0.779, respectively (Table 4). These values were in rather good agreement with previous values (De Groote, Reference De Groote1974) with, however, less variation between them compared with those proposed by De Groote in Reference De Groote1974 (0.60, 0.90 and 0.75, respectively). Among digestible carbohydrates, fermentable sugars showed the lowest efficiency of their ME value, which is in agreement with previous results found in growing pigs that also showed low efficiency for fermentable carbohydrates such as hemicelluloses (Noblet et al., Reference Noblet, Fortune, Shi and Dubois1994). Thus, total sugars showed a rather low efficiency compared with starch, with a difference (0.17; Table 4) that was somewhat higher than that observed in growing pigs (0.09; Noblet et al., Reference Noblet, Fortune, Shi and Dubois1994). For soybean meal, a feedstuff rich in α-galacto-oligosaccharides, it can be calculated from Table 4 that the replacement of these fermentable sugars by sucrose with genetic selection (Hagely et al., Reference Hagely, Palmquist and Bilyeu2013) would increase the NE/AMEn ratio of this feedstuff by 0.0045.
The NE/ME ratios appearing for undetermined components were rather high (Table 4). However, their reliability was low as undetermined component contents were low and varied little.
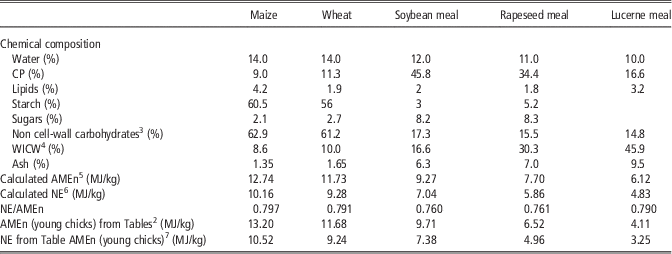
As in vivo NE determinations require time-consuming and costly experiments, NE estimation of feedstuffs for practical use is often proposed to be obtained by calculation. The calculation method shown in the current publication was similar to that proposed by De Groote (Reference De Groote1974) with, first, the calculation of the NE/AMEn ratio using the efficiency coefficients of nutrients shown in Table 4 and, then, application of this ratio to the actual AMEn value of feedstuffs. Table 5 shows examples of calculations of NE/AMEn ratios based on crude component contents. The first step consisted in calculating AMEn and NE values with direct equations (direct equations are based on available nutrients), the NE direct equations being derived from the AMEn direct equations by correcting their coefficients with the NE/ME ratios assigned to nutrients. Then, the NE/AMEn ratio to be applied for a feedstuff was obtained with the NE and AMEn values calculated with the direct NE and AMEn equations. Finally, the latter ratio was applied to the AMEn values obtained from a composition table (Table 5).
Examples of calculation of NEFootnote 1 value of feedstuffs from their AMEnFootnote 1 value and chemical compositionFootnote 2 (as-fed basis)

1 NE=net energy; AMEn=apparent metabolisable energy corrected to zero nitrogen retention.
2 AMEn values and chemical compositions were taken from INRA composition Tables (INRA, 1984; Larbier and Leclercq, Reference Larbier and Leclercq1992) and from Carré (Reference Carré2002).
3 Non cell-wall carbohydrates=100−Water−CP−Lipids−WICW−Ash.
4 Water-insoluble cell-wall.
5 Equation (18) from Carré et al. (Reference Carré, Lessire and Juin2013): calculated AMEn=0.164 CP+0.310 Lipids+0.162 Starch+0.079 Sugars. For lucerne meal, equation (21) from Carré et al. (Reference Carré, Lessire and Juin2013): AMEn=0.183 CP+0.315 Lipids+0.140 non cell-wall carbohydrates.
6 Calculated NE=0.164×0.760 CP+0.310×0.862 Lipids+0.162×0.797 Starch+0.079×0.633 Sugars. For lucerne meal: NE=0.183×0.760 CP+0.315×0.862 Lipids+0.140×0.798 Non cell-wall carbohydrates. NE correcting coefficients were those shown in Table 5.
7 NE=(AMEn from Tables)×(NE/AMEn).
The NE/AMEn ratios could also be calculated with a better accuracy on the basis of digestible component contents using predicting equations from Table 4, provided that digestibility values are known.
In conclusion, NE/AMEn ratios were calculated to be 0.760, 0.862, 0.798 and 0.806 for CP, lipids, non cell-wall carbohydrates and starch, respectively. A value of 0.680 was obtained for the NE/AME ratio assigned to proteins. The lowest NE/AMEn ratio (0.602) was observed for fermentable sugars (lactose and α-galacto-oligosaccharides). It was explained how these ratios could be used in practice to calculate NE value of feedstuffs. Regression calculations showed that the NE values assigned to individual birds (n=240) could also be predicted with diet AMEn values (NE=0.80 AMEn; R 2=0.770) or with an equation combining AMEn value and CP/AMEn ratio (R 2=0.773). The latter ratio was found to be the only additional parameter that was significant when added in the NE regression scheme based on AMEn.
Acknowledgements
This study was supported by a grant from Fonds SYPRAM (funding coming from companies suscribing to ‘Association pour le Maintien de l’Elevage en Bretagne’ (AMEB), ‘Syndicat National des Industriels de la Nutrition Animale’ (SNIA) and ‘Fédération Nationale des Coopératives de Production et d’Alimentation Animales’ (SYNCOPAC)) (Broiler Net Energy project, October 1996 to October 1998). Special thanks to the companies which participated in the chemical analyses of diets: CCPA, Celtic, Sanders and UFAC. Authors are grateful to Joelle Gomez, Solange Guillaumin and Jean-Marc Hallouis (INRA, Nouzilly), and to Jean-François Gobin and his team (INRA, Le Magneraud) for their excellent technical assistance. We would like to thank Dr Jean Simon for his participation in the editing of the manuscript.