INTRODUCTION
One sixth of the human population does not have reliable access to decent food (FAO [Food and Agriculture Organization of the United Nations] 2009). Although there was already an overall increase in hunger relative to the 1990s, the hungry increased by nearly 100 million people in 2008 alone, as an aftermath of the economic crises (FAO 2008, 2009). However, while the number of undernourished people increased from 817 to 830 million between 1990–1992 and 2005–2007, the proportion of undernourished people decreased from 20% to 16% in the same period (UN [United Nations] 2010a). The 2010 Global Hunger Index (GHI) of the International Food Policy Research Institute (IFPRI), which is partly based on proportion of undernourished people, declined globally by c. 25% relative to the 1990 value (Grebmer et al. Reference Grebmer, Ruel, Menon, Nestorova, Olofinbiyi, Fritschel, Yohannes, Oppeln, Towey, Golden and Thompson2010). The 2010 GHI is based on data over 2003–2008 and includes two other indicators of under-nutrition: the proportion of children under five who are underweight, and the child mortality rate.
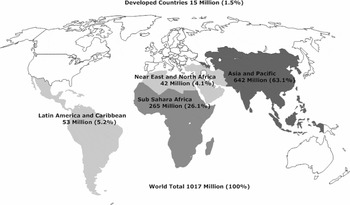
About 89% of world hunger is concentrated in Asia and the Pacific (Fig. 1), comprising 63% of world hunger, and Sub-Saharan Africa, accounting for 26% (FAO 2008, 2009). South Asia and Sub-Saharan Africa have the highest levels of hunger (Grebmer et al. Reference Grebmer, Ruel, Menon, Nestorova, Olofinbiyi, Fritschel, Yohannes, Oppeln, Towey, Golden and Thompson2010). More than half of the Asia and Pacific proportion of world hunger is in China and India, respectively with 127 and 231 million undernourished people, equivalent to 10% and 20% of each country's total population (FAO 2009), and decreases in the GHI relative to 1990 (Grebmer et al. Reference Grebmer, Ruel, Menon, Nestorova, Olofinbiyi, Fritschel, Yohannes, Oppeln, Towey, Golden and Thompson2010).
World distribution of food insecurity, highlighting four major regions that correspond to areas with high numbers of undernourished people (figures shown are millions people and percentage of world total). Data from FAO (2009).

Impediments to improving food security relate to food production and environmental conditions (for example climate, water or soils), human factors such as lack of infrastructure (for example irrigation, roads and food storage), lack of agro-biotechnology (such as seeds of water-efficient crops) and inadequate sociopolitical systems (for example fair trade, food justice, governance and policy). Requirement of an interdisciplinary (ID) approach for comprehensive examination of such impediments is exemplified by the sustained efforts of FAO, IFPRI and the UN World Food Programme (WFP 2009), the World Bank (World Bank 2009), the International Water Management Institute (IWMI) (Castillo et al. Reference Castillo, Namara, Ravnborg, Hanjra, Smith, Hussein, Béné, Cook, Hirsch, Polak, Vallée, Koppen and Molden2007), Intergovernmental Panel on Climate Change (IPCC Reference Parry, Canziani, Palutikof, van der Linden and Hanson2007a) and by recent reviews (Ziervogel & Ericksen Reference Ziervogel and Ericksen2010).
Human activities to produce food typically involve environmental change, affecting environmental conditions and natural resources needed for food production, and this feedback can make food production unsustainable. Major environmental challenges to sustaining food production include: reduction of cropland due to urbanization, increasing soil erosion, desertification, global climate change, fall of water tables and aquifer depletion (Brown Reference Brown2005; Foley et al. Reference Foley, DeFries, Asner, Barford, Bonan, Carpenter, Chapin, Coe, Daily, Gibbs, Helkowski, Holloway, Howard, Kucharik, Monfreda, Patz, Prentice, Ramankutty and Snyder2005). Poverty and lack of access to food are as important as limited food availability in determining food insecurity (von Braun Reference von Braun1995; Scanlan Reference Scanlan2001). Areas with the greatest water loss and land degradation correspond closely with those highest in rural poverty and food insecurity (deVries et al. Reference deVries, Acquay, Molden, Scherr, Valentin and Cofie2003).
Can the Earth produce enough food to feed the global human population over the long term, or more specifically how many people can the Earth sustain and at what level of food security? This is an inherent ID question because it involves interactions of both environmental and social aspects, as exemplified in recent FAO, IFPRI and World Bank reports (FAO 2009; World Bank 2009; Grebmer et al. Reference Grebmer, Ruel, Menon, Nestorova, Olofinbiyi, Fritschel, Yohannes, Oppeln, Towey, Golden and Thompson2010). Answering this question requires a quantitative assessment of how much food can be produced under given constraints of natural resources using human adaptation capacity and potential to develop technological solutions to growing more food (Scanlan Reference Scanlan2001).
ID science has driven the evolution of some of today's agricultural disciplines, such as agronomy, crop science, agricultural soil science and agricultural economics (Brown Reference Brown1983), that evolved at the frontier between plant biology, soil science, climatology, meteorology and economics among others (Lélé & Norgaard Reference Lélé and Norgaard2005). Enhanced ID collaboration is required, particularly for achieving sustainable environmental quality while improving productivity of agricultural systems, especially interaction between ecological, agricultural and social sciences (Brussaard et al. Reference Brussaard, Caron, Campbell, Lipper, Mainka, Rabbinge, Babin and Pulleman2010). This interaction occurs in agricultural schools, but there is increasing pressure for more specialized research. ID fields such as ecological economics, agro-ecology and landscape ecology are already responding to those challenges (Moss Reference Moss2000; MacLeod & McIvor Reference MacLeod and McIvor2006), but further linking of natural sciences with social sciences, engineering and technology is needed.
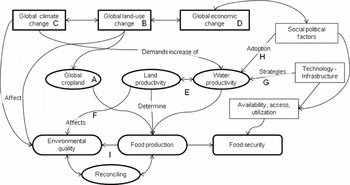
Many components and interactions compound the nexus between food security and the environment (Fig. 2). Major determinants of food production are global croplands (Fig. 2, A) and land and water productivity (Fig. 2, E), and these are influenced by the ongoing global climate, land-use and economic change processes (Fig. 2, B, C, and D). Food production is a major factor in food security, but human factors in social systems, technology and infrastructure directly affect food security. These aspects are not fully covered in this review; rather, I focus on opportunities to increase food production via increased water productivity through technology (Fig. 2, G) and on the adoption of these opportunities by farmers (Fig. 2, H). Importantly, I review proposed strategies for reconciling food production and environmental quality (Fig. 2, I).
Concept map of relationships among global change processes, food production, food security and the environment. Labels A–I are further discussed in the text.

The objective of this paper is to review ID research on relationships between environmental quality, food production and food security, focusing in particular on global cropland patterns, global change of land use, climate and economics, and prospects for increased food production. This review does not cover food security and the environment in general, but rather advances in understanding the food and environment nexus on land (Fig. 2) during the past decade.
Global patterns of croplands are first related to the critical geographical areas of concern for food security in order to ascertain potential effects of increasing cropland area or food production from available cropland. Effects of global climate, land-use and economic changes on food production and security are then discussed. Options to increase food production through cropland expansion and agricultural intensification, and effects on loss of natural areas and agrochemical pollution are addressed. I then address technological and societal aspects of increased water productivity to increase food production while considering the environment. Potential synergies between food production and environmental quality are explored and throughout roles of ID research in addressing each issue are reviewed.
GLOBAL CROPLAND
Estimation of the global extent of croplands (Fig. 2, A) is an excellent example of ID research engaging scientists from geographical, earth sciences and ecological disciplines (see Foley et al. Reference Foley, DeFries, Asner, Barford, Bonan, Carpenter, Chapin, Coe, Daily, Gibbs, Helkowski, Holloway, Howard, Kucharik, Monfreda, Patz, Prentice, Ramankutty and Snyder2005). Productive agriculture activities occur where soils are fertile and water is available from rain or other sources. More than 35% of the global land surface is devoted to agriculture (Foley et al. Reference Foley, DeFries, Asner, Barford, Bonan, Carpenter, Chapin, Coe, Daily, Gibbs, Helkowski, Holloway, Howard, Kucharik, Monfreda, Patz, Prentice, Ramankutty and Snyder2005); croplands occupy about 1800 million ha (Mha), or c. 12% of the world's land surface, while pastures and rangelands occupy c. 22% (Leff et al. Reference Leff, Ramankutty and Foley2004). Rainfed areas occupy a much larger proportion of croplands than irrigated areas; about 280 Mha were under irrigation at the end of the 1990s (FAO 2006). Moreover, rainfed areas account for a large proportion of total cropland in developing countries, but vary significantly by region: 96% in Sub-Saharan Africa, 87% in Latin America, 60–70% in other areas of East and South Asia, and North Africa (FAO 2006).
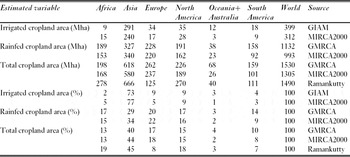
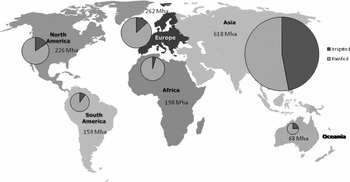
Maps of irrigated and rainfed croplands are crucial for food security analysis. Several global datasets have become available this decade at a spatial resolution of 5 min (c. 10 km), using a combination of satellite remote sensing imagery combined with available census statistics. These datasets are: geographic distribution of crops (Leff et al. Reference Leff, Ramankutty and Foley2004), the Global Irrigated Area Mapping (GIAM) data products (Thenkabail et al. Reference Thenkabail, Biradar, Noojipady, Dheeravath, Gumma, Li, Velpuri, Gangalakunta, Thenkabail, Lyon, Turral and Biradar2009a, Reference Thenkabail, Biradar, Noojipady, Dheeravath, Li, Velpuri, Gumma, Gangalakunta, Turral, Cai, Vithanage, Schull and Duttab), the Global Map of Rainfed Cropland Areas (GMRCA) (Biradar et al. Reference Biradar, Thenkabail, Noojipady, Li, Dheeravath, Turral, Velpuri, Gumma, Gangalakunta, Cai, Xiao, Schull, Alankara, Gunasinghe and Mohideen2009a, Reference Biradar, Thenkabail, Noojipady, Li, Dheeravath, Velpuri, Turral, Cai, Gumma, Gangalakunta, Schull, Alankara, Gunasinghe, Xiao, Thenkabail, Lyon, Turral and Biradarb), the monthly irrigated and rainfed crop areas around the year 2000 (MIRCA2000) (Portmann et al. Reference Portmann, Siebert and Döll2010), and the ‘Farming the Planet’ studies (Monfreda et al. Reference Monfreda, Ramankutty and Foley2008; Ramankutty et al. Reference Ramankutty, Evan, Monfreda and Foley2008). Areal estimates vary among the studies, with differences in remote sensing methodology, spatial resolution and crops selected, however the proportions of the total by continent are relatively similar (Table 1, Fig. 3).
Amount of irrigated and rainfed croplands by continents and world distribution c. 2000 (in % of world total). Oceania includes Australia. Sources: GIAM (Thenkabail et al. Reference Thenkabail, Biradar, Noojipady, Dheeravath, Li, Velpuri, Gumma, Gangalakunta, Turral, Cai, Vithanage, Schull and Dutta2009); MIRCA2000 (Portmann et al. Reference Portmann, Siebert and Döll2010); GMRCA (Biradar et al. Reference Biradar, Thenkabail, Noojipady, Li, Dheeravath, Velpuri, Turral, Cai, Gumma, Gangalakunta, Schull, Alankara, Gunasinghe, Xiao, Thenkabail, Lyon, Turral and Biradar2009b); Ramankutty (Ramankutty et al. Reference Ramankutty, Evan, Monfreda and Foley2008).

Distribution of continent rainfed and irrigated cropland according to the GIAM and GMRCA data (Table 1), with inset pie chart comparing irrigated and rainfed areas: sizes of discs are proportional to the total cropland area for each continent.

In the early 1990s, wheat, maize, and rice accounted for nearly half of the c. 1520 Mha occupied by the world's major 18 crops (Leff et al. Reference Leff, Ramankutty and Foley2004). Large homogeneous zones occur in Asia, North America, Europe, Oceania, and Australia, but mosaics of mixed crops are prevalent in Africa and South America (Leff et al. Reference Leff, Ramankutty and Foley2004).
The GIAM data products (Thenkabail et al. Reference Thenkabail, Biradar, Noojipady, Dheeravath, Gumma, Li, Velpuri, Gangalakunta, Thenkabail, Lyon, Turral and Biradar2009a, Reference Thenkabail, Biradar, Noojipady, Dheeravath, Li, Velpuri, Gumma, Gangalakunta, Turral, Cai, Vithanage, Schull and Duttab) indicate nearly 400 Mha of irrigated land at the end of the last century, representing c. 26% of total global cropland (Table 1). Asia has the largest amount of croplands, and c. 73% of global irrigated cropland, with 9% each in North America and Europe, and only 2% in Africa (Fig. 3; Table 1). Three quarters of the total irrigated cropland in Asia, more than half of global irrigated cropland, lies in China and India.
Rainfed croplands (c. 1130 Mha) cover almost three times the extent of irrigated areas and are more evenly distributed by continent and country (Table 1); Asia has 29%, followed by Europe at 20%, Africa and North America at 17% each, South America at 14%, and Oceania and Australia at 3% (Biradar et al. Reference Biradar, Thenkabail, Noojipady, Li, Dheeravath, Turral, Velpuri, Gumma, Gangalakunta, Cai, Xiao, Schull, Alankara, Gunasinghe and Mohideen2009a, Reference Biradar, Thenkabail, Noojipady, Li, Dheeravath, Velpuri, Turral, Cai, Gumma, Gangalakunta, Schull, Alankara, Gunasinghe, Xiao, Thenkabail, Lyon, Turral and Biradarb) (Fig. 3). The USA leads the proportion by country with c. 12%, a proportion similar to India and China combined. Africa has a large proportion but low productivity (Thenkabail & Lyon Reference Thenkabail, Lyon, Thenkabail, Lyon, Turral and Biradar2009).
According to Farming the Planet, the world's total crop area is similar (c. 1500 Mha; Monfreda et al. Reference Monfreda, Ramankutty and Foley2008; Ramankutty et al. Reference Ramankutty, Evan, Monfreda and Foley2008), however, it indicates more cropland in Africa and North and Central America. These studies (Monfreda et al. Reference Monfreda, Ramankutty and Foley2008; Ramankutty et al. Reference Ramankutty, Evan, Monfreda and Foley2008) also estimate cropland area by biome, the distribution of 11 major crop groups, crop net primary production and four physiologically based crop types.
MIRCA2000 reports c. 1300 Mha harvested for all major food crops and cotton of which c. 24% are under irrigation (Portmann et al. Reference Portmann, Siebert and Döll2010). Compared to GMRCA, the harvested area is greater but the irrigated area is similar (Biradar et al. Reference Biradar, Thenkabail, Noojipady, Li, Dheeravath, Turral, Velpuri, Gumma, Gangalakunta, Cai, Xiao, Schull, Alankara, Gunasinghe and Mohideen2009a; Thenkabail & Lyon Reference Thenkabail, Lyon, Thenkabail, Lyon, Turral and Biradar2009). By continent, the proportions of irrigated land are similar, but Africa has nearly double, while Europe and Oceania have half the GMRCA values (Table 1). Rice dominates the harvested irrigation areas, while wheat and maize are the crops with the largest rainfed harvested areas. One third of global crop production and 44% of total cereal production come from irrigated agriculture (Portmann et al. Reference Portmann, Siebert and Döll2010).
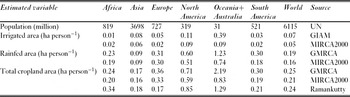
Large crop areas in a continent do not necessarily mean that there are fewer undernourished people. Taking population data into account (UN 2010b), irrigated and rainfed cropland areas per person are least in Asia (c. 0.16–0.18 ha person−1) and Africa (c. 0.20–0.34 ha person−1) (Table 2) where there are large numbers of undernourished people (Fig. 1). Moreover, Africa's low value of cropland per person is compounded by a very large proportion of rainfed area compared to irrigated area (Table 1).
Human population and calculated irrigated and rainfed cropland area per person by continent (based on Table 1). Oceania includes Australia. Sources: UN (UN 2010); GIAM (Thenkabail et al. Reference Thenkabail, Biradar, Noojipady, Dheeravath, Li, Velpuri, Gumma, Gangalakunta, Turral, Cai, Vithanage, Schull and Dutta2009); MIRCA2000 (Portmann et al. Reference Portmann, Siebert and Döll2010); GMRCA (Biradar et al. Reference Biradar, Thenkabail, Noojipady, Li, Dheeravath, Velpuri, Turral, Cai, Gumma, Gangalakunta, Schull, Alankara, Gunasinghe, Xiao, Thenkabail, Lyon, Turral and Biradar2009b); Ramankutty (Ramankutty et al. Reference Ramankutty, Evan, Monfreda and Foley2008).

GLOBAL LAND-USE CHANGE
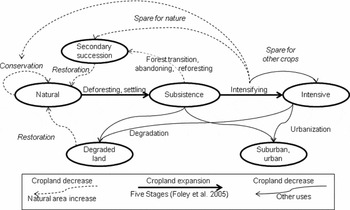
Land-use change (Fig. 2, B) to grow crops and develop cities became global in scope during the last century (Houghton Reference Houghton1994; Foley et al. Reference Foley, DeFries, Asner, Barford, Bonan, Carpenter, Chapin, Coe, Daily, Gibbs, Helkowski, Holloway, Howard, Kucharik, Monfreda, Patz, Prentice, Ramankutty and Snyder2005; Lepers et al. Reference Lepers, Lambin, Janetos, DeFries, Achard, Ramankutty and Scholes2005). Cropland and pasture together occupy 40% of the world land surface. Most current agricultural land-use practices cause environmental degradation, including water pollution, salinization, reduced soil fertility and soil erosion (Foley et al. Reference Foley, DeFries, Asner, Barford, Bonan, Carpenter, Chapin, Coe, Daily, Gibbs, Helkowski, Holloway, Howard, Kucharik, Monfreda, Patz, Prentice, Ramankutty and Snyder2005) (Fig. 4). Mitigation requires an increase in crop productivity, and maintenance of soil organic matter, nutrient availability and carbon sequestration capacity, requiring landscape-level and ID approaches (Foley et al. Reference Foley, DeFries, Asner, Barford, Bonan, Carpenter, Chapin, Coe, Daily, Gibbs, Helkowski, Holloway, Howard, Kucharik, Monfreda, Patz, Prentice, Ramankutty and Snyder2005).
Global land-use change processes with reference to agriculture. Cropland increase and decrease and potential pathways to maintain extent of natural areas. The main processes shown are cropland expansion and subsequent intensification (thick solid lines), loss to urbanization and degradation (thin solid lines), and potential return to vegetation in secondary succession stage or restored natural conditions (dashed line).

Increasing crop yield per unit area may lead to reduced demand for croplands thus ‘sparing land for nature’ (Fig. 4) (Waggoner & Ausubel Reference Waggoner and Ausubel2001; Borlaug Reference Borlaug2007). Although overall during 1990–2005 agricultural intensification did not lead to a decline in cropland area for ten major crops (Rudel et al. Reference Rudel, Schneider, Uriarte, Turner, DeFries, Lawrence, Geoghegan, Hecht, Ickowitz, Lambin, Birkenholtz, Baptista and Grau2009), countries with grain imports and conservation programmes were an exception. Analysis of 23 crops in 124 countries during 1979–1999 showed that in countries that increased yields of staple crops their total per person staple cropland area decreased, however areas were not set aside for conservation, but rather used for other crops (Ewers et al. Reference Ewers, Schaarlemann, Balmford and Green2009) (Fig. 4), although a small land-sparing effect was detectable in developing countries. Land sparing occurs under specific conditions and that explicit conservation policies are needed for effective land sparing. Better data are needed to make this type of study even more useful and reliable (Grainger Reference Grainger2009).
ID research on land-use change requires integration of social and natural sciences, as in the Biocomplexity in the Environment programme in the early 2000s (Covich Reference Covich2000; Dybas Reference Dybas2001; Cottingham Reference Cottingham2002; Pickett et al. Reference Pickett, Cadenasso and Grove2005), which has evolved into the Coupled Natural and Human Systems programme of the US National Science Foundation (NSF). An important approach to facilitate ID research involves modelling.
An important type of land-use change model uses multi-agent methodology to couple values and attitudes of individuals and policy making in a socioecological model (Callicott et al. Reference Callicott, Rozzi, Delgado, Monticino, Acevedo and Harcombe2007; Acevedo et al. Reference Acevedo, Callicott, Monticino, Lyons, Palomino, Rosales, Delgado, Ablan, Davila, Tonella, Ramirez and Vilanova2008; Le et al. Reference Le, Park and Vlek2010). Multi-agent models allow simulations of human decision processes that include value systems or preferences based on surveys, focus groups and interviews, and can interact with natural system models, such as hydrologic models. Regulators and decision-makers can see potential effects of their decisions and explore options to achieving better results (Acevedo et al. Reference Acevedo, Callicott, Monticino, Lyons, Palomino, Rosales, Delgado, Ablan, Davila, Tonella, Ramirez and Vilanova2008). Social sciences (such as economics, anthropology or sociology) are vital to develop the human system model, providing understanding of its dynamics, of collecting social information properly, of interpretation of results and modification of model structure, and translating the research to stakeholders. Panel surveys, qualitative surveys, focus groups and ethnographic methods are needed (Meinzen-Dick et al. Reference Meinzen-Dick, Adato, Haddad and Hazell2004).
The Millennium Ecosystem Assessment (http://www.maweb.org/) and DIVERSITAS (http://www.diversitas-international.org/) also emphasize ID science challenges to address coupled socioecological systems that relate ‘ecosystem services’ (such as resources and processes that are supplied by natural systems) and human well-being (Millennium Ecosystem Assessment 2005; Mooney & Mace Reference Mooney and Mace2009; Faith et al. Reference Faith, Magallon, Hendry, Conti, Yahara and Donoghue2010; Larigauderie & Mooney Reference Larigauderie and Mooney2010). These challenges include integrated models built by ID research, monitoring, long-term research, and analysis at local and global scales (Carpenter et al. Reference Carpenter, Mooney, Agard, Capistrano, DeFries, Díaz, Dietz, Duraiappah, Oteng-Yeboah, Pereira, Perrings, Reid, Sarukhan, Scholes and Whyte2009), where food is an important ecosystem services (Wood et al. Reference Wood, Ehui, Alder, Benin, Cassman, Cooper, Johns, Gaskell, Grainger, Kadungure, Otte, Rola, Watson, Wijkstrom, Devendra, Kanbar, Khan, Masters, Porter, Vannuccini, Wood-Sichra, Balisacan, Gardiner, Hassan, Scholes and Ash2005).
However, barriers to ID research include differences in discipline-specific values, explanatory models, assumptions, epistemology, methodology, and values and institutional placement by society (Lélé & Norgaard Reference Lélé and Norgaard2005). Crossing the divide between natural and social sciences entails overcoming these multidimensional differences, and requires institutional support and development of receptive environments for collaboration (Lélé & Norgaard Reference Lélé and Norgaard2005; Pennington Reference Pennington2008). Furthermore, significant investment by individual researchers is needed in appreciating and understanding perceptions and assumptions of other disciplines, and developing a more coherent conceptual framework to which all disciplines can subscribe.
There are two ways to increase food production: (1) increase the area available for crops, and (2) increase productivity of crops. The first involves land-use change and is not viable without significantly raising environmental concerns (for example in Brazil; Brown Reference Brown2005). Most countries in Asia cannot increase high quality cropland for cereal grains. Land has been converted to housing and industrial infrastructure, or from cereal grains to vegetables (Hossain & Singh Reference Hossain and Singh2000).
Demand for expansion of agricultural areas drives deforestation in many developing countries (Acevedo et al. Reference Acevedo, Callicott, Monticino, Lyons, Palomino, Rosales, Delgado, Ablan, Davila, Tonella, Ramirez and Vilanova2008), rates of forest loss depending on human population growth, human development (including income, health and education) and policy choices (Jha & Bawa Reference Jha and Bawa2006) (Fig. 4). Cultivation areas have decreased through urbanization (Acevedo et al. Reference Acevedo, Callicott, Monticino, Lyons, Palomino, Rosales, Delgado, Ablan, Davila, Tonella, Ramirez and Vilanova2008) (Fig. 4), and abandonment or reforestation of croplands (Fig. 4); the latter ‘forest transition’ has occurred in Spain (Bonet Reference Bonet2004), the Midwestern USA (Hoffman et al. Reference Hoffman, Kelly, Evans and Janssen2002), New England (Langley-Turnbaugh & Keirstead Reference Langley-Turnbaugh and Keirstead2005) and some developing countries through rural- urban migration (Aide & Grau Reference Aide and Grau2004). Urbanization and rural emigration have had similar effects on population redistribution but different effects on the associated land-use change in rural areas.
Such differences in land-use change processes across the world may be explained from a perspective of land-use change based on agrarian, transportation and communication phases (Huston Reference Huston2005). This complements views of land-use based on population centres and infrastructure, and postulates that agriculture initiates change in lands of high primary ecosystem productivity. In the agrarian phase environmental constraints drive land-use, but in the later two phases people are less environmentally constrained and can locate according to infrastructure (Huston Reference Huston2005). In general, societies in the agrarian phase are deforesting land for agriculture, while in the transportation and communication phases, people urbanize land near population centres that often coincides with earlier settlements in fertile lands.
The above perspective implies that impacts of land-use change on biodiversity due to habitat alteration (Pereira et al. Reference Pereira, Daily and Roughgarden2004) vary according to development phase, and this can help guide biodiversity conservation strategies. Understanding loss of biodiversity due to habitat alteration is an important part of the highly ID science of landscape ecology (Wu Reference Wu2006). Major principles of landscape ecology include recognizing spatial heterogeneity, pattern-process relations and scale issues, and focusing on ecosystems and human interactions (for example ecosystem services) (Wu Reference Wu2006).
Land-use change impacts ecosystem processes and services, beyond net changes in the amount of cultivation land and biodiversity loss. Very important transformations relate to changes in water quantity and quality patterns due to concomitant shifts in water use. For example, agricultural expansion changes sediment load and agrochemical loads in natural areas, and runoff processes and pollutants in urban areas (Bhaduri et al. Reference Bhaduri, Harbor, Engel and Grove2000). In water-scarce areas, water demand for crop irrigation conflicts with demand for urban consumption, highlighting the importance of water management for multiple purposes including ecosystem maintenance and restoration (Vallejo et al. Reference Vallejo, Steinitz, Rojo, Luizao, Millán, Pulido, Schemenauer, Gracia, Ruíz-de-la-Torre, Ramírez, Cortina, Acevedo, Prieto, Kirketerp, Bosco-Senra, Botey, Gómez-Orea, Bellot and González-Alonso2009). Impacts of land-use change on water quantity and quality require a spatial perspective on landscape and watershed levels and of the scales at which effects are considered (Kiersch Reference Kiersch2000). ID research (for example hydrologists, aquatic ecologists, water resource planners and managers, terrestrial ecologists, landscape ecologists, and land planners and managers) is crucial for a comprehensive understanding of the dynamic relations between land use and water use.
GLOBAL CLIMATE CHANGE
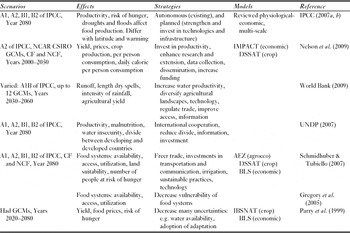
Agriculture is very vulnerable to climate change (Fig. 2, C), crop yields potentially declining due to increased temperature and changed rainfall, as well as increased negative effects of weeds and pests, particularly in developing countries (Nelson et al. Reference Nelson, Rosegrant, Koo, Robertson, Sulser, Zhu, Ringler, Msangi, Palazzo, Batka, Magalhaes, Valmonte-Santos, Ewing and Lee2009; World Bank 2009; Ziervogel & Ericksen Reference Ziervogel and Ericksen2010). As long as global warming is < c. 3 C°, climate change is likely to increase yields at mid and high latitudes, but decrease yield at lower latitudes, thus increasing risk of food insecurity for countries in arid and sub-humid tropical areas, particularly Africa. Many scenarios, potential effects and adaptation strategies have been considered (Table 3).
Global climate change assessment of effects on food security and adaptation strategies. IPCC scenarios: A1 = rapid economic and population growth with combined fossil and non-fossil energy (A1B); A2 = lower economic growth, less globalization and high population growth; B1 = mitigation of emissions, through increased resource efficiency and technology improvement; B2 = mitigation of emissions through more localized solutions. Global climate (circulation) models (GCMs): NCAR = National Centre for Atmospheric Research, CSIRO = Commonwealth Scientific and Industrial Research Organization, Had = Hadley Centre. CF = with CO2 fertilization, NCF = without CO2 fertilization. Assessment models: IMPACT = International Model for Policy Analysis of Agricultural Commodities and Trade, DSSAT = Decision Support System for Agrotechnology Transfer, AEZ = Agro Ecological Zone, BLS = Basic Linked System, IBSNAT = International Benchmark Sites Network for Agrotechnology Transfer.

Assessing global climate change effects on food production and security is a good example of ID research, involving at least the combined efforts of climatologists and crop scientists, but also several other disciplines (such as economics, human geography and other social sciences) in order to include food prices, human factors and adaptation strategies. ID collaboration is evident in the Intergovernmental Panel on Climate Change (IPCC) assessment reports involving many individuals from a variety of disciplines (for example IPCC Reference Parry, Canziani, Palutikof, van der Linden and Hanson2007a, Reference Solomon, Qin, Manning, Chen, Marquis, Averyt, Tignor and Millerb).
Since the 1980s, quantitative assessments of global climate effects on agriculture could be performed by deriving local climate scenarios from general circulation models (GCMs, or global climate models) and using these scenarios as input to cropping models, such as Decision Support System for Agrotechnology Transfer (DSSAT) (Jones et al. Reference Jones, Hoogenboom, Porter, Boote, Batchelor, Hunt, Wilkens, Singh, Gijsman and Ritchie2003), and the Erosion Productivity Impact Calculator (EPIC) (Williams Reference Williams1990) (Table 3). Early use of DSSAT included assessing potential climate change impacts on corn and beans in regions of Venezuela (Jaimez et al. Reference Jaimez, Tonella and Acevedo1994; Maytin et al. Reference Maytin, Acevedo, Jaimez, Andressen, Harwell, Robock and Azocar1995), and of EPIC included assessing effects on agriculture in the Missouri-Iowa-Nebraska-Kansas (MINK) region of the USA (Easterling et al. Reference Easterling, Crosson, Rosenberg, McKenney, Katz and Lemon1993). From the late 1990s, a multi-field version of EPIC, the Agricultural Policy EXtender (APEX) model, could address agricultural production systems on a whole farm or small watershed basis (Gassman et al. Reference Gassman, Williams, Benson, Izaurralde, Hauck, Jones, Atwood, Kiniry and Flowers2005; Williams & Izaurralde Reference Williams, Izaurralde, Singh and Frevert2005).
This scenario/modelling approach is highly ID, requiring diverse expertise on climate modelling, local climate and weather, crop and hydrological modelling, local cropping systems and soil science. The approach has been expanded to generate comprehensive quantitative analyses using scenarios of global climate predicted by a transient GCM, the International Benchmark Sites Network for Agrotechnology Transfer (IBSNAT) crop growth, and world food trade models (Parry et al. Reference Parry, Rosenzweig, Iglesias, Fischer and Livermore1999). Changes in production, prices and numbers of people at risk of hunger can be projected, while indicating farm-level and economic adjustments. By 2080, due to climate change (for example shortening of growing period and decrease in water availability), there may be a large decrease in production (c. 160Mt yr−1), increase in prices by c. 40% and an additional 130 million people at risk of hunger (Parry et al. Reference Parry, Rosenzweig, Iglesias, Fischer and Livermore1999).
Studies based on the International Food Policy Research Institute (IFPRI) IMPACT model (Rosegrant et al. Reference Rosegrant, Msangi, Ringler, Sulser, Zhu and Cline2008) and DSSAT cropping system models (DSSAT-CSM) (Jones et al. Reference Jones, Hoogenboom, Porter, Boote, Batchelor, Hunt, Wilkens, Singh, Gijsman and Ritchie2003) are also highly ID (Table 3). Agricultural yield will be reduced and human well-being will be negatively affected by climate change, because increased food prices will lead to less calorie intake and increased child malnutrition (Nelson et al. Reference Nelson, Rosegrant, Koo, Robertson, Sulser, Zhu, Ringler, Msangi, Palazzo, Batka, Magalhaes, Valmonte-Santos, Ewing and Lee2009, Reference Nelson, Rosegrant, Palazzo, Gray, Ingersoll, Robertson, Tokgoz, Zhu, Sulser, Ringler, Msangi and You2010). The IMPACT global model is comprehensive, including 32 crop and livestock commodities in 281 regions of the world, and linking production and demand relationships by international trade flows. Recommended policies and programmes, which highlight agricultural adaptation and investments in increased productivity, have resulted (Nelson et al. Reference Nelson, Rosegrant, Koo, Robertson, Sulser, Zhu, Ringler, Msangi, Palazzo, Batka, Magalhaes, Valmonte-Santos, Ewing and Lee2009). Increasing agricultural productivity to deal with climate change is also the main message on food production of the World Development Report, which recommended investment in information systems and technologies (World Bank 2009). Climate effects on maize and bean yields at the level of household and agricultural system (conditions of crop grown, elevation and climate) are predicted for east Africa based on GCM-driven DSSAT crop models, and household-level adaptations to climate change to help improve food security in local communities have been recommended (Thornton et al. Reference Thornton, Jones, Alagarswamy, Andresen and Herrero2010).
Few quantitative studies have included effects of climate change on dimensions of food security other than food production, such as food access and use (Gregory et al. Reference Gregory, Ingram and Brklacich2005; Schmidhuber & Tubiello Reference Schmidhuber and Tubiello2007; Nelson et al. Reference Nelson, Rosegrant, Palazzo, Gray, Ingersoll, Robertson, Tokgoz, Zhu, Sulser, Ringler, Msangi and You2010; Ziervogel & Ericksen Reference Ziervogel and Ericksen2010). These impacts can be significant, such as reduction of food safety due to increased pressure from disease, decrease of income from agricultural production and effects on food prices, especially for the poor (Schmidhuber & Tubiello Reference Schmidhuber and Tubiello2007). Above global average warming predicted for sub-Saharan Africa, eastern Asia and South Asia may reduce water availability in already water-scarce areas (UNDP [United Nations Development Programme] 2007). Likely major losses in agricultural production may lead to increased food insecurity and reduced opportunities for poverty reduction. In contrast, agricultural production could increase in developed countries, furthering the divide between food-rich and food-poor countries (UNDP 2007).
The December 2009 Copenhagen summit underlines how difficult it is to achieve consensus between developed and developing nations regarding actions on climate change issues. Farming conditions, particularly in sub-Saharan Africa and South Asia, are potentially very sensitive to climate change, highlighting the need to help provide these farmers with efficient irrigation, drought-resistant seeds and education on these technologies. Investment of US$ 14 billion may be required to mitigate the effects on farmers of 1°C warming by 2030 (Lomborg Reference Lomborg2007).
Agriculture itself is a contributor to global climate change, for example through emissions of carbon dioxide, methane and nitrous oxide. These result from forest conversion to agriculture, but also some agricultural activities, especially livestock and soil management. Increased ID efforts are required to understand how to implement the efficient crop systems that mitigate climate change effects while arresting emissions. This can be achieved by the type of combined GCM and crop system modelling work described earlier and requires generating new data plus model extensions and improvements with participation from several disciplines.
GLOBAL ECONOMIC CHANGE
Food insecurity dynamics and global economic change (Fig. 2, D) are intimately related. Recent increases in global food insecurity are attributable to high food prices (FAO 2008) and the global economic crises of the last few years (FAO 2009). Many poor households in developing countries are increasingly dependent on food purchase, yet their incomes are low and do not increase with global food prices (FAO 2009). Potential strategies to alleviate the impact of high food prices and economic crises on world hunger include measures to increase food production in developing countries and increase investments in agriculture and non-farm sectors of rural areas (FAO 2009). Continued investments in agriculture are important, economic growth improves conditions for increased food availability and access, while higher food prices would encourage farmers to produce more. Prices may need to be maintained low so that food can be purchased by poor people.
FAO (2008, 2009), IFPRI (Grebmer et al. Reference Grebmer, Ruel, Menon, Nestorova, Olofinbiyi, Fritschel, Yohannes, Oppeln, Towey, Golden and Thompson2010), the World Food Programme (WFP 2009) and the World Bank (World Bank 2009) characterize the ID nature of the research and action required to tackle the relationship between the global economy, global food security, and the environment. Examination of production, markets and trade, is intertwined with social issues, such as governance, policy, poverty and hunger, as well as with emerging uses of agricultural products for energy. No single discipline can address these multiple and interrelated systems.
Increases in oil prices and policies on biofuel substitution of fossil fuels to abate carbon emissions have led to a global increase in biofuel production (Hertel et al. Reference Hertel, Tyner and Birur2010). Increased demand for more land and water to grow food for biofuels or dedicated bioenergy crops illustrates the additional challenge provided by the interactions between global food, energy and financial systems in the effort to eliminate poverty and hunger (Headey et al. Reference Headey, Malaiyandi and Fan2010). Biomass for energy should perhaps be produced primarily from excess farm and forest residues, perennials, waste products and marginal land not required for food production. Increased efficiency of biomass production, conversion and use may reduce land competition and related indirect impacts of land-use changes (Hill et al. Reference Hill, Nelson, Tilman, Polasky and Tiffany2006; Fritsche et al. Reference Fritsche, Sims and Monti2010; Krasuska et al. Reference Krasuska, Cadorniga, Tenorio, Testa and Scordia2010; Kullander Reference Kullander2010).
In areas of the USA, ethanol and biodiesel cannot replace petroleum-based fuels without impacting food supplies (Hill et al. Reference Hill, Nelson, Tilman, Polasky and Tiffany2006), however 10% contribution to global energy demand might be derived from agricultural residues, forestry and waste (Kullander Reference Kullander2010). Linkages between policy incentives and agricultural and energy markets are becoming stronger and farmers face greater production choices, for example between dedicated energy crops and food crops, especially those with residues with high potential for biofuel feedstock (Jiang & Swinton Reference Jiang and Swinton2009). An economic model of farmers’ choices between switchgrass (as dedicated feedstock for advanced biofuels) and corn indicates that in the USA's ‘Corn Belt’ farmers will opt for corn under the current pricing structure of energy and agricultural markets (Jiang & Swinton Reference Jiang and Swinton2009).
Currently biofuels represent 1% of total world agricultural output. An important question is how to integrate biofuel production with existing agricultural production and whether biofuels may represent an opportunity to upgrade overall agricultural efficiency, food and non-food products included (Mathews Reference Mathews2009). The potential for competition with food products is high in the USA and Europe (Hill et al. Reference Hill, Nelson, Tilman, Polasky and Tiffany2006; Mathews Reference Mathews2009; Krasuska et al. Reference Krasuska, Cadorniga, Tenorio, Testa and Scordia2010) but opportunities may exist to grow biofuels in tropical developing countries using sustainable practices and biochar production (to increase soil fertility and sequester carbon), and promoting trade liberalization of biofuels to allow export to developed countries (Mathews Reference Mathews2009).
There has been little research on potential effects on food production systems and environmental effects of increased biofuel production in tropical countries. For example, in Brazil, although there is no current or likely constraint on food production of land dedicated to biofuels (Gauder et al. Reference Gauder, Graeff-Honninger and Claupein2011), expansion of biofuel occurs mostly on rangelands and annual agricultural crops (Rudorff et al. Reference Rudorff, Aguiar, Silva, Sugawara, Adami and Moreira2010). Thus, land-use change may indeed cause increased deforestation, because of increased demand for rangelands (Lapola et al. Reference Lapola, Schaldach, Alcamo, Bondeau, Koch, Koelking and Priess2010).
In the debate on effects of globalization, a specific theme is impacts of agricultural globalization on food insecurity of the poor (von Braun & Díaz-Bonilla Reference von Braun, Díaz-Bonilla, von Braun and Díaz-Bonilla2008). In 2003, world total food sales, excluding food consumed on farms, were c. US$ 4000 billion, one quarter of this corresponding to fresh food, and one half in developed countries, but relative demand for sales in developing countries is projected to increase (von Braun & Díaz-Bonilla Reference von Braun, Díaz-Bonilla, von Braun and Díaz-Bonilla2008). Overall, developing countries tend to grow more food for their own markets, while developed countries tend to import and export more food. Cereals and vegetable oils show the most active global import and export activity. An important factor for developing countries is the global economy into which they are integrating themselves, because of the potential vulnerability of the poor to changes in prices (von Braun & Díaz-Bonilla Reference von Braun, Díaz-Bonilla, von Braun and Díaz-Bonilla2008).
Conversely, globalization may not have the strongest impact on food security of developing nations. Governance and policy at the national level are at least as important to increase food security. Required actions include investments in rural roads, health, education and agricultural research (von Braun & Díaz-Bonilla Reference von Braun, Díaz-Bonilla, von Braun and Díaz-Bonilla2008). Peace and rule of law are essential for these investments to help increase food security. Related to globalization, migration has transformed rural and agricultural economies and affected ecosystems, for example in Latin America (Aide & Grau Reference Aide and Grau2004). More general linkages between globalization and global environment issues pose new challenges due to increased demand for natural resources and interdependency between global markets and the global environment (Najam et al. Reference Najam, Runnalls and Halle2007).
The trade liberalization strategies of the Uruguay Round of the General Agreement on Tariffs and Trade (GATT) attempted to reduce subsidies for agriculture in developing nations in order to reduce global agriculture market distortions. However, these strategies were based on agricultural versus non-agricultural sectors of developed nations and disregarded the importance of agriculture in insuring developing nations’ food security (Suryanarayana Reference Suryanarayana1997). There is growing interest in shifting these policies. A former USA president now regrets that he did not push for funding to farmers around the world during his presidency (Clinton Reference Clinton2009), and current USA president Obama has announced plans to help farmers produce food in poor nations. The Group of Eight recently agreed to provide US$ 15 billion to promote agriculture in developing nations and thus shift efforts from aid to promotion of agriculture (Baker & Dugger Reference Baker and Dugger2009).
Economic growth is expected to remain geographically unbalanced, yet development must be inclusive to alleviate poverty. One way to achieve inclusive development under uneven growth conditions is by ‘economic integration’, bringing together leading and lagging places of uneven growth at local, national and international scales (World Bank 2008). The ID field of economic geography contributes to understanding complex interactions between poverty and development (see World Bank 2008).
OPPORTUNITIES TO INCREASE FOOD PRODUCTION: INCREASING PRODUCTIVITY
Although there may be more area available for croplands and potential increases in this area due to climate change, especially in northern latitudes, increasing food production by expanding cropland area is scarcely viable without causing environmental impacts. Thus, increasing production in existing croplands is crucial.
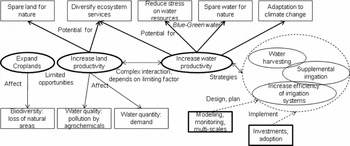
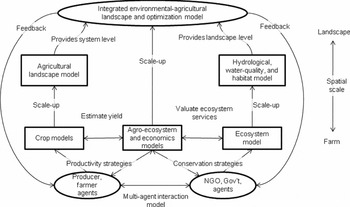
There are two major strategies for greater food production in existing croplands (Fig. 2, E): increasing ‘land productivity’ (namely more food per unit area) by using fertilizer and efficient cultivars, and increasing ‘water productivity’ (namely more food per unit of water) (Brown Reference Brown2006; Thenkabail & Lyon Reference Thenkabail, Lyon, Thenkabail, Lyon, Turral and Biradar2009). These are not separate strategies, and their particular application depends on which factor is limiting production. Opportunities to increase food production must consider their environmental impacts, their potential for reduction of environmental degradation, strategies, and their design, planning and implementation (Fig. 5).
Opportunities to increase food production (ovals in the centre), environmental effects (rectangles in lower part), their potential for reduction of environmental degradation (rectangles in upper part), strategies to use these opportunities (ovals on the right), and their design, planning and implementation (thick rectangles at bottom).

Increased land productivity was the emphasis of the ‘green revolution’ (use of high-yield cultivars, fertilizers, pesticides, mechanization and irrigation) and this may have reached its limit (Brown Reference Brown2006; Thenkabail & Lyon Reference Thenkabail, Lyon, Thenkabail, Lyon, Turral and Biradar2009). There is now urgency to improve water productivity, particularly in rainfed areas and in irrigated areas that are threatened by scarcity of water or poor water management (Castillo et al. Reference Castillo, Namara, Ravnborg, Hanjra, Smith, Hussein, Béné, Cook, Hirsch, Polak, Vallée, Koppen and Molden2007). Increased water productivity is also critical to coping with climate change (World Bank 2009). In many areas where water is not the limiting factor, land productivity remains central and articulation of land and water productivity strategies is a complex issue (Fig. 5).
Fertilizer use, together with modern plant varieties (those sensitive to increased nitrogen), is the most important factor in increasing land productivity. During 1960–2000, widespread use of the IR8 rice variety doubled the rice yields in Asia with only a 13% increase in crop area, but with a concomitant tenfold increase in fertilizer use (Hossain & Singh Reference Hossain and Singh2000). To sustain food security Asian countries would have to dramatically increase fertilizer intake, develop new varieties more sensitive to nutrient uptake and develop innovative practices to reduce nutrient losses (Hossain & Singh Reference Hossain and Singh2000). Critical issues are environmental concerns of increased consumption, as well as dependency on fossil fuels and the high-energy consumption of fertilizer production (Conway Reference Conway1999; Longo & York Reference Longo and York2008).
AGRICULTURAL INTENSIFICATION AND ENVIRONMENTAL DEGRADATION: AGROCHEMICALS
Intensified food production has major environmental impacts (Fig. 2, F and Fig. 5), including pollution by agrochemicals through multiple pathways and storage in air, water, sediments and soil. Plants and animals are exposed to a variety of contaminants that may have important ecological consequences for their populations. Humans are exposed to agrochemicals through water and food intake, and such pathways are themselves affected by global climate change (Boxall et al. Reference Boxall, Hardy, Beulke, Boucard, Burgin, Falloon, Haygarth, Hutchinson, Kovats, Leonardi, Levy, Nichols, Parsons, Potts, Stone, Topp, Turley, Walsh, Wellington and Williams2009; Bandara et al. Reference Bandara, Wijewardena, Liyanege, Upul and Bandara2010). An extensive literature on the effects of agrochemicals on ecosystems using the ecotoxicological risk approach includes ID research among environmental chemists and ecologists (Solomon et al. Reference Solomon, Giesy and Jones2000). The Ecological Risk Assessment framework was developed in the 1980s and 1990s to quantify risks to wildlife from agrochemical exposure, compiling data from disciplines including analytical toxicology, analytical environmental chemistry, biochemical toxicology and wildlife ecology. ID research is essential to understanding the effects on reproduction, health and well-being of wildlife (Kendall & Akerman Reference Kendall and Akerman1992).
Landscape level considerations, particularly spatial data, are important to understanding the pathways by which pesticides and herbicides cause exposure in aquatic and terrestrial ecosystems (Travis & Hendley Reference Travis and Hendley2001; Schriever et al. Reference Schriever, Ball, Holmes, Maund and Liess2007). Rain can wash agrochemicals from agricultural land into surface waters, particularly during intense episodic events or repeated chronic events (Reinert et al. Reference Reinert, Giddings and Judd2002; David et al. Reference David, Fraser, Ed, Bernard and Jim2005). Under such circumstances, concentrations of agrochemicals may exceed acceptable limits for protection of aquatic organisms and threaten sources of human drinking water (David et al. Reference David, Fraser, Ed, Bernard and Jim2005). Recent evidence indicates that these effects are not confined to agricultural areas; pesticides can be transported over long distances from their application sites via the atmosphere and thus affect remote ecosystems (Muir et al. Reference Muir, Teixeira and Wania2004).
Because ecological risk assessment methods require quantification, models and monitoring (particularly biological monitoring) may be used to quantify organism exposure and effects on individuals and populations (Acevedo et al. Reference Acevedo, Ablan, Dickson, Waller, Mayer and Morton1997; Kedwards et al. Reference Kedwards, Maund and Chapman1999; Morton et al. Reference Morton, Dickson, Waller, Acevedo, Mayer and Ablan2000; Allen et al. Reference Allen, Waller, Kennedy, Dickson, Acevedo, Ammann and Warwick2001). Measurements of the great diversity of chemicals used in agriculture are challenging, require a variety of approaches, and often indirect inference is needed according to scale; chemical ratios may be used to identify sources of contamination of groundwater over regional scales (Alderman et al. Reference Alderman, Hudak and Acevedo2002). An ID model (earth science–economics) integrated geographic information systems (GIS) and cost-effectiveness methods with a regional-scale vulnerability assessment tool with specific remediation measures to avoid unnecessary agricultural production costs related to the use of agrochemicals (Bernknopf et al. Reference Bernknopf, Dinitz and Loague2002).
Consumption of pesticides and fertilizers related to agricultural intensification in those countries with export-focused agricultural production reveals an additional link with global economic change processes (Longo & York Reference Longo and York2008). Traditional farmers engaged in intensified agriculture driven by globalization and economic benefits perceive an improvement in their socioeconomic status, but are not necessarily aware of a link between intensification and environmental degradation (for example decline in water quality; Dahal et al. Reference Dahal, Nyborg, Sitaula and Bajracharya2009), or willing to suffer a certain amount of environmental degradation in the interest of improving their economic conditions.
IMPROVING WATER PRODUCTIVITY: STRATEGIES AND TECHNOLOGIES
Although increasing land productivity, particularly in water-limited areas, is difficult, crop yields can be increased by better water management, especially by increasing timely water availability for crop uptake (Rockström Reference Rockström, Hatibu, Oweis, Wani, Barron, Farahani, Karlberg, Qiang and Molden2007). There are strategies and technologies to improve water productivity (Fig. 2, G and Fig. 5). Although there are many definitions of water productivity, two are relevant for the purposes of this review. One is the ratio of yield to the amount of water used (mass per unit water) and the other is the ratio of the value of the product to the amount of water used (in monetary units per unit water) (Molden et al. Reference Molden, Oweis, Steduto, Kijne, Hanjra, Bindraban and Molden2007).
Improving water productivity in agriculture is crucial to limiting the need for additional water and land in irrigated and rainfed agriculture (Fig. 5), and leaving enough water for other human purposes and sustaining ecosystems (Molden et al. Reference Molden, Oweis, Steduto, Kijne, Hanjra, Bindraban and Molden2007). Irrigation for agriculture competes with other uses of water, and can cause water resources degradation, which in turn can decrease sustainability of irrigated agriculture (Barker et al. Reference Barker, Dawe, Inocencio, Kijne, Barker and Molden2003). Two major types of water savings in agriculture are ‘blue water’, which focuses on surface water delivered to crops, and ‘green water’, which focuses on soil moisture and water depleted by evapotranspiration (Molden et al. Reference Molden, Murray-Rust, Sakthivadivel, Makin, Kijne, Barker and Molden2003; Falkenmark & Rockstrom Reference Falkenmark and Rockstrom2006; Falkenmark Reference Falkenmark2007; Molden et al. Reference Molden, Oweis, Steduto, Kijne, Hanjra, Bindraban and Molden2007).
Food insecurity is intimately linked with water insecurity (Brown Reference Brown2005). Seventy per cent (7130 Km3) of world water use is agricultural, of this 78% comes directly from rain and 22% from irrigation (de Fraiture et al. Reference de Fraiture, Wichelns, Rockström, Kemp-Benedict, Eriyagama, Gordon, Hanjra, Hoogeveen, Huber-Lee, Karlberg and Molden2007). Threats to human water security compound with those to freshwater ecosystem health, for example river biodiversity (Vorosmarty et al. Reference Vorosmarty, McIntyre, Gessner, Dudgeon, Prusevich, Green, Glidden, Bunn, Sullivan, Liermann and Davies2010). Investment is required to increase efficiency of agricultural water use and reduce impacts on water quantity and quality (de Fraiture et al. Reference de Fraiture, Wichelns, Rockström, Kemp-Benedict, Eriyagama, Gordon, Hanjra, Hoogeveen, Huber-Lee, Karlberg and Molden2007). Investments to improve productivity in rainfed areas, particularly in sub-Saharan Africa, can make a large difference in low-yield farms while reducing the need for new large irrigation projects (de Fraiture et al. Reference de Fraiture, Wichelns, Rockström, Kemp-Benedict, Eriyagama, Gordon, Hanjra, Hoogeveen, Huber-Lee, Karlberg and Molden2007). Improving water use efficiency in irrigated systems offers a greater opportunity to increase production than expanding irrigated area, particularly in South Asia (de Fraiture et al. Reference de Fraiture, Wichelns, Rockström, Kemp-Benedict, Eriyagama, Gordon, Hanjra, Hoogeveen, Huber-Lee, Karlberg and Molden2007). Even under optimistic investment scenarios, by 2050 crop area are predicted to increase by 9% and water withdrawals to increase by 13%, emphasizing the importance of improving water management to enhance production while minimizing adverse environmental effects (de Fraiture et al. Reference de Fraiture, Wichelns, Rockström, Kemp-Benedict, Eriyagama, Gordon, Hanjra, Hoogeveen, Huber-Lee, Karlberg and Molden2007).
Agricultural water management strategies addressing trade-offs between ecosystem services and agricultural production include improving water management practices on agricultural lands, better linkage with management of downstream aquatic ecosystems, and increasing efforts to manage water to create multifunctional agro-ecosystems (Gordon et al. Reference Gordon, Falkenmark and Finlayson2010).
Two important practices to increase water availability for crops entail collecting intermittent runoff by ‘water harvesting’ and ‘supplemental irrigation’ (Oweis et al. Reference Oweis, Hachum and Kijne1999; Fig. 5). Water harvesting consists of storing runoff from a larger area or flood areas in the soil profile, or in small tanks and aquifers, for use in a smaller crop area; it is an ancient practice in many arid and semiarid parts of the world, involving contour farming, terracing and micro-basins. Water harvesting differs from irrigation because the harvest area is next to the crop area, application is uncontrolled and the water can be used for more than crop production (Oweis et al. Reference Oweis, Hachum and Kijne1999). Supplemental irrigation applies a limited amount of water to the crop when rainfall fails to provide sufficient moisture for crop growth. When dry spells coincide with the most sensitive stages of crop growth, water supplied through supplemental irrigation can make a large difference in crop yield. Supplemental irrigation differs from irrigation because the added amount of water alone would not suffice for crop production (Oweis et al. Reference Oweis, Hachum and Kijne1999; Rockström et al. Reference Rockström, Hatibu, Oweis, Wani, Barron, Farahani, Karlberg, Qiang and Molden2007, Reference Rockström, Bruggeman, Oweis, Qiang, Farahani, Wani, Karlberg, Hatibu and Barron2010).
Better water management may increase water productivity, and thus needs to be examined from plant to basin scales (Barker et al. Reference Barker, Dawe, Inocencio, Kijne, Barker and Molden2003). Shifting attention from the basin to the catchment level and nesting catchment scale processes within the basin scale is advocated as a paradigm shift for rainfed agriculture (Rockström et al. Reference Rockström, Bruggeman, Oweis, Qiang, Farahani, Wani, Karlberg, Hatibu and Barron2010). In order to understand the water balance system comprehensively and systemically, research is needed to scale-up from the field (plant and farmer) level to larger areas (irrigation systems, catchment, watersheds and basins) and to scale-down from large areas to field level. Flexibility and consistency in the methodology used for changing scales is needed to undertake ID research.
Increasing water productivity requires communication among disciplines because definitions of water productivity differ based on the background of the researcher or stakeholder. Water may be accounted for at various scales; increasing yield per unit of transpiration is an important measure when the objective of analysis is crops, however, at the basin scale, obtaining more value from water used from irrigated and rain-fed crops, forests, fisheries, ecosystems and other uses is of importance (Molden et al. Reference Molden, Murray-Rust, Sakthivadivel, Makin, Kijne, Barker and Molden2003). As an example of ID research, both ecological restoration and agricultural food production in semi-arid environments require efficient methods to provide scarce water to plants; thus water harvesting and irrigation methods for ecological restoration in semi-arid ecosystems can be useful in agricultural settings (Vallejo et al. Reference Vallejo, Steinitz, Rojo, Luizao, Millán, Pulido, Schemenauer, Gracia, Ruíz-de-la-Torre, Ramírez, Cortina, Acevedo, Prieto, Kirketerp, Bosco-Senra, Botey, Gómez-Orea, Bellot and González-Alonso2009).
Scarcity of data has prevented detailed realistic modelling of system-level practices aimed at better water management. New geospatial technologies (remote sensing and GIS) can help in this undertaking (Bastiaanssen et al. Reference Bastiaanssen, Mobin-ud-Din, Zubair, Kijne, Barker and Molden2003; Ahmad et al. Reference Ahmad, Turral, Nazeer, Hussain, Thenkabail, Lyon, Turral and Biradar2009). Versatility in changing the spatial resolution of models is needed to examine catchments, watersheds and larger basins (Redfearn Reference Redfearn2005). Increasing water productivity demands ID research encompassing geospatial technologies, hydrological modelling, sustainable agricultural irrigation technologies and practices, and extension work with producers (especially smallholders). It requires understanding and modelling of socioeconomic institutions and constraints (Shivakoti et al. Reference Shivakoti, Vermillion, Lam, Ostrom, Pradhan and Yoder2005). Geospatial technologies can also play a role in understanding system and basin level water management to increase productivity (Geerken et al. Reference Geerken, Smith, Masri, Pauw, Thenkabail, Lyon, Turral and Biradar2009). Radar weather data can provide crucial information on spatial distribution of rainfall.
Remote sensing tools estimating evapotranspiration, soil moisture and precipitation can clarify variations over large areas, which is very important for watershed approaches (Kerr Reference Kerr2007; Biradar et al. Reference Biradar, Thenkabail, Platonov, Xiao, Geerken, Noojipady, Turral and Vithanage2008; Platonov Reference Platonov, Thenkabail, Biradar, Cai, Gumma, Dheeravath, Cohen, Alchanatis, Goldshlager, Ben-Dor, Vithanage, Manthrithilake, Kendjabaev and Isaev2008; Cai et al. Reference Cai, Thenkabail, Biradar, Platonov, Gumma, Dheeravath, Cohen, Goldlshleger, Ben-Dor, Alchanatis, Vithanage and Markandu2009). Installation of ground-based monitoring systems using low cost soil moisture sensors and data collection devices would prove very useful for baseline data and follow up water management interventions (World Bank 2009). Modern soil moisture detectors and wireless sensor networks hold promise for ground monitoring of soil moisture in ecosystems (Yang et al. Reference Yang, Zhang, Li, Huang, Fu and Acevedo2009). Measuring soil moisture and other properties plays an important role in precision agriculture, which further integrates sensors with information systems and enhanced agricultural machinery. Adapting production inputs within a field allows better use of water and other resources to manage both the quantity and quality of agricultural produce (Gebbers & Adamchuk Reference Gebbers and Adamchuk2010).
Improving water management at the field scale and the whole system or watershed level requires models at various spatial scales (Fig. 5). EPIC is usually employed at field scale and the Soil and Water Assessment Tool (SWAT) at the watershed scale (Gassman et al. Reference Gassman, Williams, Benson, Izaurralde, Hauck, Jones, Atwood, Kiniry and Flowers2005; Williams & Izaurralde Reference Williams, Izaurralde, Singh and Frevert2005). Integrating crop models with GIS allows exploration of water productivity at local, national and global scales. For example, basic EPIC equations in cells of a spatial grid were used to map winter wheat crop yield and water productivity in China, enabling analysis of the impacts of reducing irrigation depth and shifting to rainfed production (Liu et al. Reference Liu, Wiberg, Zehnder and Hong2007).
Although EPIC and SWAT have good crop simulation components, the use of ‘curve-number’ hydrology in both and the spatially lumped character of SWAT may make their use problematic for improved water management. The curve-number method could provide useful results when implemented appropriately, however, infiltration based on curve-number may not always be successful (Garen & Moore Reference Garen and Moore2005). Future modelling should emphasize more mechanistic models for infiltration, as well as improvements in spatial resolution achieved by dividing the simulated watershed into many small sub-basins or using distributed hydrological models, while preserving practical computation times (Redfearn Reference Redfearn2005).
Irrigation practices may produce changes in patterns of water and energy fluxes between land and the atmosphere, as demonstrated by using satellite data and models applied to irrigation in the USA (Ozdogan et al. Reference Ozdogan, Rodell, Beaudoing and Toll2010). These simulated changes are greater at local scales, but indicate that changes could be significant at continental and global scales and represent potential feedbacks between agriculture and climate.
The Surface Energy Balance Algorithm for Land (SEBAL) is the model most used to estimate evapotranspiration from croplands. Comparison with ground measurements indicates low error when used for large homogeneous areas (Ahmad et al. Reference Ahmad, Turral, Nazeer, Hussain, Thenkabail, Lyon, Turral and Biradar2009). For irrigation systems, measurements should emphasize actual water depleted by crops instead of total water supplied, since return flows could be re-used assuming there is no degradation of water quality (Ahmad et al. Reference Ahmad, Turral, Nazeer, Hussain, Thenkabail, Lyon, Turral and Biradar2009). At field scale, water depleted by crops relates to crop management and at system scale to distribution and allocation (Ahmad et al. Reference Ahmad, Turral, Nazeer, Hussain, Thenkabail, Lyon, Turral and Biradar2009). A pertinent ratio is food production by water depleted. Estimating food production by satellite is difficult since the greenness or biomass does not correlate exactly to crop yield. Thus crop statistics need to be employed as ancillary data (Ahmad et al. Reference Ahmad, Turral, Nazeer, Hussain, Thenkabail, Lyon, Turral and Biradar2009).
IMPROVING WATER PRODUCTIVITY: IMPLEMENTATION AND ADOPTION
Proposed strategies to enhance water productivity (Fig. 2, H) include empowering people to use water better, improving the governance of water resources, requiring investments in transportation, communication, extension services, credit, capacity building and education (Castillo et al. Reference Castillo, Namara, Ravnborg, Hanjra, Smith, Hussein, Béné, Cook, Hirsch, Polak, Vallée, Koppen and Molden2007). Enhanced water productivity can not only contribute to greater food security, but also have positive effects on human health and income (Castillo et al. Reference Castillo, Namara, Ravnborg, Hanjra, Smith, Hussein, Béné, Cook, Hirsch, Polak, Vallée, Koppen and Molden2007). In China, crops grown on irrigated land have a large positive effect on income, and reduce poverty and inequality (Huang et al. Reference Huang, Dawe, Rozelle, Huang and Wang2005).
Water productivity in rainfed areas may be improved by enhancing capacity of farmers to anticipate and deal with hydrological and climate events, promoting farm water management practices and incorporating broader watershed and policy issues (UNDP 2007; World Bank 2007, 2009). Hydrological and climate classification systems enable identification of areas of concern and potential ways to increase water productivity. In addition to the typical parameters included in simple classifications, other rainfall and temperature parameters, such as length of growing season (Brown & Hansen Reference Brown and Hansen2008) and other ground conditions (for example soil and topography), should be included.
Many approaches rely on learning from traditional practices (Bainbridge Reference Bainbridge2001) or even ancient practices inferred from anthropological work (Scarborough Reference Scarborough2003) to solve issues of vulnerability of human cultures and their cultivation practices to environmental changes (Fisher et al. Reference Fisher, Pollard, Israde-Alcántara, Garduño-Monroy and Banerjee2003; Turner et al. Reference Turner, Matson, McCarthy, Corell, Christensen, Eckley, Hovelsrud-Broda, Kasperson, Kasperson, Luers, Martello, Mathiesen, Naylor, Polsky, Pulsipher, Schiller, Selin and Tyler2003).
Research on socioeconomic institutions, particularly on governance and performance of irrigation systems, has shown that users’ autonomy to design management rules often leads to successful outcomes (Shivakoti & Ostrom Reference Shivakoti and Ostrom2001). However, users have to learn by trial and error to deal with patterns in biophysical systems, and the cultural and economic conditions in which the irrigation system is immersed (Ostrom Reference Ostrom1992). Unless farmers organize themselves and design their rules in a collective manner, investments in infrastructure alone may not improve system performance (Lam & Ostrom Reference Lam and Ostrom2010).
More intense interaction between crop and soil sciences, hydrology, engineering, and social and behavioural sciences, including anthropology, is needed for sound design of practices and their successful adoption. Among others, constraints on ID research include different disciplinary terminology for the same concepts, lack of consensus on performance metrics, differences in scale from farms to systems, policy and institutional barriers, and lack of commonalities in methodologies to evaluate perceptions. In addition to these factors, there are fundamental differences in the understanding of the systems involved and their interactions.
When evaluating enhancements in water productivity, water supplied is not the best metric; the amount of water actually used by the crop should be known and practices that increase water uptake by the crop are required. Conservation agriculture uses non-inversion soil preparation (ripping and subsoiling) and no-till with direct planting techniques, combined with mulch management to conserve water (Rockström et al. Reference Rockström, Hatibu, Oweis, Wani, Barron, Farahani, Karlberg, Qiang and Molden2007).
The economics of water productivity in agriculture are very complex (Barker et al. Reference Barker, Dawe, Inocencio, Kijne, Barker and Molden2003). To facilitate ID research, several terms need to be defined and properly used, namely irrigation efficiency, economic efficiency, total factor productivity and partial factor productivity (Barker et al. Reference Barker, Dawe, Inocencio, Kijne, Barker and Molden2003). These terms have been used in a variety of ways, thus making more difficult to establish cross-comparisons and developing ID research.
Strategies to increase water productivity include supplemental irrigation, soil fertility maintenance, water harvesting and other storage practices, drip irrigation and no-till (Molden et al. Reference Molden, Oweis, Steduto, Kijne, Hanjra, Bindraban and Molden2007). Implementation of strategies should recognize inequities in the benefits of adoption of water productivity, and provide incentives and compensation for greater equity (Molden et al. Reference Molden, Oweis, Steduto, Kijne, Hanjra, Bindraban and Molden2007). However, it may be more efficient to deal with equity at a broader socioeconomic scale than making specific water strategy programmes more equitable.
At the crop plant level, increased water productivity may be achieved by improving plant varieties; many agencies are funding this type of research, as success will transcend site-specific benefits. At the farm level, increasing water productivity generally requires an increase in labour and skilled management practices. At the irrigation system level, productivity may be increased by coordinating surface and groundwater resources. Decisions at the basin level are more complex and require allocations that benefit society as a whole, because non-agricultural demands are increasing in most watersheds. The objectives are many and competing: sustainability, food security and water provision (Barker et al. Reference Barker, Dawe, Inocencio, Kijne, Barker and Molden2003). Thus, it is vital to ensure poor people are represented in decision making.
Introducing conservation agriculture principles into existing agricultural systems in food insecure developing countries requires developing practices in collaboration with smallholder farmers. Assuming room for improvement in practices at the farm level, an important question is whether farmers will adopt new practices. An important area for ID research is on the adoption by farmers of innovations that could increase food production while implementing environmental conservation practices. Adoption is a dynamic learning process, it occurs when the farmers perceive that the innovation will help achieve their personal goals, represents an advantage, and is easy to test and implement (Pannell et al. Reference Pannell, Marshall, Barr, Curtis, Vanclay and Wilkinson2006). Farmers tend to adopt practices that produce tangible results (such as reducing soil erosion) rather than practices that may lead to improvements of a more abstract environmental nature, such as biodiversity.
Considerable disciplinary literature on adoption (for example economics, marketing or psychology) is available; fortunately, there are consistent results across disciplines (Pannell et al. Reference Pannell, Marshall, Barr, Curtis, Vanclay and Wilkinson2006). Overall, subjective perceptions dominate objective truth, and adoption depends on three broad groups of factors, namely the learning, the potential adopter and the innovation. The challenge is to develop adoptable innovations that help environmental conservation while representing a tangible advantage for the farmers. Communication, persuasion and education will not force adoption of a non-adoptable practice (Pannell et al. Reference Pannell, Marshall, Barr, Curtis, Vanclay and Wilkinson2006).
Interesting case studies can offer insight into adoption research into practices based on relatively simple technologies that can directly contribute to reducing food insecurity. In Malawi, many adopters of treadle pump irrigation increased their food security (Mangisoni Reference Mangisoni2006), however, dissemination costs, drought, physical effort and many other obstacles were barriers to their use.
Meta-analysis of many studies on watershed programmes in India showed a good rate of return on the investment, while generating many employment opportunities and conserving soil and water resources. Higher performance occurred in relatively dry areas, with low and medium income groups, when governments participated in the implementation and where there was effective participation (Joshi et al. Reference Joshi, Jha, Wani, Joshi and Shiyani2005).
Since the 1990s, the concept of integrated water resources management (IWRM) has emerged to place emphasis on river basins as planning and management units (Molle Reference Molle2006). Even though this is an old concept, it offers a reminder that water problems are complex and that planning must be ID and adaptive, considering the social and economic dimensions, and incorporating more participatory management (Molle Reference Molle2006). IWRM responds to the confluence of several needs: (1) an ecosystem approach, emphasizing terrestrial and aquatic systems linked by hydrology, (2) economic considerations, placing the financial burden from internalization of externalities on water users, (3) a framework to treat upstream and downstream conflicts, and (4) watershed management as a conceptual nested model designed to address problems at a local scale. Thus, IWRM reflects the growing complexity of the human-environment nexus.
RECONCILING AGRICULTURE AND ENVIRONMENTAL CONSERVATION: OPPORTUNITIES
Two environmentally aware agriculture management practices are ‘wildlife friendly farming’, which emphasizes wildlife conservation accepting loss of crop yield, and ‘land-sparing’, which proposes intensifying agriculture in some areas in order to reserve land in other areas for nature (Fig. 2, I). Wildlife-friendly agriculture has been the focus of ecologists studying avian communities and has had an important policy impact in Europe (Estrada et al. Reference Estrada, Coates-Estrada and Meritt1997; Pain et al. Reference Pain, Hill and McCracken1997; Daily Reference Daily2001; Daily et al. Reference Daily, Ehrlich and Sanchez-Azofeifa2001).
Applicability of either wildlife-friendly or land-sparing approaches may vary according to crops and species considered, and both could have negative effects on the environment. Land sparing may be more effective than wildlife-friendly farming for a range of taxa in developing countries under specific modelling assumptions (Green et al. Reference Green, Cornell, Scharlemann and Balmford2005). There is support among ecologists for land sparing by agricultural intensification, especially if greater efficiency in use of agricultural inputs, fertilizer and pesticides were achieved (Matson & Vitousek Reference Matson and Vitousek2006).
An ‘ecoagricultural’ approach includes wildlife-friendly strategies while having neutral or positive effects on agricultural production; (Scherr & McNeely Reference Scherr and McNeely2008). Ecoagriculture assumes that biodiversity at the landscape level is key to sustaining both agricultural production and the provision of ecosystem services (Brussaard et al. Reference Brussaard, Caron, Campbell, Lipper, Mainka, Rabbinge, Babin and Pulleman2010). Ecoagriculture landscapes require that agricultural and natural areas are jointly managed to produce ecosystem services (Scherr & McNeely Reference Scherr and McNeely2008). Calls to encourage scientists and decision makers to reconsider the divide between conservation-prone and intensification approaches and to look for reconciling opportunities to increase both food production and environmental protection are frequent (Robertson & Swinton Reference Robertson and Swinton2005; Brussaard et al. Reference Brussaard, Caron, Campbell, Lipper, Mainka, Rabbinge, Babin and Pulleman2010). Major proposed components of reconciliation include the valuation and payment of ecosystem services and ecoagricultural landscape approaches. However, it is necessary to make these approaches financially viable for farmers and to develop required institutions and policies (Scherr & McNeely Reference Scherr and McNeely2008).
Expanding markets for ecosystem services that farmers can provide may promote farming management practices that reduce environmental degradation, such as carbon sequestration by managing soil organic matter, methane emission reduction, water quality maintenance by reducing agrochemical use, flood control by creating wetlands and ponds, and wildlife conservation by habitat protection (Jackson et al. Reference Jackson, van Noordwijk, Bengtsson, Foster, Lipper, Pulleman, Said, Snaddon and Vodouhe2010; Ribaudo et al. Reference Ribaudo, Hellerstein, Hansen and Greene2010).
Landscape ecology can contribute to understanding the sustainability of ‘agricultural landscapes’, which are defined by integrating a multiplicity of factors (societal, economic, historic and environmental; Moss Reference Moss2000). A model-based study in Australia employed landscape ecology principles to design land management practices to balance conservation and production. Because costs remain a major barrier for implementation, fiscal incentives are required for adoption of conservation-prone agricultural management and to recognize the economic value of ecosystem services (House et al. Reference House, MacLeod, Cullen, Whitbread, Brown and McIvor2008).
Food security should not be the sole realm of agricultural agencies. An excellent example of ID collaboration in funding agencies is the Transformation of Agricultural Landscapes programme, a collaboration between Danish government funding agencies in the natural sciences, social sciences, humanities and agricultural science (Moss Reference Moss2000). This effort provides a framework for organizing academic disciplines and government-societal structures for purposes of goal-oriented interdisciplinarity, linking academic disciplines, practitioners, policy-makers and the public.
Few studies in environmental conservation focus on densely populated areas, however, these areas are of great importance for conservation given rapid changes in habitat due to land-use change (Miller & Hobbs Reference Miller and Hobbs2002). Conservation studies are required in populated areas with intense agriculture to find alternatives for practices that can potentially improve food production while helping to preserve habitat over landscape scales.
Patches of natural vegetation provide ecosystem services (such as preserving water infiltration and wildlife habitat) in agricultural areas. A study using ecological economics to reconcile landscape ecology principles with the economic viability of grazing management practices identified several beneficial practices: maintaining riparian buffers, a proportion of tree cover and high levels of grass cover, limiting intensive activities and linking vegetation patches; however poor economic rewards may prevent the adoption of such practices (MacLeod & McIvor Reference MacLeod and McIvor2006).
Conservation agriculture may increase yield while preserving resources and protecting the environment (ACT [African Conservation Tillage] Reference Mkomwa, Sims, Steiner, Apina and Mzoba2008; Thiombiano & Meshack Reference Thiombiano and Meshack2009). Three principles guiding conservation agriculture in Africa are: (1) do not turn the soil, (2) keep the soil covered and (3) rotate or associate crops. These principles are compatible with other sustainable land management practices such as agroforestry and organic food production. Although these strategies are specific to Africa, the emphasis is on sustaining soil fertility and reducing water consumption, but it remains unclear how these practices could be scaled up or adopted by a larger population of farmers (Thiombiano & Meshack Reference Thiombiano and Meshack2009).
Although many farmers in the USA and Australia have adopted direct planting and mulching systems, there is not much experience of their adoption by small farmers in developing countries. In mountain areas of Vietnam, simulation indicates that these methods increase labour and costs and would require financial subsidies for adoption (Affholder et al. Reference Affholder, Jourdain, Quang, Tuong, Morize and Ricome2010).
ID research is needed to develop analysis tools that can integrate strategies to increase food production and environmental protection. An example would be a coupled production-conservation model to simultaneously analyse strategies to increase agricultural productivity and environmental protection at the farm and landscape scales (Fig. 6). Strategies at the farm level are scaled-up to conduct landscape-level optimization, which feeds back to the agents to search for the best strategies. Although this proposal is ambitious, some experiences provide potential components and approaches (Bernknopf et al. Reference Bernknopf, Dinitz and Loague2002; Acevedo et al. Reference Acevedo, Callicott, Monticino, Lyons, Palomino, Rosales, Delgado, Ablan, Davila, Tonella, Ramirez and Vilanova2008; Le et al. Reference Le, Park and Vlek2010).
Concept map of an integrated production-conservation model to simultaneously analyse strategies to increase agricultural productivity and environmental protection at the farm and landscape scales. NGO = non-governmental organization, Gov't = governments.

CONCLUSIONS
Food insecurity remains around the world and is subject to major global challenges, while food production systems have significant impacts on global change processes. Satellite remote sensing has enhanced the understanding of global distribution of croplands. Land-use change alters habitat and water resources health and it has become crucial for food production everywhere. Land-use analysis is a perfect example of ID research involving natural and social sciences.
Global climate change can increase or decrease crop yields, depending on the location of the effects, and affect other components of food production systems. Quantitative analyses of climate change effects on food production are also examples of ID research, using climate change scenarios derived from GCMs to drive cropping system models coupled with economic models. Increased ID efforts are required to understand how to implement the efficient crop systems that mitigate climate change effects while arresting emissions.
Fewer quantitative studies have included effects of climate change on other dimensions of food security, such as food access and use, but some recent efforts demonstrate the feasibility and critical importance of ID research. Challenging aspects of global economic change are increased dependence on purchased food and associated difficulties for low-income populations to access food due to price increases. Innovations are required to develop incentives for food production. Embedded in the interaction between the food system and global processes is the intimate nexus between food production and environmental quality. ID work integrates knowledge of ecosystems and agrosystems, and provides analysis of opportunities to increase productivity.
Improving land and water productivity may increase food production. Agricultural intensification, particularly increasing land productivity, increases food production and may help spare land for nature. Efforts for long-term continuous monitoring of land-use and land-cover from local to global scales are encouraged. However, intensification increases pollution by agrochemicals and demands on water, making it imperative to increase efficiencies in the use of these inputs and emphasizing the importance of increasing water productivity in water-limited regions. Improving productivity requires renewed ID efforts to design and implement sound agricultural management practices.
Scientists and decision makers need to bridge the divide between conservation-emphasis and intensification agricultural approaches in order to reconcile the need for increases in both food production and environmental protection. Major complementary opportunities have emerged at different scales. Some push for conservation agriculture practices at the farmer or field level, using traditional methods when available, others propose to improve water management at the irrigation system, watershed and basin level, and others invoke smarter use of land while taking into account spatial patterns, ecosystem services and landscape ecology principles.
This review has identified advances in ID integration of research on agricultural productivity and environmental conservation, but possibilities for further integration and opportunities for synergy remain. More goal-directed ID research is needed, such that results are useful to producers and policy makers. ID collaborations should continue to stress the importance of informing models with empirical data from experiments and monitoring. Geospatial (for example GIS and remote sensing), biotechnological and precision agriculture technologies may contribute to increased productivity and, properly linked with models, may achieve sustainable food production increases that maintain environmental quality.
Impediments due to human factors may be identified by conducting ID research in a place-based modelling framework that employs crop and hydrological models, linked to economic, social and behavioural models. Optimization methods can then be employed to search for those practices that are more productive and amenable to adoption by farmers.
ACKNOWLEDGEMENTS
This review was prepared for the 6th International Conference on Environmental Future (ICEF), focusing on interdisciplinary progress in environmental science and management, to be held in Newcastle-upon-Tyne (UK) in July 2011. I gratefully acknowledge the organizers of the conference, the journal editors and several reviewers for their valuable comments, suggestions and contributions to this paper.