I. INTRODUCTION
Depth-sensing indentation techniques are increasingly powerful and important for studying not only nanomaterials but also classic bulk materials with fine structures. Since the macroscopic mechanical properties appear through a superposition and the interaction of the behavior of small volume constituents, an interpretation of the relationship between the microstructures and the mechanical response in a nanometer to submicrometer scale is extremely important.Reference Ohmura, Hara and Tsuzaki1, Reference Ohmura, Minor, Stach and Morris2 Yielding is one of the significant properties that has attracted much interest in the deformation behavior of bulk materials. Plasticity initiation in a small volume is an important behavior as an elementary step of the yielding phenomenon of metallic materials. Recent studies have demonstrated that indentation techniques are quite useful for the investigation of the early stage of deformation at the submicrometer length scale through an analysis of the pop-in phenomenon on a loading curve.Reference Gerberich, Nelson, Lilleodden, Anderson and Wyrobek3–Reference Minor, Asif, Shan, Stach, Cyrankowski, Wyrobek and Warren15 Many studies have been performed on the mechanisms of the pop-in phenomenon, and one of the interpretations that are certain is the dislocation nucleation and multiplication model. Gerberich et al.Reference Gerberich, Nelson, Lilleodden, Anderson and Wyrobek3–Reference Gerberich, Kramer, Tymiak, Volinsky, Bahr and Kriese6 and Suresh et al.Reference Suresh, Nieh and Choi7, Reference Gouldstone, Koh, Zeng, Giannakopoulos and Suresh8 indicated that an incipient of plasticity originates from a dislocation emission at the high stress level in an order of ideal strength. Shibutani et al.Reference Shibutani and Koyama11 proposed the prismatic dislocation loop model to understand the plastic strain in a pop-in phenomenon and showed that an excursion depth is proportional to the number of dislocations. Tsuru et al.Reference Tsuru, Shibutani and Kaji12 showed relationship of larger excursion depth with higher pop-in load in fcc metal. However, a majority of previous papers mentioned only dislocation nucleation for the mechanism of the pop-in phenomenon without any specific models. On the one hand, Minor et al.Reference Minor, Asif, Shan, Stach, Cyrankowski, Wyrobek and Warren15 revealed that dislocation nucleation occurs before the pop-in phenomenon in a pure fcc metal through in situ indentation in a transmission electron microscope (TEM). This result suggests that the pop-in phenomenon is based not on simple mechanisms such as dislocation nucleation but on other factors such as dislocation multiplication. The authorsReference Ohmura, Tsuzaki and Yin14, Reference Ohmura and Tsuzaki16, Reference Sekido, Ohmura, Hara and Tsuzaki17 demonstrated experimentally that the critical load P c in the pop-in phenomenon is significantly low in the vicinity of the grain boundary because a grain boundary acts as an effective dislocation source, indicating that the pop-in phenomenon is deeply associated with the dislocation multiplication mechanisms. Wang and NganReference Wang and Ngan18 and Britton et al.Reference Britton, Randman and Wilkinson19 showed the effect of grain boundary to pop-in behavior as a barrier to the dislocation slip transfer from one grain to adjacent grain. However, major microstructural factors governing the mechanisms must be elucidated for a further understanding of the mechanisms of the pop-in phenomenon. The present study was aimed to consider the effects of the fundamental factors of lattice defects such as grain boundary, in-solution atoms, and crystallographic structure for the pop-in behavior as an incipient plasticity.
II. EXPERIMENTAL
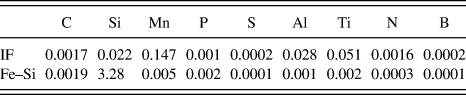
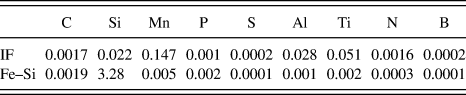
Ti-added ultralow carbon interstitial-free steel and Fe–3 mass% Si binary alloy bicrystal (hereafter called IF steel and Fe–Si alloy, respectively) were used for the samples. The chemical compositions of the samples are listed in Table I. The heat treatment processes and other details of the sample conditions are described elsewhere.Reference Ohmura, Tsuzaki and Yin14, Reference Yoshitomi, Suzuki, Ueda, Tsurekawa, Nakashima and Yoshinaga20 The IF steel has a typical grain size of approximately a couple of 100 μm. According to an analysis by the electron backscatter diffraction analysis,Reference Ohmura, Tsuzaki and Yin14 its grain boundary has a misorientation of about 30° with a rotation axis of [3, 3, 28] and is a random boundary. The grain boundary of the Fe–Si alloy bicrystal is a Σ51 <110> symmetric tilt boundary. A variety of high-purity single crystals of Al, Ag, Cu, Ni, Nb, Fe, Mo, and W were also used, and their nanoindentation measurements were obtained through a probe on the (001) plane. All the specimen surfaces for nanoindentation testing were mechanically polished and subsequently electropolished to remove the damaged layer. Nanoindentation experiments were carried out using a Hysitron, Inc., Triboindenter (Minneapolis, MN). A Berkovich indenter was used, and the tip truncation was calibrated using a reference specimen of fused silica. Analyses for the tip calibration and the calculation of hardness were conducted using the Oliver and Pharr method.Reference Oliver and Pharr21 The probed sites and the indent configurations on the specimen surfaces were confirmed before and after the indentation measurements with the scanning probe microscope (SPM) capabilities of a Triboindenter. TEM in situ microcompression test was carried out with a combination of a Hysitron, Inc., Picoindenter and a JEOL-2010F (JEOL Ltd., Tokyo, Japan) operated at 200 kV. A micropillar sample was fabricated by dual-beam focused ion beam (FIB) equipped with scanning electron microscopy (SII-Zeiss XVision200DB SII NanoTechnology Inc., Chiba, Japan).
Chemical composition of the IF steel and Fe–Si alloy (mass%).
III. RESULTS
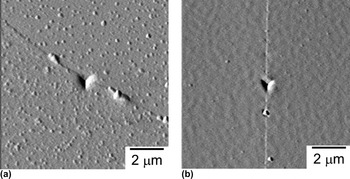
The SPM gradient images of the sample surface after nanoindentation testing using the indentation device with the capability of the SPM are shown in Fig. 1. The triangular indent marks appear clearly and nearly exactly on the grain boundary. The SPM surface profile also shows that the step height at the grain boundary is within a couple of nanometer, which is close to the surface roughness of the grain interior, and not considered to influence the accuracy of the indentation load–displacement data.
SPM images of the sample surface after nanoindentation for (a) IF steel and (b) Fe–Si alloy. The indent marks printed on the grain boundary are clearly seen.

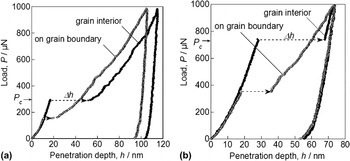
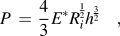
Typical load–displacement curves for the (a) IF steel and (b) Fe–Si alloy are shown in Fig. 2. The probing sites of the grain boundary and the grain interior are included in each figure, and the pop-in phenomenon is shown clearly on the loading curves. The critical load P c and the corresponding excursion depth Δh for the pop-in phenomenon are also defined on the figure. The P c is relatively higher in the grain interior than at the grain boundary in both materials. The dotted lines on the plot represent a relationship between load, P, and displacement, h, obtained by Hertz contact theoryReference Johnson22 given as
Typical load–displacement curves of (a) IF steel and (b) Fe–Si alloy. Each plot includes the cases of the grain boundary and the grain interior.

where Ri is the curvature of the indenter, E * is the reduced modulus in the equation,

where Es and νs are the Young’s modulus and the Poisson’s ratio for the specimen, and Ei and νi are the same parameters for the indenter. Substituting the values of E* = 210 GPa, Ri = 230 nm, which was obtained by using fused silica as a standard sample,Reference Ohmura, Tsuzaki and Yin14 the experimental data of the steels fit well to the dotted line; hence, the pop-in phenomenon is understood as an initiation of plasticity.
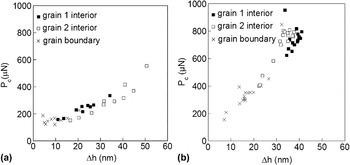
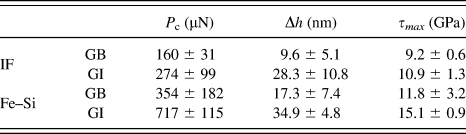
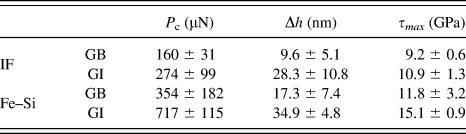
The relationships between the P c and Δh under all the conditions for both samples are plotted in Fig. 3. The cross marks represent the data for the same grain boundary in each sample. The black and white squares denote the grain interior of both sides of the grain boundary. The average of P c and Δh for 10–20 measurement points in each condition is shown in Table II. The average P c for the grain boundary is significantly lower than that of the grain interior in both materials. In addition, the P c values of both the grain boundary and the grain interior are higher for the Fe–Si alloy than for the IF steel. The plots for both materials basically show the same trend of an increasing P c with increasing Δh. This relationship can be understood as a simple function ofReference Ohmura and Tsuzaki16

Relationship between the critical load P c and the corresponding excursion depth Δh in the pop-in phenomena for (a) IF steel and (b) Fe–Si alloy.

Results from the analysis in pop-in phenomenon for IF steel and Fe–Si alloy.
where G is the shear modulus, a is the contact radius, and γ′ is the retained elastic strain after the pop-in phenomenon. The experimental data are roughly fitted to the modeled function in both samples; however, the slope of the plot for the Fe–Si alloy is much steeper than that for the IF steel. The maximum shear stress τmax underneath the indenter is calculated by the Hertz contact theoryReference Johnson22 given as
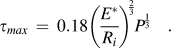
Substituting the values of E * = 210 GPa, Ri = 230 nm, and P c that were obtained from the P–h curve, τmax is calculated as shown in Table II.
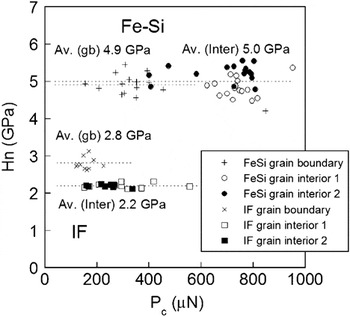
The unloading curves in the load–displacement relation show hardness for all the conditions. The evaluated hardness values are plotted as a function of the P c in Fig. 4. The averages of the hardness under all the conditions are higher for the Fe–Si alloy than for the IF steel and may have been caused by the solution hardening by Si. The values of Vickers hardness H v with 1 kgf load for the two steels are also indicated in the figure. The H v = 194 for the Fe–Si alloy is remarkably higher than that of the IF steel of H v = 72, which is consistent with the hardness by nanoindentation. A couple of interesting behaviors can be observed in this figure. The first is that the hardness does not depend on the value of P c indicating that the subsequent deformation behavior after the pop-in phenomenon has no relationship with the stress level of plasticity initiation. The second is that the average hardness of the grain boundary is slightly higher than that of the grain interior for the IF steel, while the hardness values are almost at the same level for the Fe–Si alloy.
Plot of the critical load P c of the pop-in phenomena versus the nanohardness Hn for the IF steel and Fe–Si alloy.

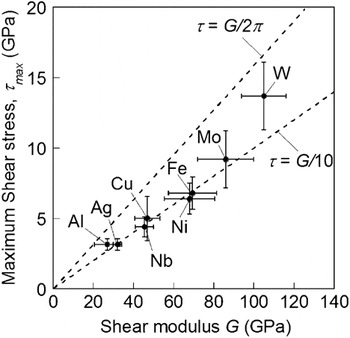
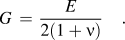
Figure 5 shows the relationship between the maximum shear stress τmax corresponding to the pop-in load P c and the shear modulus G for a variety of single crystal metals with different crystallographic structures including bcc and fcc. All the nanoindentation measurements were done on a (001) plane. The measurement gave the reduced modulus expressed in Eq. (2), which can be approximated to Young’s modulus E because of much higher modulus of diamond indenter, and then, the shear modulus G is converted from the Young’s modulus E through the equation
A linear relationship between the maximum shear stress τmax calculated from the P c of the pop-in phenomena and the shear modulus G converted from the measured Young’s modulus by nanoindentation for various materials.

E * obtained from the P–h data of nanoindentation is used as the value of E in this study. Note that the calculated shear modulus could be close to a value of polycrystalline one even though using a single crystal because the stress field underneath the indenter is multiaxial deformation and is different from uniaxial compression. All the data fit the direct proportional relation well, and the coefficient of the relation is in an order of G/10, which is very close to the value obtained from the classic Peierls potential model of
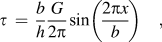
where h is the distance of the slip plane, b is the magnitude of the Burgers vector, and x is a the displacement of an atom. By approximating h to be equal to b, the maximum shear stress is given as

The values of G for molybdenum and tungsten seem to be smaller than literatures. That could be from uncertainty in experimental but it still supports the relationship between τmax and G.
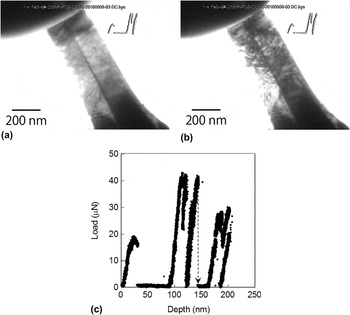
Figures 6(a) and 6(b) show video frames captured consecutively with the shortest time interval of 1/30 s during the TEM in situ compression test. Figure 6(c) shows load–displacement plot obtained simultaneously with TEM observation. The images (a) and (b) are right before and after the pop-in, which is observed as a drastic drop of load indicated by a broken arrow in Fig. 6(c). In Fig. 6(b), a significant increase of dislocation density is observed, indicating that a drastic dislocation multiplication occurred at the moment of the pop-in.
TEM images of micropillar sample of Fe–Si alloy captured in video frames during in situ microcompression test for (a) right before pop-in and (b) just after pop-in. Broken arrow in plot of load–displacement relation in (c) shows the corresponding pop-in event.

IV. DISCUSSION
A. Effect of grain boundary
As represented in Table II, the critical load P c for pop-in and the corresponding maximum shear stress τmax are significantly lower for the grain boundary than those of the grain interior for both IF steel and Fe–Si alloy. These results are understood based on the model of a stress field including dislocation/dislocation source, which is described in a previous paper.Reference Shim, Bei, George and Pharr23 In the case of the grain boundary, the indenter can probe on the grain boundary with a high accuracy less than 10 nm with the SPM imaging capability so that the stress field underneath the indenter always includes an effective dislocation source on the grain boundary. According to the Hertz contact theory,Reference Johnson22 a position with maximum shear stress is just beneath the indenter at a depth z given as
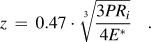
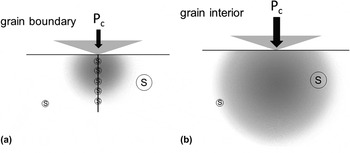
Substituting the values of E * = 210 GPa, Ri = 230 nm, and P = P c as averages of grain boundary and grain interior for the IF and Fe–Si alloy, the calculated z values are in the range from 23.9 to 39.4 nm. Although a mechanism of a dislocation source at a grain boundary is still unclear, there could be many stress concentration sites and dislocation sources because a grain boundary has a deranged lattice structure. Therefore, once the indenter probes on the grain boundary, a dislocation source is always close to the maximum shear stress region underneath the indenter. Figure 7 shows schematically the relationship between the stress distribution and dislocation sources underneath the indenter. In the case of (i) grain boundary, the dislocation source on the grain boundary is preferentially activated because the maximum shear stress is always at the grain boundary. On the other case of (ii) grain interior, it is rare to overlap the maximum shear stress position and a dislocation source; therefore, much higher applied load is necessary to activate the dislocation source that is far from the position of maximum shear stress. One thing should be mentioned that these results do not necessarily mean that the critical stress for activation of the dislocation source is lower for the grain boundary than that of grain interior because some data of P c value for grain interior are in the same level with grain boundary as shown in Fig. 3.
Schematics of the stress field underneath the indenter and special distribution of dislocation sources (“S” circled with solid line) for the cases of (a) grain boundary and (b) grain interior. The size of the circle denotes a potency of dislocation source.

Another important result is that the average P c on the grain boundary is higher for the Fe–Si alloy than IF steel. A couple of possible factors exist in the materials. One is the grain boundary structure, i.e., the grain boundary in IF steel is an asymmetric but the Fe–Si alloy has a symmetric one. It is difficult to estimate the effect of the grain boundary structure but it might be minor because hardening effect of grain boundary does not depend on a type of a grain boundary.Reference Eliash, Kazakevich, Semenov and Rabkin24 The other factor is the difference in the composition of silicon. The in-solution silicon near the grain boundary could have an effect for the higher P c because silicon has a significant solution hardening effect as shown in Fig. 4. Since most of the dislocations from the source at the grain boundary move into the grain interior, the higher resistance to dislocation glide by in-solution Si could cause a higher back stress to the dislocation source leading to the higher critical stress for activation. Note that grain boundary is a prior site of segregation especially for interstitial atoms such as carbon and nitrogen. The compositions of carbon and nitrogen in the two materials are very close; hence, the effect of the interstitial atoms at the grain boundary could be the same. We should make sure the difference in the mechanism of pop-in behavior between the study by Wang and Ngan,Reference Wang and Ngan18 the study by Britton et al.,Reference Britton, Randman and Wilkinson19 and the present work. They demonstrated that an obvious pop-in behavior occurs when a plastic zone across the grain boundary. The corresponding pop-in load is in an order of 10 mN, which is almost two orders higher than that in the case of the present work. Additionally, their indent print is off grain boundary, while the indent mark is closer to the grain boundary in the preset work. Accordingly, in the present case, the pop-in phenomenon is associated with the onset of plasticity, which is totally different mechanism in the work by them.
As shown in Fig. 4, the hardness Hn does not depend on the P c in all the cases, which is consistence with the result in the previous work.Reference Ohmura and Tsuzaki16 This behavior indicates that the subsequent deformation behavior has no relation with the stress level of plasticity initiation. An interest point in Fig. 4 is that the average of Hn for the grain boundary is very close to that of grain interior for the Fe–Si alloy, while the Hn of the grain boundary is higher than the grain interior for IF. This suggests that the contribution of the grain boundary to the hardness is relatively small when the hardness of the grain interior is high. In other words, in the case of the higher hardness in grain interior, the contribution of the grain boundary might be buried by the surrounding matrix. The higher macroscopic hardness in Fe–Si alloy is caused mainly by solid solution hardening because the grain sizes are much larger than the indentation-induced plastic zone size in both materials. This result is important to consider the adequacy of the additivity of strengthening factors but we still need much more evidences to conclude it. As indicated in a previous work by Westbrook,Reference Westbrook25 segregation is a possible factor for strengthening of grain boundary. In the present study, however, IF sample, which shows higher hardness in grain boundary, has very few in-solution carbon so that an effect of segregation is presumably small enough to be ignorable.
B. Effect of in-solution silicon
The substitutional Si atoms have a significant effect to increase the value of P c as shown above. The higher average of P c could be understood based on the model of dislocation–point defect interaction. In the elastic interaction and/or modulus interaction models,Reference Dieter26 a solute Si atom causes remarkable interaction energy with dislocation.
We should consider a model of the pop-in mechanism before discussion of the effect of Si. As described in Sec. I, the TEM in situ indentation study revealed that dislocation nucleation occurs before pop-in.Reference Minor, Asif, Shan, Stach, Cyrankowski, Wyrobek and Warren15 Additionally, Fig. 6 demonstrates the drastic increase of dislocation density at the moment of pop-in phenomenon. These results suggest that the mechanism of pop-in is associated with not only dislocation nucleation but also multiplication because a large amount dislocation is necessary for the significant plastic strain. Since the initial dislocation density is quite low in both materials, the dislocation source must be generated under the indentation stress field within the defect-free region. One of the models of the formation of a dislocation source is double cross slip mechanism to generate a Frank–Read type. The critical shear stress τc for activating the Frank–Read source is given as

where l is the Frank–Read length. If the τmax reaches the τc, the dislocation density instantaneously increases leading to the pop-in phenomenon. Since the solute Si makes the friction stress higher on the slip plane, which is presumably regarded as higher G in local region, a higher P c is brought by the higher τc due to the larger G in Eq. (9).
Another possibility for the higher P c by Si solute is the effect for dislocation mobility.Reference Sekido, Ohmura, Zhang, Hara and Tsuzaki27 Since the shear stress underneath the indenter corresponding to the pop-in phenomenon is in an order of ideal strength as indicated from the previous works,Reference Gerberich, Kramer, Tymiak, Volinsky, Bahr and Kriese6, Reference Gouldstone, Koh, Zeng, Giannakopoulos and Suresh8 a dislocation shear loop can be nucleated within the high shear stress region. Then, the dislocation loop glides, which may lead to a double cross slip, and results in the formation of a Frank–Read source. The Frank–Read length may be affected by the mobility of edge dislocation since the Frank–Read length is consistent with a segment of a cross-slipped screw dislocation, which is parallel to the direction of the edge dislocation glide motion. Therefore, the Frank–Read length may depend on the mobility of an edge dislocation. The edge dislocation mobility is depressed by the high friction stress due to a substitutional Si; hence, the Frank–Read length becomes shorter and the τc becomes larger. These considerations on the modulus effect are supported by the result in Fig. 5, which shows that the P c increases with shear modulus G. Dub et al.Reference Dub, Zasimchuk and Matvienko28 indicated that solid solution impurity of iridium in molybdenum leads to an increase not only in the plastic strain resistance but also in the elastic shear stress. Their results are consistent with the present data, but it is still necessary to consider the exact model of impurity atoms to pop-in behavior. Another study by Due et al.Reference Dub, Lim and Chaudhri29 discussed the typical size of the process in homogeneous nucleation of dislocation in high-purity single crystal in copper. They discussed that the size in radius of a nucleated dislocation loop is in an order of nanometer through the estimation of the ideal shear strength. Appling this model to our samples, the effect of alloying element can be dominated by an interaction between single impurity atom and single dislocation, which is totally different from the conventional static model of solid solution hardening. Therefore, the modulus effect seems to be much more localized phenomenon such as electron density near dislocation core with impurity atom, which is also far from a behavior of bulk state. To reveal the local mechanism of impurity–dislocation interaction, various approaches may be necessary by theoretical and simulation studies as well as experimental works.
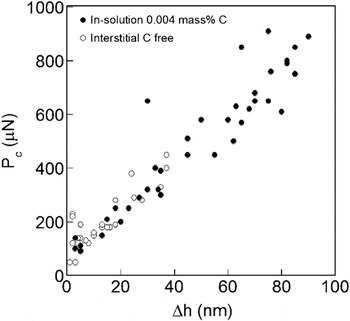
Another important effect of Si is the higher slope in the relation between P c and Δh that is shown in Fig. 3. This behavior is totally different from the case in Fe–C as presented in the previous work.Reference Sekido, Ohmura, Zhang, Hara and Tsuzaki27 In the case of Fe–C, the average P c increases remarkably by in-solution carbon, which is the same effect by Si; however, the slope in the plot of P c and Δh is the same with that of IF as shown in Fig. 8. For understanding the effect of Si, we assume that the higher slope in the plot is synonymous with a smaller Δh with the same P c. Consequently, the reason for the smaller Δh for the Fe–Si alloy should be considered. One presumable possibility is an inability to the cross slip in Fe–Si alloy. The previous papersReference Sestak and Libovicky30, Reference Boettner and McEvily31 showed that the slip favored on the {110} planes in the Fe–Si alloy, while pure iron has a wavy slip plane involve slip planes of {110}, {112}, and {123}. This behavior is understood as a decreasing in an inability of cross slip in Fe–Si alloy. The limitation of the slip plane causes higher flow stress because dislocations cannot get around an obstacle on the slip plane due to the inability of cross slip. Accordingly, the mean free pass of dislocations upon pop-in phenomenon is reduced; hence, the number of dislocations emitted from a dislocation source decreased due to a back stress from pile-up dislocations. Based on the prismatic dislocation loop model,Reference Shibutani and Koyama11 Δh is proportional to the number of dislocations emitted upon pop-in event as described above in Sec. I; hence, the Δh is depressed with the same trigger load P c resulting the higher slope in the Pc and Δh plot.
Relationship between the critical load P c and the corresponding excursion depth Δh in the pop-in phenomena for steels with and without in-solution carbon.Reference Eliash, Kazakevich, Semenov and Rabkin24

V. SUMMARY
Indentation-induced deformation behavior especially in the early stage of the loading process for various materials was investigated through the analysis of the pop-in behavior as a plasticity initiation. Grain boundaries depressed the P c in both the IF steel and the Fe–Si alloy, which means that the grain boundary acted as an effective dislocation source. In the plot of P c versus Δh, the average of the P c value was higher for the Fe–Si alloy than for the IF steels. Furthermore, the coefficient of the Pc–Δh relation was also higher in the Fe–Si alloy. Since the maximum shear stress for the pop-in phenomenon is directly proportional to the shear modulus in the single crystals with various lattice structures, the elastic effect and/or modulus effect by the substitutional Si atoms are probably the factor for the higher P c value in the Fe–Si alloy.
ACKNOWLEDGMENTS
The authors would like to thank Prof. Nakashima in Kyusyu University for providing the Fe–Si alloy sample. This work is partially supported by the Ministry of Education, Science, Sports and Culture, Grant-in-Aid for Scientific Research (C) No. 23560852 (2011).