Introduction
Vapor condensation is a ubiquitous phenomenon occurring in nature.Reference Parker and Lawrence1–Reference Mockenhaupt, Ensikat, Spaeth and Barthlott5 We observe this process in our daily lives, such as on a hot summer day when water accumulates on a cold drink container or on a humid day when fog forms. In industry, vapor condensation is an essential process in power generation,Reference Beer6 thermal management,Reference Peters, McCarthy, Allison, Dominguez-Espinosa, Jenicek, Kariya, Staats, Brisson, Lang and Wang7 water desalination,Reference Khawaji, Kutubkhanah and Wie8,Reference Humplik, Lee, O’Hern, Fellman, Baig, Hassan, Atieh, Rahman, Laoui, Karnik and Wang9 and environmental control.Reference Perez-Lombard, Ortiz and Pout10 For example, the thermal efficiency of the steam cycle, typically responsible for a major fraction of a nation’s power production, is directly linked to condensation heat transfer performance. Meanwhile, in heating, ventilating, and air conditioning (HVAC) systems, which account for ≈20% of the total energy consumption in developed countries,Reference Li and Yao11 the accumulation of condensed water on thermal components can lead to performance degradation and increased costs. Furthermore, condensation on glass strongly influences the transmittance of light into greenhouses, resulting in a potential 40% decrease in solar energy entering the greenhouse during the winter.Reference von Elsner, Briassoulis, Waaijenberg, Mistriotis, von Zabeltitz, Gratraud, Russo and Suay-Cortes12
In all of these industrial systems, vapor condenses on a surface rather than directly in the vapor phase due to the reduced energy barrier for droplet nucleation.Reference Kaschiev13 However, the vapor typically forms a thin liquid film because of the high surface energy of industrial components (i.e., clean metals such as copper, aluminum, stainless steel). While this mode known as filmwise condensationReference Nusselt14 (Figure 1a) is quite common, the formation of a liquid film is not desired due to the large resistance to heat transfer. Meanwhile, if a surface is coated with a low-energy non-wetting “promoter” material (i.e., long chain fatty acid, wax, polymer coating, self-assembled monolayer),Reference Marto, Looney, Rose and Wanniarachchi15–Reference Das, Kilty, Marto, Andeen and Kumar19 or if it naturally adsorbs hydrocarbons and impurities on its surface from the surroundings (as in the case of gold, silver, and chromium),Reference Erb and Thelen20–Reference Woodruff and Westwater22 the vapor forms discrete liquid droplets ranging in size from microns to millimeters.Reference Beysens23–Reference Fritter, Knobler and Beysens25 This process is known as dropwise condensationReference Schmidt, Schurig and Sellschopp26 (Figure 1b). The progressive removal of these condensing droplets by gravity at length scales comparable to the capillary length (≈2.7 mm for water)Reference Kim, Lee and Kang27–Reference Boreyko and Chen29 helps refresh the surface for re-nucleation and allows 5–7 times higher heat transfer performance when compared to the filmwise mode.Reference Rose30
Condensation heat transfer modes and performance. Images of (a) filmwise condensation on a smooth hydrophilic Cu tube, (b) dropwise condensation on a silane coated smooth Cu tube, (c) jumping-droplet superhydrophobic condensation on a nanostructured CuO tube (inset: magnified view of the jumping phenomena, scale bar is 500 µm), and (d) flooding condensation on a nanostructured CuO tube.Reference Miljkovic, Enright, Nam, Lopez, Dou, Sack and Wang47 (e) Heat transfer measurements for dropwise condensation of steam at near-atmospheric pressureReference Rose30 (ΔT = T sat(P v)–T wall). Superhydrophobic region shows expected performance enhancement due to increased droplet mobility. Note: NCG, non-condensable gas; T sat, vapor saturation temperature; P v, vapor pressure; T wall, condensing surface temperature. Reprinted with permission from Reference Reference Miljkovic, Enright, Nam, Lopez, Dou, Sack and Wang47. © 2013 American Chemical Society.

Since its discovery eight decades ago, dropwise condensation on common heat transfer materials has been a topic of significant interest,Reference Rose30,Reference Sikarwar, Khandekar, Agrawal, Kumar and Muralidhar31 with a focus on creating non-wetting surfaces via promoter coatings for easy droplet removal. While robust coatings still continue to be a challenge and require more development,Reference Rose30 recent advancements in nanofabrication have allowed for the development of superhydrophobic surfaces,Reference Lafuma and Quéré32 on which nearly spherical water droplets form with high mobility and minimal droplet adhesion. In addition, the role of surface structuring on wetting characteristics have been studied in detailReference Patankar33–Reference Kang, Wu, Grinthal and Aizenberg35 to enhance condensation performance by reducing droplet departure sizes to below that of the capillary length (≲3 mm for water) and enabling faster clearing of the surface for re-nucleation.
Yet when small water droplets (≈10−100 μm) merge on suitably designed superhydrophobic surfaces, they can undergo coalescence-induced droplet ejection or “jumping” due to the release of excess surface energy (Figure 1c).Reference Boreyko and Chen29 Jumping droplet condensation has offered a new avenue to further enhance heat transfer by increasing the time-averaged density of small droplets. However, if the nucleation density is too high and the spacing between droplets is reduced, droplet jumping cannot be sustained. Under such conditions, discrete non-jumping droplets form that are strongly adhered to the surface and can have even worse performance than dropwise condensation, leading to a flooding condensation mode (Figure 1d). The different fluid-surface interactions of the four modes described previously (filmwise, dropwise, jumping, and flooding) accordingly determine the heat transfer performance.
To characterize the condensation performance, the heat flux q″ is a commonly used metric to quantify the amount of latent heat of phase change removed by the surface at a given driving potential. This driving potential is represented by either the temperature difference (ΔT) between the vapor (T sat(P v)) and condensing surface (T wall), ΔT = T sat(P v)–T wall, or the supersaturation, S, the ratio of the vapor pressure (P v) to the saturation pressure (P sat) at the surface temperature (T wall), S = P v / P sat(T wall). Accordingly, Figure 1e summarizes the measured (filmwise and dropwise) and expected (jumping and flooding) performance of the four modes, showing q″ with ΔT for steam at atmospheric pressure.Reference Rose30 If the condensing steam is mixed with non-condensable gases (NCGs) that do not undergo a phase transition during the condensation process (e.g., air), the NCG can accumulate adjacent to the surface, creating an additional diffusional resistance for vapor molecules. The high sensitivity of condensation heat transfer to small amounts (<10 ppm) of air in the steam explains the large range of values and trends shown in Figure 1e for the case of dropwise condensation with NCGs. With the development of superhydrophobic materials, the heat transfer performance should theoretically be able to exceed that of the highest values reported with dropwise condensation. However, due to the complex fluid-surface interactions, the role of structures for enhanced condensation on superhydrophobic surfaces has been unclear until recently, where we have gained new understanding of fluid-surface processes during phase change.
In this article, we review the fabrication, characterization, wettability, and interfacial dynamics of superhydrophobic materials during condensation and discuss insights from recent studies for enhanced heat transfer performance. This article focuses on water as the working fluid due to its favorable heat transfer properties (i.e., high latent heat of vaporization) and its common use in industry. To better understand the physics of the process, we examine the role of surface structure on emerging droplet morphology, nucleation density, droplet growth rate, and departure characteristics. Furthermore, we discuss scalable materials for superhydrophobic surfaces with experimentally demonstrated heat transfer performance. Finally, we provide perspectives for the development of next-generation nanostructured materials for enhanced condensation heat transfer.
Condensation physics on superhydrophobic surfaces
Wetting phenomena
We first briefly provide background information related to wetting phenomena to facilitate understanding of condensation on superhydrophobic surfaces. When a droplet is deposited on a smooth surface, it can either wet the surface or form a discrete droplet, depending on the surface energy. YoungReference Young36 first proposed that the equilibrium contact angle, θ, of the droplet is dictated by a force balance at the three phase contact line:
 $$\cos {\rm{\theta }} = {{{\rm{\gamma }}_{{\rm{sv}}} - {\rm{\gamma }}_{{\rm{sl}}} } \over {{\rm{\gamma }}_{{\rm{lv}}} }},$$
where γsv, γsl, and γlv are the solid-vapor, solid-liquid, and liquid-vapor surface tensions, respectively. Continuing the work of Young, Wenzel and Cassie subsequently extended the wetting analysis to rough and porous surfaces. Considering a surface with roughness r, defined by the ratio of the total surface area to the projected area, WenzelReference Wenzel37 showed that when the fluid wets all of the rough area, the contact angle θw is defined by:
 $$\cos {\rm{\theta }}_{\rm{w}} = r\cos {\rm{\theta }}.$$
In contrast, Cassie and BaxterReference Cassie and Baxter38 considered the case where the droplet rests on the tips of the roughness and showed that the contact angle θc is defined by:
 $$\cos {\rm{\theta }}_{\rm{c}} = \varphi \left( {\cos {\rm{\theta + 1}}} \right) - 1,$$
where φ is the ratio of the solid area contacting the droplet to the projected area. The two droplet morphologies described in Equations 2 and 3 are termed Wenzel and Cassie, respectively (see the Introductory and Kota et al. article in this issue). Accordingly, in the case of hydrophobic surfaces (θ > 90°), the roughness amplifies the wetting characteristics such that the surface becomes superhydrophobic, where contact angles exceed 150°. While Wenzel and Cassie droplets can both exist on these rough surfaces, the Wenzel state is less desired, owing to the higher adhesion to the substrate compared to the low adhesion Cassie state.Reference Lafuma and Quéré32 As a result, over the past decade, studies have focused on developing superhydrophobic surfaces to limit droplet adhesion and increase water repellency.Reference Lafuma and Quéré32,Reference Gao, Fadeev and McCarthy39–Reference Moulinet and Bartolo43
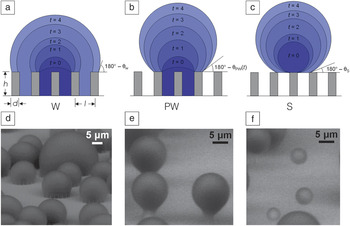
In the case of condensation, however, the nucleation of droplets through the vapor phase can initiate within the roughness, such that Equations 2 and 3 may not apply. Previous studies have shown that on structured superhydrophobic surfaces with well-controlled geometries (defined in Figure 2a), highly adhered Wenzel droplets form during vapor condensation, which are distinct from the highly mobile Cassie droplets, which form when liquid is deposited using a syringe.Reference Lafuma and Quéré32,Reference Narhe and Beysens44–Reference Narhe and Beysens46 In fact, three different droplet morphologies exist during condensation, Wenzel (W) (Figure 2a, d), partially wetting (PW) (Figure 2b, e), and suspended (S) (Figure 2c, f), where both S and PW droplets are highly mobile compared to W droplets. Due to the importance of minimizing droplet adhesion, knowledge of the emergent droplet morphology needs to be properly characterized and understood in order to tailor the micro/nanostructured surfaces with controlled roughness (i.e., surface structuring, for enhanced heat transfer).Reference Miljkovic, Enright, Nam, Lopez, Dou, Sack and Wang47
Condensing droplet morphologies. Time-lapse schematics of a (a) Wenzel (W) droplet where liquid fills the structures beneath the droplet; (b) partially wetting (PW) droplet where the liquid partially fills the structure beneath the droplet, and (c) suspended (S) droplet where an air layer fills the structure beneath the dropletReference Miljkovic, Enright and Wang84 (schematics not to scale). Environmental scanning electron microscopyReference Stokes120–Reference Rykaczewski, Landin, Walker, Scott and Varanasi130 images of droplets with the (d) W, (e) PW, and (f) S morphologies on a nanostructured surface (h = 6.1 μm, l = 2 μm, d = 300 nm). Note: t, time; θw, Wenzel droplet contact angle (Equation 2); θpw, partially wetting contact angle; θs, suspended droplet contact angle. Reprinted with permission from Reference Reference Miljkovic, Enright and Wang84. © 2013 American Society of Mechanical Engineers.

Structure geometry and nucleation density
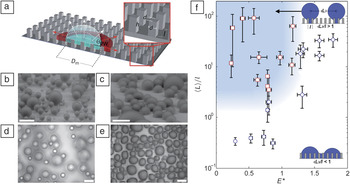
Structure geometry and nucleation density have specific roles in the emergent droplet morphology (W, PW, or S). Previous studies have shown that there is a length-scale dependence of the surface structuring (i.e., microstructuresReference Narhe and Beysens45,Reference Dorrer and Ruhe48,Reference Wier and McCarthy49 versus nanostructuresReference Boreyko and Chen29,Reference Chen, Cai, Tsai, Chen, Xiong, Yu and Ren50–Reference Lau, Bico, Teo, Chhowalla, Amaratunga, Milne, McKinley and Gleason53 ) and that global thermodynamic analysis comparing the lower equilibrium energy state (i.e., Cassie versus Wenzel) is insufficient,Reference Quéré40 although often used to explain observed condensation behavior.Reference Narhe and Beysens45,Reference Narhe and Beysens46,Reference Dorrer and Ruhe48,Reference Wier and McCarthy49,Reference Rykaczewski, Osborn, Chinn, Walker, Scott, Jones, Hao, Yaod and Wang54 Recently, Enright et al. showed that the morphology of isolated droplets interacting with the surface structures during growth from within a unit cell (volume between structures) is primarily due to (1) energy barriers encountered by the droplet growing within the structured surface (Figure 3a), and (2) droplet–droplet interactions governed by the nucleation density (i.e., the average spacing between nucleation sites 〈L〉 relative to the structure length scale l).Reference Enright, Miljkovic, Al-Obeidi, Thompson and Wang55 Meanwhile, S droplets nucleating on the tips of structures are unconditionally stable, assuming no droplet–droplet interactions and external forces such as gravity.
Effect of structure length scale and nucleation density on emergent droplet morphology. (a) Schematic of a droplet growing within the confines of the structures. The liquid can either grow laterally by filling the adjacent structures or by growing upward above the structures.Reference Rykaczewski, Osborn, Chinn, Walker, Scott, Jones, Hao, Yaod and Wang54 Condensed droplet growth observed using environmental scanning electron microscopy on structured surfaces with (b) Cassie droplets, where l = 2 μm, and (c) Wenzel droplets, where l = 4 μm.Reference Enright, Miljkovic, Al-Obeidi, Thompson and Wang55 Scale bar for (b, c) is 60 μm. Condensation behavior on a microstructured surface (l = 4.5 μm, d = 2 μm, h = 5 μm, and E* = 0.75 ± 0.04) is shown at a fixed location with a scaled coalescence length of (d) 〈L〉/l = 3.54 ± 2.43 (PW droplets) and (e) 〈L〉/l = 2.04 ± 0.6 (W droplets).Reference Enright, Miljkovic, Al-Obeidi, Thompson and Wang55 Scale bar for (d, e) is 50 μm. (f) Regime map characterizing the dominant wetting behavior observed during condensation with coordinates of 〈L〉/l and E*. PW morphologies (red □) emerge at large 〈L〉/l and E* ≲ 1 (shaded region). Wenzel morphologies (blue ○) emerge at low 〈L〉/l and/or E* ≳ 1.Reference Enright, Miljkovic, Al-Obeidi, Thompson and Wang55 Note: E*, dimensionless energy ratio; θPW, advancing contact angle; D m, wetted basal diameter; 〈L〉, average distance between droplet nucleation sites. Adapted with permission from Reference Reference Enright, Miljkovic, Al-Obeidi, Thompson and Wang55. © 2013 American Chemical Society, and Reference Reference Rykaczewski, Osborn, Chinn, Walker, Scott, Jones, Hao, Yaod and Wang54. © 2012 Royal Society of Chemistry.

Enright et al. focused on droplets nucleating within the unit cell because they are more desirable for enhanced heat transfer. Their study showed that these droplets can either grow above the structure forming a “balloon”-like PW droplet (Figure 3b), or laterally spread into the structure forming a highly adhered W droplet (Figure 3c).Reference Rykaczewski, Osborn, Chinn, Walker, Scott, Jones, Hao, Yaod and Wang54,Reference Enright, Miljkovic, Al-Obeidi, Thompson and Wang55 While the droplet morphology is dictated by the intricate liquid/structure interaction dynamics, it can be approximately predicted by comparing the energies of the non-equilibrium advancing Cassie and Wenzel states with a dimensionless energy ratio:
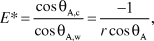 $$E* = {{\cos {\rm{\theta }}_{{\rm{A,c}}} } \over {\cos {\rm{\theta }}_{{\rm{A,w}}} }} = {{ - 1} \over {r\cos {\rm{\theta }}_{\rm{A}} }}$$
where r = 1 + πdh/l 2 is the surface roughness, d is the structure width/thickness, h is the structure height, l is the center-to-center distance between adjacent structures, and θA is the advancing contact angle on a flat surface. Equation 4 implies that when E* > 1, W droplet morphologies are favored, while when E* < 1, PW droplets should emerge.Reference Enright, Miljkovic, Al-Obeidi, Thompson and Wang55 In addition to this energy criterion, the nuclei of the droplets need to be 2–5 times the spacing between the structures (Figure 3d) (〈L〉/l > 2−5). If droplets grow and merge too close to each other such that 〈L〉/l < 2−5, coalescence events bypass the energy barrier associated with individual droplet growth (Equation 4) and flood the surface, forming undesired highly adhered W droplets (Figure 3e). Accordingly, a regime map defining the parametric space with experimentally measured 〈L〉/l ratios and calculated E* in Figure 3f determines the emergent droplet morphology for a wide variety of structure length scales, geometries, and nucleation densities. The results suggest that an important aspect is defining the location of, and distance between, nucleation sites to favor formation of highly mobile PW droplet morphologies.
Tailoring surface chemistry for nucleation
Controlling nucleation has been investigated but has primarily focused on patterning surface chemistry heterogeneitiesReference Anderson, Gupta, Voevodin, Hunter, Putnam, Tsukruk and Fedorov56–Reference Thickett, Neto and Harris62 (hybrid hydrophobic/hydrophilic surfaces) at the length scale of the structures or larger to simultaneously increase the nucleation rate (hydrophilic spots) and achieve high droplet mobility (hydrophobic spots). Although spatial control of nucleation has been demonstrated,Reference Varanasi, Hsu, Bhate, Yang and Deng58 it was also accompanied by higher droplet adhesion.Reference Yao, Garvin, Alvarado, Jacobi, Jones and Marsh63 The hydrophilic spots on the surface act to pin the droplet and result in slower removal.Reference Rose30 However, S droplets with low adhesion were obtained using hybrid surfaces by ensuring that the height-to-thickness ratio of the structures (i.e., with pillars having hydrophilic tops and hydrophobic valleys) is relatively large (>2).Reference Yao, Garvin, Alvarado, Jacobi, Jones and Marsh63 Therefore, with proper design, hybrid surfaces have the potential to enhance droplet shedding for enhanced condensation while controlling nucleation density.
To define the location of nucleation sites at length scales smaller than the structure (<10 nm), in order to delay flooding condensation, Enright et al.Reference Enright, Miljkovic, Al-Obeidi, Thompson and Wang55 showed that defects (i.e., spots of incomplete coverage) in the hydrophobic coatings exist,Reference Love, Estroff, Kriebel, Nuzzo and Whitesides64–Reference Mandler and Turyan66 which with the proper structure geometry can be used to determine the formation of highly mobile PW and S droplets. Hydrophobic coatings with tailored defects present an opportunity to control droplet morphology while further enhancing heat transfer.
Effect of droplet morphology on growth dynamics
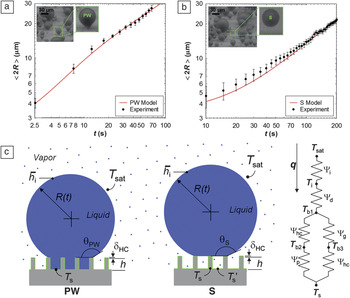
While both PW and S droplets show advantages in terms of easy droplet removal as opposed to W droplets, droplet growth prior to departure needs to be considered to determine the desired morphology for enhanced heat transfer. Miljkovic et al.Reference Miljkovic, Enright and Wang67 highlighted the importance of considering droplet morphology on growth rates, whereby in certain cases, surface structuring can degrade heat transfer performance. Using a specific structure geometry, they demonstrated that the growth rate (Figure 4a–b) and individual droplet heat transfer of PW droplets were 6 and 4–6 times higher than that of S droplets, respectively. This difference was due to the fact that S droplets are suspended on top of a composite air-solid interface, where the air adds significant thermal resistance for droplet growth. To investigate the effect of the morphology on overall surface heat transfer, a thermal-resistance-based droplet growth model was developedReference Miljkovic, Enright and Wang67–Reference Anand and Son71 (Figure 4c), and it was demonstrated that surfaces favoring only S droplet formation degraded the overall heat transfer coefficient by 71% when compared to flat hydrophobic shedding surfaces, despite their high mobility.Reference Miljkovic, Enright and Wang67 The study showed that structure design needs to be carefully considered to minimize the effect of the air beneath the droplet, while maintaining easy droplet removal. Accordingly, this thermal resistance can be decreased by reducing the structure heights via nanoscale roughness.
Effect of droplet morphology on growth rate. Time evolution of the average droplet diameter for (a) partially wetting (PW) and (b) suspended (S) droplets (h = 6.1 μm, l = 2 μm, d = 300 nm). The S droplet had a slower growth rate than the PW droplet due to poor thermal contact between the base and substrate.Reference Miljkovic, Enright and Wang67 (c) PW and S droplet model schematics and thermal resistance diagram showing the liquid-vapor interface (Ѱi), droplet conduction (Ѱd), hydrophobic coating (Ѱhc), pillar (Ѱp), and gap (Ѱg) thermal resistances.Reference Miljkovic, Enright and Wang67 Note: t, time; T s, substrate temperature at the base of a pillar; T s′, substrate temperature in between two adjacent pillars; h, pillar height;  i, interfacial heat transfer coefficient; T sat, vapor saturation temperature; R(t), droplet radius as a function of time; T i, liquid-vapor interface temperature; T b1, hydrophobic coating surface temperature on the tips of the pillars; T b2, pillar/hydrophobic coating interface temperature; T b3, hydrophobic coating surface temperature in the valleys of the pillars; q, individual droplet heat transfer rate; δ hc, hydrophobic coating thickness; θS, suspended droplet contact angle; θPW, partially wetting droplet contact angle. Reprinted with permission from Reference Reference Miljkovic, Enright and Wang67. © 2012 American Chemical Society.

To tailor the emergent droplet morphology, Miljkovic et al.Reference Miljkovic, Enright, Nam, Lopez, Dou, Sack and Wang47 suggested a method to favor PW droplet formation via the creation of thermodynamic energy barriers for nucleation on structure tips.Reference Cao, Jones, Sikka, Wu and Gao72 By making the tip thickness comparable to the critical nucleation radius (≈10–30 nm for water), the energy barrier for nucleation on the tip is increased, resulting in favorable droplet nucleation within the structure and stable formation of PW droplets.Reference Miljkovic, Enright, Nam, Lopez, Dou, Sack and Wang47 It is important to note that this approach is valid, assuming the nucleation density of droplets is low compared to the density of the structures (〈L〉/l > 2−5) such that flooding is avoided (Figure 3f).
Droplet departure
Once the droplets nucleate and grow with the desired morphology, droplets also need to be quickly removed from the surface to enhance heat transfer.Reference Rose and Glicksman73 Recent work by Boreyko et al.Reference Boreyko and Chen29 and Narhe et al.Reference Narhe, Khandkar, Shelke, Limaye and Beysens74 present a new method for efficient droplet departure, whereby in contrast to gravitational shedding on a smooth hydrophobic surface (Figure 5a), condensate droplets spontaneously jump on a superhydrophobic surface without any external forces (Figure 5b). The average droplet radius at steady state was 30 times smaller than the capillary length (≈2.7 mm for water), and therefore promises significant heat transfer improvement due to the smaller time-averaged distribution of droplets.Reference Dietz, Rykaczewski, Fedorov and Joshi75 The spontaneous motion is powered by the surface energy released upon droplet coalescence and the out-of-plane jumping results from in-plane coalescence (Figure 5c–d). While both PW and S droplet morphologies are capable of jumping at equivalent length scales,Reference Miljkovic, Enright and Wang76 as discussed earlier, PW droplets are favored due to their higher growth rates.Reference Miljkovic, Enright and Wang67 It is important to note, if the solid fraction of the structure is too large (φ ≥ 0.1), PW and S droplet jumping may not be possible due to high adhesion.
Droplet departure modes—gravitational shedding versus jumping. Dropwise condensation on a horizontally oriented (a) smooth hydrophobic surface and (b) structured two-tier superhydrophobic surface (with micro-pillars visible). Stages 1–3 of the condensation process characterize the initial nucleation, immobile coalescence, and mobile coalescence (jumping droplets), respectively.Reference Boreyko and Chen29 (c) Coalescing process of two droplets. Upper photos: side-view images of two condensed drops with diameters of 302 and 252 µm during merging; lower: modeled coalescence process.Reference Liu, Sun, Sun and Ai83 (d) Coalescence-induced transformation and jumping of the merged droplet. Upper photos: side-view images of coalescence-induced droplet jumping; lower: modeled coalescence-induced droplet jumping.Reference Liu, Sun, Sun and Ai83 Reprinted with permission from Reference Reference Boreyko and Chen29. © 2009 The American Physical Society, and Reference Reference Liu, Sun, Sun and Ai83. © 2012 Elsevier.

To achieve droplet jumping, surface structures need to be designed with minimal droplet adhesion by using nanoscale structures with low solid fractions (φ < 0.1), or hierarchical structuresReference Nosonovsky and Bhushan77–Reference Pokroy, Kang, Mahadevan and Aizenberg81 (consisting of a dual length scale roughness of micro- and nanostructure). Extending the work of Boreyko, many researchers have modeledReference Miljkovic, Enright and Wang76,Reference Liu, Sun, Sun and Ai82–Reference Miljkovic, Enright and Wang84 and fabricatedReference Chen, Cai, Tsai, Chen, Xiong, Yu and Ren50,Reference Chen, Wu, Ma, Hua, Koratkar, Yao and Wang52,Reference Feng, Pang, Qin, Ma and Yao85–Reference Rykaczewski, Scott, Rajauria, Chinn, Chinn and Jones89 surfaces that show stable droplet jumping. However, if the supersaturation is too large (high nucleation density), flooding occurs, and droplets are formed that strongly adhere to the surface.Reference Miljkovic, Enright, Nam, Lopez, Dou, Sack and Wang47,Reference Enright, Miljkovic, Al-Obeidi, Thompson and Wang55 These nucleation density limitations still remain and need to be addressed to further increase the operating range of superhydrophobic surfaces. Furthermore, heat transfer measurements are required to better quantify the condensation enhancement when compared to state-of-the-art dropwise condensing surfaces.
Condensation heat transfer performance on superhydrophobic surfaces
Modeling of enhanced superhydrophobic surfaces
As shown by previous studies, condensation heat transfer performance on superhydrophobic surfaces is dependent on many factors, including droplet morphology, structure geometry, and departure dynamics. To obtain design guidelines for enhanced condensation heat transfer with superhydrophobic structured surfaces, Miljkovic et al.Reference Miljkovic, Enright and Wang84 developed a unified model coupling individual droplet heat transfer, droplet size distribution, and droplet wetting morphology. The emergent droplet wetting morphologies, PW and S jumping, PW and S non-jumping, or W, were determined by coupling the structure geometry with the nucleation density and considering local energy barriers to wetting. The model results suggest that a specific range of geometries (0.5–2 μm) and nucleation densities allow for the formation of coalescence-induced PW jumping droplets with a promise of 190% overall surface heat flux enhancement over conventional flat dropwise condensing surfaces.Reference Miljkovic, Enright and Wang84
Fabrication of scalable nanostructures
While a considerable amount of work has focused on understanding and fabricating superhydrophobic surfaces for potential enhancements in condensation,Reference Boreyko and Chen29,Reference Chen, Wu, Ma, Hua, Koratkar, Yao and Wang52,Reference Rykaczewski, Osborn, Chinn, Walker, Scott, Jones, Hao, Yaod and Wang54,Reference Miljkovic, Enright and Wang67,Reference Rykaczewski68,Reference Narhe, Khandkar, Shelke, Limaye and Beysens74,Reference Dietz, Rykaczewski, Fedorov and Joshi75,Reference Enright, Dou, Miljkovic, Nam and Wang86–Reference Rykaczewski, Paxson, Anand, Chen, Wang and Varanasi90 heat transfer measurements that quantify the improvement in performance using these surfaces are limited. In addition, many studies have used well-defined structures to facilitate our understanding of the condensation process (carbon nanotubes,Reference Lau, Bico, Teo, Chhowalla, Amaratunga, Milne, McKinley and Gleason53 nanowires,Reference Rykaczewski, Osborn, Chinn, Walker, Scott, Jones, Hao, Yaod and Wang54 nanoparticle self-assembly,Reference Rykaczewski, Chinn, Walker, Scott, Chinn and Jones91 micropillarsReference Enright, Miljkovic, Al-Obeidi, Thompson and Wang55,Reference Varanasi, Hsu, Bhate, Yang and Deng58 ); however, it is also important to pursue scalable methods of fabricating superhydrophobic surfaces for the implementation in large-scale thermal applications.
Recently, researchers have proposed metal oxides to fabricate more scalable superhydrophobic nanostructured surfaces.Reference Miljkovic, Enright, Nam, Lopez, Dou, Sack and Wang47,Reference Feng, Pang, Qin, Ma and Yao85,Reference Enright, Dou, Miljkovic, Nam and Wang86,Reference Narhe, Gonzalez-Vinas and Beysens92–Reference He, Zhou, Zeng, Cui, Zhang, Chen, Li, Wang, Cao, Song and Jiang97 The nanoscale oxide can (1) better satisfy the requirement for the structure density to be larger than the nucleation density in order to avoid flooding,Reference Enright, Miljkovic, Al-Obeidi, Thompson and Wang55 and (2) reduce the structure length scale beneath the droplet in order to minimize the structure thermal resistance.Reference Miljkovic, Enright and Wang67
The works of Miljkovic et al.Reference Miljkovic, Enright, Nam, Lopez, Dou, Sack and Wang47 (Figure 6a–c), Feng et al.,Reference Feng, Pang, Qin, Ma and Yao85,Reference Feng, Qin and Yao94 and Torresin et al.Reference Torresin, Tiwari, Del Col and Poulikakos93 (Figure 6d–f) studied scalable functionalized copper oxide (CuO) nanostructured surfaces. Copper is a typical heat exchanger material where chemical-oxidation based CuO nanostructuring allows for self-limiting growth behavior, resulting in a low characteristic oxide structure height (h ≈ 1 μm) and a low parasitic conduction thermal resistance.Reference Nam, Sharratt, Byon, Kim and Ju98,Reference Nam and Sungtaek99 From an industrial perspective, the CuO fabrication method is appealing because it can be applied to arbitrarily shaped surfaces, where the nanostructures form at low temperatures and do not require any high temperature annealing or drying processes. While zinc oxide (ZnO) has also been proposed where Narhe et al.Reference Narhe, Gonzalez-Vinas and Beysens92 showed that the ZnO nanostructures had a favorable morphology (Figure 6g–i), researchers were not able to achieve droplet jumping due to incomplete hydrophobic coating coverage, relatively large solid fractions φ ≈ 0.11, and subsequently larger droplet adhesion to the surface. Furthermore, in addition to copper and zinc oxides, opportunities remain to create scalable nanostructured superhydrophobic surfaces with aluminum and stainless steel, which are commonly used industrial heat exchanger materials.Reference Rose30
Fabricated scalable nanostructured surfaces. Field emission scanning electron microscopy images of a CuO nanostructured surface with (a) top view, (b) side view, and (c) micro-goniometer contact angle measurement after hydrophobic functionalization (θA = 169.2 ± 2.6°). Nanostructured CuO was formed by immersing the cleaned copper into a hot (96 ± 3°C) alkaline solution composed of NaClO2, NaOH, Na3PO4·12H2O, and DI water (3.75:5:10:100 wt%). The sharp, knife-like CuO structures have characteristic heights, h ≈ 1 μm, solid fraction, φ ≈ 0.023, and roughness factor, r ≈ 10.Reference Miljkovic, Enright, Nam, Lopez, Dou, Sack and Wang47 (d, e) Scanning electron microscopy (SEM) images of the copper surface structures fabricated via wet chemistry by immersing clean copper into a mixture solution containing 2.5 mol/L NaOH and 0.1 mol/L (NH4)2S2O8 at room temperature for 12 min.Reference Torresin, Tiwari, Del Col and Poulikakos93 (f) Contact angle measurement on functionalized nanostructured copper surface (5 μL droplet, θA = 159 ± 2°).Reference Torresin, Tiwari, Del Col and Poulikakos93 (g) SEM images of a nanostructured zinc surface showing a micro-flower-like structure (size, a ≈ 12 µm; separation, b ≈ 25 µm; height c ≈ 10 µm).Reference Narhe, Gonzalez-Vinas and Beysens92 Nanostructured zinc was formed by immersing the zinc substrate in 2 mol/L urea solution prepared with deionized water and N-N-dimethylformamide in 2:1 volume ratio, in a sealed bottle and kept at 80°C for 20–24 hours. (h) The micro-flower area inside the circle in (g) at large magnification. It shows nano-sheets with an average thickness of 300 nm.Reference Narhe, Gonzalez-Vinas and Beysens92 (i) Contact angle measurement of a 3 µl water droplet on the ZnO surface. All three scalable surfaces showed high degrees of superhydrophobicity (c, f, and i), promising potential for enhanced condensation heat transfer performance. Reprinted with permission from References Reference Miljkovic, Enright, Nam, Lopez, Dou, Sack and Wang47 and Reference Torresin, Tiwari, Del Col and Poulikakos93. © 2013 American Chemical Society, and Reference Reference Narhe, Gonzalez-Vinas and Beysens92. © 2010 Elsevier.

Heat transfer experiments
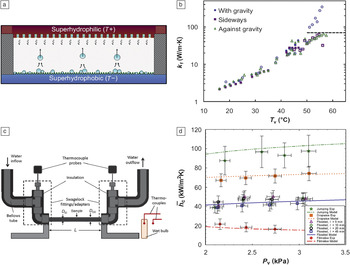
An important metric for optimized superhydrophobic surfaces for condensation is experimental heat transfer measurements, however, it is well-known that accurate results are difficult to obtain. Due to the high sensitivity to the presence of NCGs, experiments need to be performed in controlled environments to ensure NCG content of <0.25%.Reference Rose30,Reference Rose100 In addition, the thermal contact resistance (i.e., the resistance to heat flow at the interface between two bodies in contact) between the sample substrate and test rig have led to a lack of repeatability in heat transfer measurements. Recently, a few studies have conducted experimental investigations in pure vapor environments (no NCGs).Reference Miljkovic, Enright, Nam, Lopez, Dou, Sack and Wang47,Reference Torresin, Tiwari, Del Col and Poulikakos93,Reference Boreyko, Zhao and Chen101–Reference Boreyko and Chen103 The first performance measurement was achieved by Boreyko et al.Reference Boreyko, Zhao and Chen101 via the characterization of a jumping droplet thermal diode (Figure 7a), which allowed heat to preferentially flow in one direction compared to the other. Although indirect (condensation and evaporation performance were lumped together), the results showed forward effective thermal conductivities of 350 W/mK (Figure 7b), while the reverse thermal conductivity was estimated to be 0.29 W/mK, indicating that the jumping droplet mechanism enhanced heat transfer.
Experimental heat transfer results. (a) Schematic of the planar jumping-droplet thermal diode (not to scale) in forward mode with jumping droplets returning the working fluid from the low temperature (T-) superhydrophobic condenser to the high temperature (T+) superhydrophilic evaporator for continuous phase-change heat transfer.Reference Boreyko, Zhao and Chen101 (b) Forward thermal conductivity (k f) versus the average vapor temperature of the thermal diode (T v). For all three orientations tested (sideways, with gravity, and against gravity), the thermal diode performance was the same, highlighting the advantageous orientation independence of condensers having jumping droplet departure.Reference Boreyko, Zhao and Chen101 At higher vapor temperatures (T v > 50°C), boiling in the evaporator was initiated, resulting in orientation dependence (dotted line). (c) Schematic showing setup for condensation experiments. The tube sample (D OD = outer diameter = 6.35 mm, D ID = inner diameter = 3.56 mm, L = length = 131 mm) was cooled via chilled water flowing inside the tube at 5 ± 0.1 L/min.Reference Miljkovic, Enright, Nam, Lopez, Dou, Sack and Wang47 (d) Experimental and theoretical steady-state condensation coefficient ( c) as a function of saturated vapor pressure (P v) for tube surfaces shown in (c) undergoing filmwise, dropwise, flooding (four different chemical oxidation times, t = 5, 10, 20, and 45 min), and jumping (t = 10 min) condensation.Reference Miljkovic, Enright, Nam, Lopez, Dou, Sack and Wang47 Jumping condensation shows the highest condensation heat transfer coefficient for low supersaturations (S < 1.12).Reference Miljkovic, Enright, Nam, Lopez, Dou, Sack and Wang47 Adapted with permission from Reference Reference Boreyko, Zhao and Chen101. © 2012 American Institute of Physics, and Reference Reference Miljkovic, Enright, Nam, Lopez, Dou, Sack and Wang47. © 2013 American Chemical Society.

To specifically quantify condensation heat transfer performance, Miljkovic et al.Reference Miljkovic, Enright, Nam, Lopez, Dou, Sack and Wang47 tested superhydrophobic nanostructured CuO tube surfaces (Figure 7c) over a range of supersaturations (1.02 < S < 1.6). They demonstrated (Figure 7d) that in the jumping regime, where S < 1.12, heat transfer coefficients were  jumping ≈ 92 kW/m2K (green ★), 30% higher than that of state-of-the-art dropwise condensing copper surfaces (orange ■). However, at S > 1.12, flooding degraded performance to
 flooded ≈ 44 kW/m2K (blue □), 41% less than that of copper. Other studies have also observed flooding on two-tier superhydrophobic carbon nanotubeReference Boreyko, Zhao and Chen101 and nanostructured CuOReference Torresin, Tiwari, Del Col and Poulikakos93 surfaces, due to high nucleation densities compared to the structure density (Figure 3f), consequently underperforming compared to dropwise condensation.
Although the results show potential for efficient droplet jumping heat transfer enhancement, the flooding observed by many researchers suggests the need to further reduce the structure length scale and/or reduce and control the nucleation density at elevated supersaturations.
Summary and future outlook
Superhydrophobic surfaces for enhanced condensation require the careful control of surface structure length scale and geometry, nucleation density, droplet morphology, and departure dynamics. Currently, metal oxides are one of the most promising materials to create these superhydrophobic surfaces in a scalable manner due to their ability to form partially wetting droplets, their relatively large thermal conductivities, reduced structure length scales, and low droplet adhesion for stable droplet jumping. In addition, jumping condensation has the potential to enhance heat transfer in the presence of non-condensable gasesReference Ma, Zhou, Lan, Li and Zhang104–Reference Thiel and Lienhard106 via boundary layer mixing, in addition to the 30% enhancement already observed in pure vapor environments. However, these surfaces remain limited due to flooding for applications with low supersaturations. In the future, control of nucleation density through the creation of coatings and using deposition methods for the inclusion of well-defined defects at the molecular scale and minimization of the structure length scale are promising pathways to extend the operating limits. Furthermore, significant efforts should be expended on creating robust hydrophobic coatings at high temperatures. As in classical dropwise condensation, the degradation of the hydrophobic coating poses significant challenges for industrial implementation. One idea showing promise is the study and formation of naturally occurring hydrophobic materials, such as ceramics.Reference Barshilia, Chaudhary, Kumar and Manikandanath107,Reference Azimi, Dhiman, Kwon, Paxson and Varanasi108
A second avenue for future research is with structured surfaces infused with a lubricating fluid (i.e., slippery liquid-infused porous surface [SLIPS], to reduce droplet adhesion) (see the Introductory article in this issue).Reference Lafuma and Quéré109,Reference Wong, Kang, Tang, Smythe, Hatton, Grinthal and Aizenberg110 SLIPS provides an alternative approach for further performance enhancement at larger supersaturations,Reference Anand, Paxson, Dhiman, Smith and Varanasi111 eliminating flooding of the surface structure while maintaining low droplet adhesion.Reference Kim, Wong, Alvarenga, Kreder, Adorno-Martinez and Aizenberg112–Reference Smith, Dhiman, Anand, Reza-Garduno, Cohen, McKinley and Varanasi115 In addition, the ability of these surfaces to be omniphobicReference Tuteja, Choi, McKinley, Cohen and Rubner116–Reference Liu, Liang, Zhou and Liu119 or superamphiphobic allows for their potential use in applications involving low surface tension nonpolar fluids such as refrigerants, where superhydrophobic surfaces can no longer achieve non-wetting behavior. Although promising, further studies into the robustness of SLIPS under industrial conditions, as well as their longevity, are needed in addition to experimental demonstration of heat transfer performance. While limitations exist, progress in the area of superhydrophobic surfaces for enhanced heat transfer has been considerable, deepening our fundamental knowledge, introducing new scalable fabrication techniques, and setting new benchmarks for heat transfer performance. Further advances in creating and tailoring robust nanostructures and hydrophobic coatings promise to one day make superhydrophobic surfaces the material of choice for high heat flux condensation applications.
Acknowledgments
We gratefully acknowledge funding support from the MIT S3TEC Center, an Energy Frontier Research Center funded by the Department of Energy, Office of Science, Office of Basic Energy Sciences, Office of Naval Research Young Investigator Award, and Air Force Office of Scientific Research Young Investigator Award.