CHD represents around 0.8% of all live births in developed countries. Reference Ferrer-Sargues, Peiro-Molina and Salvador-Coloma1 As a result of improving surgical techniques, post-operative care, and medical therapy, over 80% now survive to adulthood. Reference Wren and O’Sullivan2 Unfortunately, these patients still may have a greater degree of morbidity and exercise limitation than their healthy counterparts. Reference Engelfriet, Boersma and Oechslin3 They may also have a distorted perception of their functional limitation and can struggle to recognise further deterioration as a result of long-term adaptation to reduced physical activity. Reference Engelfriet, Boersma and Oechslin3–Reference Gratz, Hess and Hager5
Physicians caring for patients with CHD are often faced with the dilemma of trying to predict untoward events in patients who remain clinically well despite deteriorating imaging results, or conversely, trying to explain worsening symptoms despite stable investigation results. Cardiopulmonary exercise testing enables physicians to objectively assess and monitor cardiopulmonary function and has been used for risk stratification to aid decision-making in a non-invasive, reproducible manner since the 1930s. Reference Hallock6 It has also been demonstrated that in patients with CHD, lower exercise capacity is associated with a worse prognosis. Reference Fernandes, Alexander and Graham7,Reference Inuzuka, Diller and Borgia8 Maximal oxygen uptake, defined as the point at which oxygen uptake plateaus despite increasing workload is a well-validated measure of cardiorespiratory function, Reference Taylor, Buskirk and Henschel9 and in various patient groups predicts prognosis as an aid to decision-making. Reference Mancini, Eisen, Kussmaul, Mull, Edmunds and Wilson10 A true plateau however is difficult to achieve, is effort dependant, and may be influenced by patient motivation and by the team performing the test. Reference Baba, Nagashima and Goto11 There is variation in achievement by lesion as evidenced by the study from Buys et al where an RER of > 1.10 (indicative of a maximal test) Reference American Thoracic12 was achieved in 78.7% of patients with coarctation, and around 60% in those with tetralogy of Fallot, transposition of the great arteries, and univentricular heart. Reference Buys, Cornelissen and Van De Bruaene13 The inability to achieve a maximal exercise test is a significant issue in patients with CHD, and as such, there is a need for a reliable predictor of cardiorespiratory reserve that can be achieved using a submaximal test.
Several submaximal indices to predict maximal oxygen uptake have been investigated but are associated with various limitations. Ventilatory anaerobic threshold is not always identifiable and is subject to interobserver and intraobserver variability. Reference Yeh, Gardner, Adams, Yanowitz and Crapo14,Reference Shimizu, Myers and Buchanan15 The regression line showing the relationship between minute ventilation and carbon dioxide production has been demonstrated to be inversely correlated with the maximal oxygen uptake; however, the correlation is weak (r = −0.56). Reference Metra, Dei Cas, Panina and Visioli16 Buller et al proposed an additional method to predict cardiorespiratory functional reserve independent of exercise duration using a quadratic function of the carbon dioxide production and oxygen uptake termed the extrapolated maximal oxygen consumption; Reference Buller and Poole-Wilson17 however, this has not been validated by other investigators and so remains of limited clinical validity.
In 1996, Baba et al described the oxygen uptake efficiency slope as a novel method of estimating cardiorespiratory functional reserve from a submaximal exercise test and demonstrated a strong positive correlation between the oxygen uptake efficiency slope and the maximal oxygen uptake in a group of young patients. Reference Baba, Nagashima and Goto11
The oxygen uptake efficiency slope is the slope of the regression line of the oxygen uptake on a logarithmically adjusted minute ventilation as measured during incremental exercise. Reference Uchida18 It represents a measure of how effectively oxygen is extracted from the lungs and taken into the body. Oxygen uptake efficiency slope is represented as a slope whereby a steeper gradient represents a greater uptake in oxygen for any given increase in ventilation which is indicative of a more efficient cardiorespiratory system (Fig. 1). Put simply, oxygen uptake efficiency slope is the absolute increase in oxygen uptake associated with a 10-fold increase in ventilation. The benefit of the oxygen uptake efficiency slope over other submaximal indices may be that the slope incorporates cardiovascular, musculoskeletal, and respiratory function into a single measure as physiologically it is based on both the development of metabolic acidosis and lung perfusion. Reference Baba, Nagashima and Goto11,Reference Mezzani, Agostoni and Cohen-Solal19 The oxygen uptake efficiency slope is best described by a single exponential function:
 $$ V0_{2}=alog_{10}\left(V_{E}/V_{E rest}\right)+V0_{2rest}$$
Relationship between the oxygen uptake and the minute ventilation during a cardiopulmonary exercise test in a healthy 27-year-old woman, and in sex and age-matched patients with transposition of the great arteries and Fontan circulation. The values of the oxygen uptake efficiency slope are 2.49, 1.50, and 0.96, respectively, and the data are presented as linear (top graph) and semi-log plots of the x-axis (bottom graph). TGA: transposition of the great arteries, VE: minute ventilation, VO2; oxygen uptake.

The reliability of the oxygen uptake efficiency slope as a predictor of cardiorespiratory reserve in submaximal exercise tests has been validated in healthy adults, Reference Mollard, Woorons and Antoine-Jonville20,Reference Hollenberg and Tager21 children with CHD, Reference Baba, Nagashima and Goto11,Reference Bongers, Hulzebos, Blank, van Brussel and Takken22 and a variety of adult cardiac patients including those with heart failure, Reference Toste, Soares and Feliciano23,Reference Woods, Bailey, Wood and Johnson24 coronary artery disease, Reference Coeckelberghs, Buys, Goetschalckx, Cornelissen and Vanhees25 and pulmonary hypertension. Reference Woods, Frantz, Taylor, Olson and Johnson26–Reference Tan, Yang and Guo28 To date, there is limited and equivocal evidence for the role of the oxygen uptake efficiency slope as a submaximal predictor of exercise capacity in adult patients with CHD. Reference Buys, Cornelissen and Van De Bruaene13,Reference Giardini, Specchia, Gargiulo, Sangiorgi and Picchio29 Giardini et al in 2008 demonstrated good correlation of the with the last 50% of the entire exercise duration (oxygen uptake efficiency slope 50–100) and maximal oxygen uptake in a group of Fontan (n = 23) and Mustard/Senning patients (n = 30). In the Fontan group, the oxygen uptake efficiency slope 50 (first 50% of the test) differed significantly from the oxygen uptake efficiency slope 50–100, with the difference appearing most marked in the cyanotic Fontan group. Reference Giardini, Specchia, Gargiulo, Sangiorgi and Picchio29 Buys et al published a larger study including patients with tetralogy of Fallot, aortic coarctation, univentricular heart and transposition of the great arteries and reported good correlation between oxygen uptake efficiency slope and oxygen uptake efficiency slope 75 (where data points from only the first 75% of the exercise test were analysed) in the aortic coarctation group, but poor correlation in all other patient groups. Reference Buys, Cornelissen and Van De Bruaene13 Previously, there has been discrepancy about the decimalisation of the y-intercept and the unit of oxygen uptake efficiency slope. We suggest calculating oxygen uptake efficiency slope using oxygen uptake expressed in litres/minute and that the oxygen uptake efficiency slope itself is unitless. Reference Uchida18
This study seeks to assess the validity of the oxygen uptake efficiency slope as a submaximal predictor of maximal oxygen uptake in patients with all the major adult CHD diagnosis groups and establish a reproducible method by which it can be calculated and thus be used as the standard industry-wide method. Additionally, we will evaluate the correlation between oxygen uptake efficiency slope at ventilatory anaerobic threshold and maximal oxygen uptake to add more direct clinical application of the oxygen uptake efficiency slope in this group of patients.
Methods
Participants
As part of a service development project to establish a departmental standard, we retrospectively analysed the exercise date of all patients with CHD referred for routine cardiopulmonary exercise testing in the Department of Pulmonary Function, Liverpool Heart, and Chest Hospital between 2019-2020. CHD diagnoses were split into 11 subgroups as defined by Kempny et al, 2012. Reference Kempny, Dimopoulos and Uebing30 Ethics approval for this project as a service development project was based on retrospective analysis of data acquired in routine care.
Anthropometric
Anthropometric measurements were taken in all participants including body mass (kg) and height (m) using electronic scales and a stadiometer (Seca GmbH & CO, Germany). Body mass index and body surface area were calculated.
Spirometry
All patients performed resting spirometry in accordance with American Thoracic Society guidelines for acceptability and repeatability. Reference Graham, Steenbruggen and Miller31 Measurements of forced vital capacity, forced expiratory volumes in 1 s, and the forced expiratory volumes in 1 s / forced vital capacity ratio were calculated. Predicted values for spirometry used were derived from the Global Lung Index 2012. Reference Quanjer, Stanojevic and Cole32
Cardiopulmonary exercise testing procedure
Patients were familiarised with equipment and protocol. Prior to each test, equipment was calibrated as per manufacturer’s guidelines using 3L reference syringe for volume calibration and a two-point calibration of gases. All patients performed cardiopulmonary exercise testing using an electronically braked cycle ergometer (Ergoselect 100, ergoline GmbH, Germany). Cardiopulmonary exercise test followed standardised protocol Reference American Thoracic12 consisting of 3 minutes of rest, 3 minutes unloaded cycling at 60 rpm, followed by incremental uniformed increase in load 5–30 W/min, load calculated using Wasserman formula Reference Wasserman33 with the aim of eliciting maximum performance in 8–12 minutes of exercise. During cardiopulmonary exercise testing, patients were required to maintain revolutions of 60–80 r.p.m. and were given verbal encouragement throughout. The test ceased when patients achieved volitional exhaustion and were either unable to maintain the required cadence or all the identifiers of a maximal exercise test were present (respiratory exchange ratio > 1.10, heart rate > 90% age-predicted maximum and a sustained plateau of oxygen uptake was achieved). As a maximal test was required to develop a correlation, tests whereby the respiratory exchange ratio did not meet the threshold for maximal exercise were excluded from this study (respiratory exchange ratio < 1.10), n = 7.
Standard 12 lead electrocardiograms (AMEDTEC Medizintechnik GmbH, Germany) and pulse oximetry were continuously monitored throughout cardiopulmonary exercise testing. Blood pressure (automatic cuff) was recorded regularly throughout exercise, at peak and into recovery for assessment of haemodynamic recovery. Carbon dioxide (carbon dioxide production ml/min), oxygen uptake (ml/min), minute ventilation (L/min), and respiratory rate were measured continuously via breath-by-breath gas analysis. Patients breathed through a face mask (Hans Rudolph, Kansas City, MO) connected to a metabolic cart system (Geratherm GmbH, Germany). Expired gas was passed through a flowmeter and rapidly responding oxygen and carbon dioxide analysers connected to a computer, and derived variables such as respiratory exchange rate, oxygen uptake/heart rate, and ventilatory equivalents (minute ventilation/carbon dioxide production, minute ventilation/oxygen uptake) were obtained throughout. Maximal oxygen uptake was determined as the highest 30 s average of oxygen uptake. Remaining peak parameters were calculated during this time period. Ventilatory anaerobic threshold was calculated by the V-slope method, and minute ventilation/carbon dioxide production was determined at ventilatory anaerobic threshold. Reference American Thoracic12 Cardiopulmonary exercise testing resting, predicted and peak data were recorded against known predicted equations Reference Hansen, Sue and Wasserman34 and reported into electronic patient record (Allscripts, Chicago, IL), whereby additional calculations of breathing reserve (forced expiratory volumes in 1 s x40 – peak minute ventilation), ventilatory anaerobic threshold as a percentage of achieved and predicted workload were calculated. Reference Graham, Steenbruggen and Miller31,Reference Hansen, Sue and Wasserman34
Oxygen uptake efficiency slope calculation
Oxygen uptake efficiency slope is best expressed by the following exponential function:
 $$ V0_{2}=alog_{10}\left(V_{E}/V_{E rest}\right)+V0_{2rest} $$
Semi-log transformation of the X-axis demonstrates a linear relationship between oxygen consumption and minute ventilation whereby the steeper slope represents improved oxygen uptake with exercise (Fig. 1).
To evaluate its usefulness in the CHD population, oxygen uptake efficiency slope was calculated using breath-by-breath data (including the last minute of resting data, having allowed for a mask familiarisation period). To further assess its utility as an index derived from submaximal cardiopulmonary exercise testing, the oxygen uptake efficiency slope was also calculated from data collected during the first 75 and 90% of exercise duration and correlated against maximal oxygen uptake(L/min). This was achieved by removing all data points beyond 75 and 90% of the total exercise time, respectively, and recalculating the oxygen uptake efficiency slope based on the remaining data. Ventilatory anaerobic threshold was calculated using the V-slope method and then used to calculate oxygen uptake efficiency slope at ventilatory anaerobic threshold by removing all subsequent data points and recalculating the oxygen uptake efficiency slope.
Statistical analysis
The relationships between oxygen uptake efficiency slope from the first 75% of the test, the oxygen uptake efficiency slope from the first 90% of the test, the oxygen uptake efficiency slope from the entire test, and the oxygen uptake efficiency slope at ventilatory anaerobic threshold with each of maximal oxygen uptake, oxygen uptake at lactate threshold, and ventilatory equivalents for carbon dioxide at lactate threshold and slope were investigated using either Pearson’s product–moment correlation coefficient or Spearman’s rho correlation coefficient. These tests were performed for the whole patient cohort and the subset patient cohorts of tetralogy of Fallot, valvular, transposition of the great arteries and Fontan. Preliminary analyses were performed to ensure no violation of the assumptions of linearity, homoscedasticity and normality. Partial correlation coefficients were used to explore the relationships as above while controlling for body surface area. Differences between the groups were investigated using Student’s t-test or Mann–Whitney U tests after checking for normality. All analyses were done using IBM SPSS Statistics v23.
Results
Patients
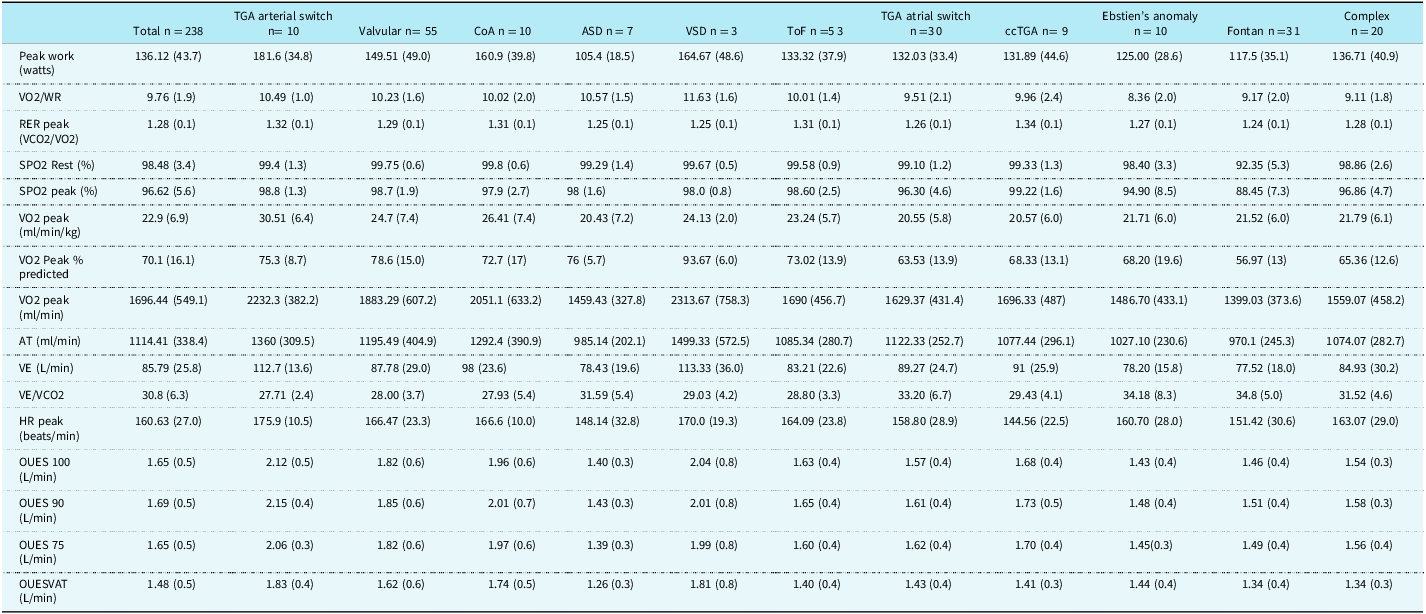
We analysed the results of 238 consecutive patients (age 33.5 ± 11.7, 44% female) who completed a maximal cardiopulmonary exercise test. The cohort included 10 distinct anatomical groups of patients plus a further mixed group of complex anatomy that included Eisenmenger’s, anomalous pulmonary venous drainage, truncus, and atrioventricular septal defects. Anthropometric data are summarised in Table 1.
Characteristics of study participants.

Exercise test characteristics
All patients achieved a maximal test (respiratory exchange ratio > 1.10 and HR > 90% age-predicted maximum). The results are shown in Table 2. Four minor adverse events were recorded. Three patients experienced vasovagal syncope on completion of the test, and another was admitted overnight for treatment of sustained atrial arrhythmia developed post-test.
Exercise test characteristics.

Relationship of maximal oxygen uptake with oxygen uptake efficiency slope and minute ventilation/carbon dioxide production
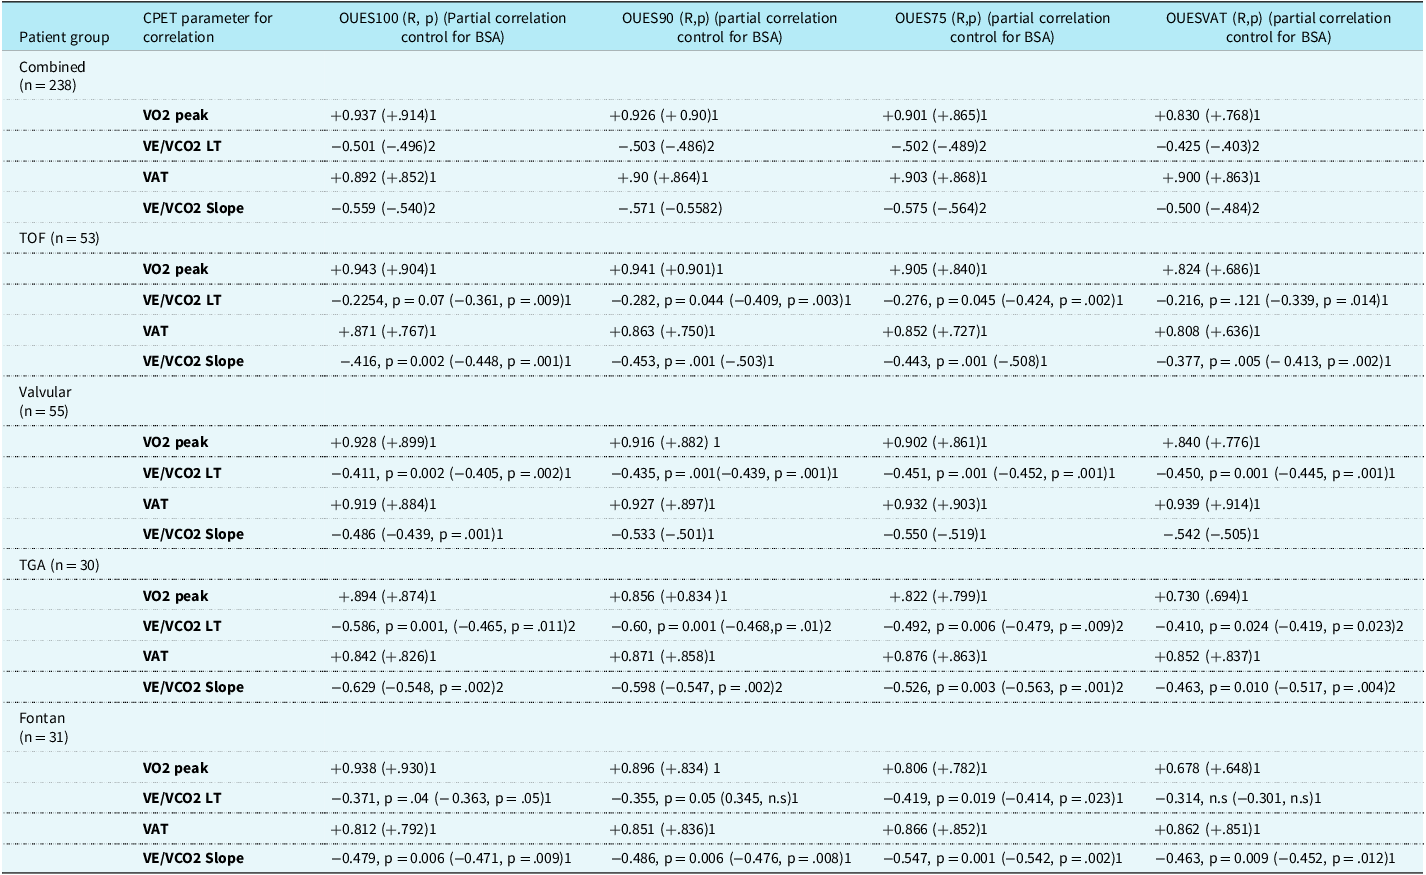
In total, 238 patient tests were included in the full patient cohort and n = 53,55,30,31, respectively, for the tetralogy of Fallot, valvular, transposition of the great arteries and Fontan sub-patient groups. There was a strong positive correlation between maximal oxygen uptake and each of oxygen uptake efficiency slope from the first 75% of the test, the oxygen uptake efficiency slope from the first 90% of the test, the oxygen uptake efficiency slope from the entire test, and the oxygen uptake efficiency slope at ventilatory anaerobic threshold for all patient groups as shown in Table 3 and Figure 2. The only exception was a moderate correlation between maximal oxygen uptake and oxygen uptake efficiency slope at ventilatory anaerobic threshold in the Fontan patient subgroup (+0.678). Higher maximal oxygen uptakes were associated with high levels of oxygen uptake efficiency slope from the first 75% of the test, the oxygen uptake efficiency slope from the first 90% of the test, the oxygen uptake efficiency slope from the entire test, and the oxygen uptake efficiency slope at ventilatory anaerobic threshold for the total patient cohort (Fig. 3). The maximum Pearson correlation was the oxygen uptake efficiency slope from the entire test of + 0.943 for the tetralogy of Fallot cohort and the lowest + 0.678 in the Fontan group, oxygen uptake efficiency slope at ventilatory anaerobic threshold. The partial correlation used to explore the relationship between maximal oxygen uptake and each of oxygen uptake efficiency slope from the first 75% of the test, the oxygen uptake efficiency slope from the first 90% of the test, the oxygen uptake efficiency slope from the entire test, and the oxygen uptake efficiency slope at ventilatory anaerobic threshold when controlling for body surface area was lower in each case but retained the strong positive correlations for the total cohort and each of the patient subgroups (Fig. 4). This was supported when the analyses were repeated using Bongers’ method which divided the variables by body surface area rather than using the partial correlation method to examine the covariate. Reference Bongers, Hulzebos, Blank, van Brussel and Takken22
Relationships between cardiopulmonary exercise testing and oxygen uptake efficiency slope variables for the combined and separate patient cohorts.

CPET = cardiopulmonary exercise testing; OUES100 = oxygen uptake efficiency slope from the entire test; OUES90 = oxygen uptake efficiency slope from 90% of the test; OUES75 = oxygen uptake efficiency slope from 75% of the test; OUESVAT = oxygen uptake efficiency slope at ventilatory anaerobic threshold; BSA = body surface area; TOF = tetralogy of Fallot; TGA = transposition of the great arteries; V02 peak = maximum oxygen uptake; VE = minute ventilation; C02 = carbon dioxide production; LT = lactate threshold; VAT = ventilatory anaerobic threshold.
The partial correlation control for body surface area is shown in brackets after each association.
The coefficients of correlation are shown for each comparison.
1 Pearson’s correlation coefficient or
2 Spearman’s Rho coefficient, p < 0.0005 unless otherwise stated.
For comparison with the above, the analyses were repeated to compare the oxygen uptake efficiency slope variables with each of the cardiopulmonary exercise testing variables, ventilatory anaerobic threshold, and minute ventilation/carbon dioxide production (both slope and at anaerobic threshold) in all the patient groups. Similar to the above, there was a strong positive correlation with ventilatory anaerobic threshold and each of oxygen uptake efficiency slope from the first 75% of the test, the oxygen uptake efficiency slope from the first 90% of the test, the oxygen uptake efficiency slope from the entire test, and the oxygen uptake efficiency slope at ventilatory anaerobic threshold in all groups albeit lower coefficients than when comparing with maximal oxygen uptake. Controlling for body surface area had little effect on the strength of the relationship with ventilatory anaerobic threshold in the groups, it caused slightly more of a reduction in the coefficients in the tetralogy of Fallot group than the others. When comparing minute ventilation/carbon dioxide production at anaerobic threshold and the oxygen uptake efficiency slope variables the correlation was a weak, negative association being 0.501,0.503,0.502,0.425, respectively, for oxygen uptake efficiency slope from the first 75% of the test, the oxygen uptake efficiency slope from the first 90% of the test, the oxygen uptake efficiency slope from the entire test, and the oxygen uptake efficiency slope at ventilatory anaerobic threshold in the total patient cohort, which was improved slightly when replaced with minute ventilation/carbon dioxide production slope and with a similar effect of the covariate body surface area (Table 3). The subgroups showed a similar pattern with the latter.
In the total patient cohort, there were no significant differences between the means of any one of the variables, oxygen uptake efficiency slope from the first 75% of the test, the oxygen uptake efficiency slope from the first 90% of the test, the oxygen uptake efficiency slope from the entire test, and the oxygen uptake efficiency slope at ventilatory anaerobic threshold and the other two (Student’s t-test).
Discussion
The aim of our study was to investigate the reliability of the oxygen uptake efficiency slope as a submaximal marker of cardiorespiratory reserve in adult patients with CHD and build upon the existing evidence. In this retrospective assessment of all adult congenital patients who achieved a maximal exercise test at a single tertiary cardiology centre, there was a strong correlation between the maximum oxygen uptake and the oxygen uptake efficiency slope from the entire test (0.936), the oxygen uptake efficiency slope from the first 90% of the test (0.927), and the oxygen uptake efficiency slope from the first 75% of the test (0.905). Importantly, as it can be calculated from a submaximal test, there was also a strong correlation between the maximum oxygen uptake and the oxygen uptake efficiency slope at ventilatory anaerobic threshold (0.833). In our cohort, the mean percentage of oxygen uptake at which anaerobic threshold was reached was 68%. No significant difference was seen in the oxygen uptake efficiency slope at these four different exercise durations. Analysis of the larger subgroups, namely patients with tetralogy of Fallot, transposition of the great arteries, valvular abnormalities, and those with Fontan circulations demonstrated similarly strong correlation of the maximum oxygen uptake with the oxygen uptake efficiency slope from the first 75% of the test, the oxygen uptake efficiency slope from the first 90% of the test, the oxygen uptake efficiency slope from the entire test, and the oxygen uptake efficiency slope at ventilatory anaerobic threshold other than the slightly weaker correlation between the maximum oxygen uptake and the oxygen uptake efficiency slope at ventilatory anaerobic threshold in the Fontan circulation subgroup.
A greater correlation was demonstrated between the maximum oxygen uptake and the oxygen uptake efficiency slope than that of the maximum oxygen uptake with either ventilatory anaerobic threshold (0.875) or minute ventilation/carbon dioxide production slope (0.524). These findings are consistent with those of previous studies. Baba demonstrated the strongest correlation between the maximum oxygen uptake and the oxygen uptake efficiency slope (0.941), with weaker correlations comparable to our own seen with ventilatory anaerobic threshold (0.861) and the minute ventilation/carbon dioxide production slope (−0.452)(11). Buys et al also demonstrated a strong correlation between the maximum oxygen uptake and the oxygen uptake efficiency slope (0.853), with weaker correlations of the maximum oxygen uptake with ventilatory anaerobic threshold (0.840) and the minute ventilation/carbon dioxide production slope (−0.421). Reference Buys, Cornelissen and Van De Bruaene13
In addition to the strong correlation between the oxygen uptake efficiency slope and the maximum oxygen uptake, the oxygen uptake efficiency slope also showed an association with ventilatory anaerobic threshold (0.893) and a moderate association with the minute ventilation/carbon dioxide production slope (0.511) which further validates the results.
The explanation for the superior correlation of the oxygen uptake efficiency slope with the maximum oxygen uptake may be related to the underlying physiology on which it is based. According to the modified alveolar gas equation, the carbon dioxide set-point, metabolic carbon dioxide production, and the ratio of the pulmonary dead space to tidal volume all affect the relationship between minute ventilation and oxygen uptake. Reference Baba, Nagashima and Goto11 The ventilatory anaerobic threshold is dependent on metabolic carbon dioxide production. The minute ventilation/carbon dioxide production slope is predominantly affected by the ratio of the pulmonary dead space to tidal volume. The oxygen uptake efficiency slope by contrast is impacted by both and as such reflects blood distribution to skeletal muscles as well as perfusion to the lungs.
Two previous studies have investigated the correlation between the maximum oxygen uptake and oxygen uptake efficiency slope in the CHD population. Giardini et al in 2008 demonstrated good correlation of the oxygen uptake efficiency slope during the last 50% of exercise duration and oxygen uptake efficiency slope from the entire test with the maximum oxygen uptake in their patients with previous Fontan procedure or atrial switch. They did however report a substantial difference between the oxygen uptake efficiency slope from the first 50% of the test and the maximum oxygen uptake in cyanotic Fontan patients. It was felt that the mechanism for the non-linear relationship between the Log of the minute ventilation and oxygen uptake in this group may be related to right-left shunting and resulting hyperventilation of blood passing through the lungs during exercise. Reference Giardini, Specchia, Gargiulo, Sangiorgi and Picchio29 It should be noted however that a study by Bongers et al Reference Bongers, Hulzebos, Blank, van Brussel and Takken22 identified a linear relationship between the Log of minute ventilation and oxygen uptake throughout the cardiopulmonary exercise test in their group of paediatric cyanotic Fontan patients. Subsequently, in 2011, Buys et al also demonstrated a correlation between the maximum oxygen uptake and the oxygen uptake efficiency slope in adult patients with transposition of the great arteries and univentricular physiology, as well as those with tetralogy of Fallot and coarctation of the aorta. Good correlation of the maximum oxygen uptake with oxygen uptake efficiency slope from the first 75% of the test, the oxygen uptake efficiency slope from the first 90% of the test, and the oxygen uptake efficiency slope from the entire test was seen in all groups except those following atrial switch procedure for transposition of the great arteries. Reference Buys, Cornelissen and Van De Bruaene13 As above, we did not identify any significant drop off in the strength of the correlation across all groups including that of the Fontan patients and the patients following atrial switch repair.
As has been previously recommended, Reference Bongers, Hulzebos, Blank, van Brussel and Takken22 we also feel that it is important to normalise the oxygen uptake efficiency slope for body surface area. Oxygen uptake is traditionally expressed in ml/min/kg; however, the calculation of oxygen uptake efficiency slope does not account for weight, and as such, changes in weight that are often seen with progressive disease may result in erroneous variation in the calculated oxygen uptake efficiency slope. Our analysis did not demonstrate a significant difference when adjusted for body surface area or body mass index; however, we feel that on an individual basis this could account for significant discrepancies.
The linear correlation seen between the logarithm of minute ventilation and oxygen uptake at different exercise intensities is in keeping with data from various patient groups in suggesting that the relationship is effort-independent. Reference Baba, Nagashima and Goto11,Reference Mollard, Woorons and Antoine-Jonville20–Reference Tan, Yang and Guo28 This is an important finding in the adult CHD population in whom the rate of submaximal testing is high, Reference Buys, Cornelissen and Van De Bruaene13 and objective assessment of cardiorespiratory function can be key to interventional decisions. Perhaps most importantly, the strong correlation between the maximum oxygen uptake and the oxygen uptake efficiency slope at ventilatory anaerobic threshold will give clinicians some insight into the cardiorespiratory reserve of patients with CHD who are unable to achieve a maximum oxygen uptake.
Strengths and limitations
As all patients who achieved a maximal test were included this is a truly representative sample of the case mix of our tertiary adult CHD service, and although the heterogenicity of the patients makes some comparisons difficult, we feel that the results are generalisable and the numbers are greater than the two previous similar studies. Retrospective data collection comes with inherent limitations; however, this does remove some potential bias and we made every effort to reduce data collection errors. The clinical utility of the oxygen uptake efficiency slope from the first 90% of the test and the oxygen uptake efficiency slope from the first 75% of the test is limited; however, knowing that there is a strong correlation of the maximum oxygen uptake with the oxygen uptake efficiency slope once the patient achieved ventilatory anaerobic threshold allows conclusions to be drawn from the oxygen uptake efficiency slope in future submaximal tests where this threshold is achieved.
Conclusion
In adult patients with CHD who are unable to complete a maximal cardiopulmonary exercise test, the oxygen uptake efficiency slope is a reliable indicator of cardiopulmonary fitness which correlates strongly with the maximum oxygen uptake irrespective of exercise intensity. A strong correlation has been shown at or beyond ventilatory anaerobic threshold. Further research is required to further validate the findings in patients with less common anatomies and to assess the relationship between the oxygen uptake efficiency slope and mortality.
Graphical representation of oxygen uptake efficiency slope calculation from the entire test, from first 90%, from first 75% and at ventilatory anaerobic threshold. VE; minute ventilation, VO2; oxygen uptake, OUES100; oxygen uptake efficiency slope from the entire test, OUES90; oxygen uptake efficiency slope from first 90%, OUES75; oxygen uptake efficiency slope from first 75%, OUESVAT; oxygen uptake efficiency slope at ventilatory anaerobic threshold.

Relationship between peak V02 and OUES100 (top left); peak V02 and OUES90 (top right); peak V02 and OUES75 (bottom left); peak V02 and OUESVAT (bottom right). Peak V02; maximum oxygen uptake, OUES75; oxygen uptake efficiency slope from the first 75% of the test, OUES90; oxygen uptake efficiency slope from the first 90% of the test, OUES100; the oxygen uptake efficiency slope from the entire test, OUESVAT; oxygen uptake efficiency slope at ventilatory anaerobic threshold.

Correlation of OUES100 with OUES90 and OUES75. OUES75; oxygen uptake efficiency slope from the first 75% of the test, OUES90; oxygen uptake efficiency slope from the first 90% of the test, OUES100; oxygen uptake efficiency slope from the entire test.

Competing interests
None.