Introduction
Understanding the extent to which natural populations may tolerate or adapt to rapidly changing environmental conditions associated with climate change is a critical scientific challenge in the coming decades. Within marine ecosystems, ocean acidification (OA) - the decrease of oceanic pH via absorption of anthropogenic CO2 by surface waters - is a threat to marine organisms, trophic linkages and ecosystem services which will have significant ecological and societal impacts (for recent reviews see Hofmann et al. Reference Hofmann, Barry, Edmunds, Gates, Hutchins, Klinger and Sewell2010, Turley et al. Reference Turley, Eby, Ridgwell, Schmidt, Findlay, Brownlee, Riebesell, Fabry, Feely and Gattuso2010). Rapid rates of change are predicted with high latitude regions reaching thresholds for aragonite undersaturation and pH tolerance within the next 10–20 years (see Orr Reference Orr, Fabry and Aumont2005, McNeil & Matear Reference McNeil and Matear2008, Steinacher et al. Reference Steinacher, Joos, Frölicher, Plattner and Doney2009, Turley et al. Reference Turley, Eby, Ridgwell, Schmidt, Findlay, Brownlee, Riebesell, Fabry, Feely and Gattuso2010).
A key gap in our ability to understand the biological implications of future ocean acidification is a lack of data regarding current pH dynamics. Although environmental pH data are emerging for well-characterized regions such as the west coast of North America (Feely et al. Reference Feely, Sabine, Hernandez-Ayon, Ianson and Hales2008), they remain far less abundant for remote areas such as polar oceans. Additionally, until very recently there has been no way to continuously monitor ocean pH in a cost effective manner. Knowledge regarding current environmental pH dynamics would provide insight into present-day physiological tolerances and the potential resilience of species to future ocean acidification conditions (Hofmann et al. Reference Hofmann, Barry, Edmunds, Gates, Hutchins, Klinger and Sewell2010). Further, field based pH observations can also provide an environmentally relevant context for CO2 exposure experiments in the laboratory (see Yu et al. Reference Yu, Matson, Martz and Hofmann2011).
The Southern Ocean is a region expected to be particularly vulnerable to ocean acidification (Orr Reference Orr, Fabry and Aumont2005, McClintock et al. Reference McClintock, Ducklow and Fraser2008, Fabry et al. Reference Fabry, McClintock, Mathis and Grebmeier2009) and this perspective has driven emerging research to determine the tolerance of Antarctic calcifiers to conditions of future acidification scenarios (see Hofmann et al. Reference Hofmann, Barry, Edmunds, Gates, Hutchins, Klinger and Sewell2010). The vulnerability of Antarctic waters to OA is primarily due to the increased affinity for dissolved gases in cold water that leads to a reduction in carbonate ion concentration, resulting in a greater degree of difficulty for biogenic calcification at high latitudes than in temperate or tropical systems (Fabry et al. Reference Fabry, McClintock, Mathis and Grebmeier2009). This situation is further exacerbated by large seasonal fluctuations in aragonite saturation (McNeil & Matear Reference McNeil and Matear2008, McNeil et al. Reference McNeil, Sweeney and Gibson2011) with predictions of seasonal aragonite undersaturation to occur by the year 2038 (McNeil & Matear Reference McNeil and Matear2008). Notably, a shoaling of both the calcite and aragonite saturation horizons may have strong effects on many Antarctic calcifiers, for example echinoderms (Sewell & Hofmann Reference Sewell and Hofmann2011), which represent a large calcium carbonate reservoir in the global ocean (Lebrato et al. Reference Lebrato, Iglesias-Rodriguez, Feely, Greeley, Jones, Suarez-Bosche, Lampit, Cartes, Green and Alker2010). While previous laboratory experiments have shown rapid post-mortem dissolution of Antarctic mollusc shells and calcareous algal thalli under low pH conditions (McClintock et al. Reference McClintock, Angus, McDonald, Amsler, Catledge and Vohra2009), we have less understanding of whether Antarctic calcifying invertebrates possess the physiological capacity to cope with these conditions (but see Ericson et al. Reference Ericson, Lamare, Morley and Barker2010, Cummings et al. Reference Cummings, Hewitt, van Rooyan, Currie, Beard, Thrush, Norkko, Barr, Heath, Halliday, Sedcold, Gomez, McGraw and Metcalf2011, Kawaguchi et al. Reference Kawaguchi, Kurihara, King, Hale, Berli, Robinson, Ishida, Wakita, Virtue, Nicol and Ishimatsu2011). These critical experiments will be greatly aided by data reflecting current in situ pH as well as the magnitude of variation in pH that these species currently experience on daily and seasonal scales.
Here, we present high-resolution observations of pH from under fast sea ice in the southern Ross Sea, Antarctica, using an autonomous pH sensor during the spring (October–December 2010). This is a period when pH and aragonite saturation are predicted to be at their lowest levels (McNeil et al. Reference McNeil, Tagliabue and Sweeney2010, Reference McNeil, Sweeney and Gibson2011). This region experiences a strong seasonal shift in seawater pH (c. 0.3–0.5 units) between summer and winter due to a wintertime reduction in photosynthesis (Littlepage Reference Littlepage1965), moderated by a disequilibrium of air-sea CO2 exchange due to annual surface sea ice and deep water entrainment (McNeil et al. Reference McNeil, Tagliabue and Sweeney2010). The majority of water chemistry data in this region has been limited to discrete sampling events during oceanographic cruises (e.g. US Joint Global Ocean Flux Study, http://www1.whoi.edu/). One dataset with semi-weekly observations of pH has been recorded at a single location under sea ice (Littlepage Reference Littlepage1965). While a recent study has provided several single pH data points (Cummings et al. Reference Cummings, Hewitt, van Rooyan, Currie, Beard, Thrush, Norkko, Barr, Heath, Halliday, Sedcold, Gomez, McGraw and Metcalf2011), no higher frequency observations are, to our knowledge, currently available. Such a gap represents a barrier to understanding current and future pH dynamics in nearshore areas under sea ice in the Southern Ocean as well as to conducting manipulative laboratory experiments framed with environmentally relevant pH/pCO2 conditions for the region.
Materials and methods
Three sites were used. At two of the sites, Cape Evans (77°38.059′S, 166°26.905′E; 26 October–15 November 2010) and Cindercones (77°48.002′S, 166°40.272′E; 7–23 October 2010), the sensor was mounted c. 1 m above the benthos at c. 15 m depth by divers using SCUBA. We selected this depth to inform our own experiments with species from the shallow benthic community. Due to the greater depth (500 m) at the third site, Erebus Basin (77°50.848′S, 166°39.987′E, 27 November–11 December 2010), the sensor was mounted on a steel cable and suspended in the water column (15 m depth) from the surface. Both Cape Evans and Erebus Basin were covered by first-year sea ice while Cindercones was covered by multiyear sea ice that had probably not receded in more than ten years.
The SeaFET is an autonomous data logger based on a Honeywell Durafet® pH sensor (Martz et al. Reference Martz, Connery and Johnson2010). The SeaFET was programmed to record and average pH voltage over a 30 s period once every 30 min. Upon deployment the sensor was allowed to stabilize for several days. Following this conditioning period, the sensor calibration was set using a discrete sample collected in situ. This single point calibration approach is justified when the sensor obeys the Nernst equation and the temperature component of the standard potential has been previously characterized, both of which have been repeatedly demonstrated for SeaFET sensors (Martz et al. Reference Martz, Connery and Johnson2010). The water sample was collected adjacent to the sensor by SCUBA divers using a 5 l Niskin sampling bottle prior to retrieval. From this sample, a 500 ml water sample was returned to the laboratory. Seawater salinity (34.7) was measured with a benchtop digital salinity meter (YSI 3100 Conductivity). Methods for CO2 analysis were modified from Standard Operating Procedures (SOP) for spectrophotometric pH (SOP 6b) and total alkalinity (TA, SOP 3b) (Dickson et al. Reference Dickson, Sabine and Christian2007) as reported in Fangue et al. (Reference Fangue, O'Donnell, Sewell, Matson, MacPherson and Hofman2010). Total alkalinity was determined based on samples (n = 66) collected from all three study locations between 8 October–3 December 2011. In situ pH was then calculated at -1.9°C using CO2SYS for MS Excel (Pierrot et al. Reference Pierrot, Lewis and Wallace2006) using the constants of Mehrbach et al. (Reference Mehrbach, Culberson, Hawley and Pytkowicz1973) as refit by Dickson & Millero (Reference Dickson and Millero1987). We note that, due to the calibration approach used, sensor accuracy depends mostly upon collection of a representative discrete sample. Based on experience, we expect that data presented here accurately represent pH variability with a finite yet unquantified error in accuracy dominated by sampling errors. Past experience suggests that sampling errors lead to vicarious calibration errors of c. 0.01 pH or less. Second order errors due to extending the fit of temperature dependent equilibrium constants in CO2SYS and temperature dependent sensor calibration coefficients for the SeaFET sensor, both fit to data above zero, introduces additional unquantified error, yet this error is most probably smaller than the aforementioned discrete sampling error.
The distribution of pH observations was first analysed graphically and examined for normality. At all three locations, pH observations were non-normally distributed (Shapiro-Wilkes test: WCape Evans = 0.98, WCindercones = 0.67, WErebus Basin = 0.5; P < 0.001 for all locations), and showed differing degrees of left-skewness (γCape Evans = 0.49, γCindercones = 3.16, γErebus Basin = 3.28). As such, measures of mean and standard deviation may not be appropriate and a baseline pH for each location was determined by identifying the median of each distribution. Baseline pH and total alkalinity at each location were compared using a Kruskal-Wallis one-way nonparametric analysis of variance test. Variation in pH was then compared to this baseline by determining the frequency and magnitude of observations above and below the baseline. In addition, pH hours were calculated by summing the area under each curve to quantify the magnitude and duration of pH fluctuation during each deployment with the ratio of pH hours above to pH hours below baseline indicating the relative scale of fluctuation. This value is conceptually similar to degree heating hours (DHH), which has been previously used in coral and temperate rocky intertidal systems (Leichter et al. Reference Leichter, Helmuth and Fisher2006, Helmuth et al. Reference Helmuth, Broitman, Yamane, Gilman, Mach, Mislan and Denny2010). Due to the current lack of knowledge regarding threshold levels for pH stress in Antarctic marine organisms (as has been used in studies of thermal biology), we use baseline pH as the reference threshold for this calculation.
Results
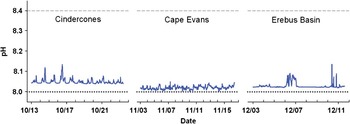
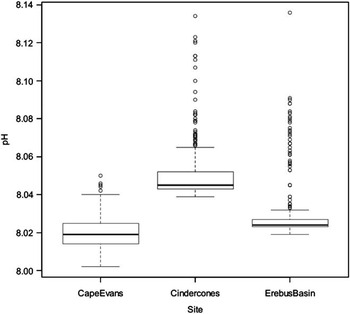
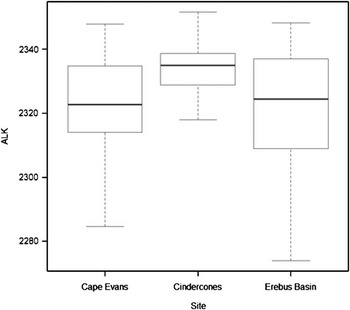
Observations of pH fluctuated through time at each study location (Fig. 1). At Cape Evans, our primary study location, baseline pH was 8.019 and ranged from 8.002–8.050. The largest diel change in pH at this site was 0.043 units. The sensor recorded 313 observations above and 293 observations below the baseline (48.4% and 45.3% respectively). Cumulative pH hours above and below the baseline were 1.19 and 0.85 respectively, with a ratio of 1.4. Additional deployments were made at shallow (Cindercones) and deep sites (Erebus Basin). At Cindercones, baseline pH was 8.045 with a range of 8.039–8.134 and a maximum diel change of 0.092 units. The sensor recorded 249 observations above and 221 below the baseline (49.7% and 44.1% respectively) which resulted in cumulative pH hours of 1.54 and 0.29 respectively, and a ratio of 5.4. At Erebus Basin, baseline pH was 8.024 and ranged from 8.019–8.134 with a maximum diel change of 0.114 units. The sensor recorded 177 observations above and 131 observations below the baseline (42.9% and 31.7% respectively) which resulted in cumulative pH hours above and below baseline of 1.20 and 0.089 respectively, and a ratio of 13.6. Although a strong tidal signal was seen at Cindercones and to a lesser extent at Cape Evans, there was no evidence of a tidal signal at Erebus Basin (Fig. 1). Baseline pH values differed between study locations (Fig. 2; Kruskal-Wallis: H = 1002.75, df = 2, P < 0.001) as did total alkalinity (Fig. 3; Kruskal-Wallis: H = 6.43, df = 2, P = 0.0401), but caution should be used as each location was instrumented sequentially in time and thus location differences may reflect temporal changes in the oceanographic environment.
Time series of pH (blue line) at study locations in McMurdo Sound in the southern Ross Sea. Reference lines indicate annual pH range in the Ross Sea as reported by McNeil et al. (Reference McNeil, Tagliabue and Sweeney2010) between summer (dashed) and winter (dotted).

Box plot of pH variation at study locations in McMurdo Sound. Whisker length is equal to 1.5 × interquartile range (IQR) with circles representing outlier datum. At Cape Evans, n = 647, IQR = 0.011, and n outlier = 6. At Cindercones, n = 501, IQR = 0.009, and n outlier = 40. At Erebus Basin, n = 413, IQR = 0.004, and n outlier = 61.

Box plot of daily total alkalinity (ALK; μmol·kg-1) at study locations in McMurdo Sound. Whisker length is equal to 1.5 × interquartile range (IQR). At Cape Evans, n = 22, and IQR = 18.95. At Cindercones, n = 17, and IQR = 9.9. At Erebus Basin, n = 28, and IQR = 27.8.

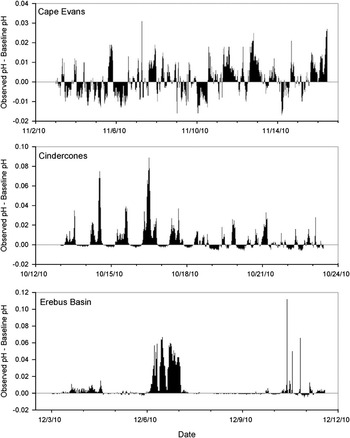
With the exception of several large signal pulses at Erebus Basin and Cindercones, these data show relatively low variation in pH on the scale of hours to days during the recorded periods. The interquartile range (IQR) at each location, representing the middle 50% of observations, is very narrow, particularly at Erebus Basin (Fig. 2). When large pH fluctuations did occur, they were predominantly positive, resulting in increased pH, though the intensity appeared to be location dependent (Fig. 4). Estimations of baseline calcite (ΩCa) and aragonite (ΩAr) saturation states, based on observed pH, salinity, and median total alkalinity for each location, showed a similar pattern to pH (Cape Evans, TA = 2322.8 μmol·kg-1, ΩCa = 1.98, ΩAr = 1.24; Cindercones, TA = 2334.9 μmol·kg-1, ΩCa = 2.10, ΩAr = 1.32; Erebus Basin, TA = 2324.4 μmol·kg-1, ΩCa = 2.00, ΩAr = 1.26) with no subsaturation (Ω < 1) observed at any location.
Differential in pH between observed and baseline levels at each study location. Column values > 0 indicate pH observations above baseline pH while negative column values represent pH observations below baseline pH.

Discussion
Although this dataset is temporally limited, it suggests that marine organisms in McMurdo Sound may be experiencing a relatively consistent daily pH environment underneath the sea ice in the austral spring and early summer. Daily fluctuations at Cape Evans were almost one order of magnitude lower than was observed at a nearshore site in the Santa Barbara Channel, California during July–August (Yu et al. Reference Yu, Matson, Martz and Hofmann2011). Analysis by McNeil et al. (Reference McNeil, Tagliabue and Sweeney2010) of data collected in the Ross Sea suggested strong seasonal pH fluctuations (increased from c. 8.0–8.4 from September–January), which we did not observe during our sensor deployments. However, McNeil et al. used data collected in areas free of sea ice whereas all observations in our study were made under fast sea ice. Additionally, there may be regional differences in the timing and onset of these fluctuations (McNeil et al. Reference McNeil, Sweeney and Gibson2011). It is possible that the predicted increase in pH to summer levels (c. 8.4, McNeil et al. Reference McNeil, Tagliabue and Sweeney2010) occurs later in McMurdo Sound or that our sensor deployments ended prior to any large-scale increases in pH. However, longer deployments at multiple locations would be necessary to further explore and understand this question and any spatial heterogeneity in pH dynamics.
It is not known why there is a difference in baseline pH across our study locations, though we would speculate that it may be due to a combination of physical (e.g. changes in carbonate parameters due to mixing or differing residence times due to coastal geography and/or bathymetry) or biological factors (e.g. community composition and/or variation in photosynthesis and respiration). Net flow in eastern McMurdo Sound is predominately southerly, though diurnal tides have a strong oscillatory effect (Barry & Dayton Reference Barry and Dayton1988). However, northerly flows of Ross Ice Shelf Water, moving around the south end of Ross Island from under the ice shelf, have been observed to block southerly flow in eastern McMurdo Sound (Lewis & Perkin Reference Lewis and Perkin1985). Cindercones, as our southernmost study location, could be more affected by such northerly flows, which are characterized as being of lower salinity, nutrients, and oxygen (Barry Reference Barry1988). Additionally, of the three study locations, Cindercones was the only one with multiyear sea ice coverage. McMinn et al. (Reference McMinn, Ryan, Ralph and Pankowski2007) found a positive correlation between ice thickness and algal biomass. Photosynthetic efficiency is species-dependent in sea ice algae with some species showing adaptation to wintertime light levels (McMinn et al. Reference McMinn, Martin and Ryan2010) which may support greater biomass under thicker ice. Although not examined here, increased photosynthesis could contribute to an increase in pH, though the required scale in not known and this is purely speculative in this instance. Though logistically challenging, a longer deployment of a SeaFET sensor, preferably over winter, would add great insight into the low-frequency pH variation that marine calcifiers are experiencing under the sea ice.
To date, the majority of work pertaining to OA has focused on temperate and tropical calcifying species, which have shown responses to decreased pH that are complex, varying with species and by ecosystem (see Hofmann et al. Reference Hofmann, Barry, Edmunds, Gates, Hutchins, Klinger and Sewell2010 for a recent review). Studies on calcification and other physiological processes in polar benthic invertebrates are currently few. Effects of elevated CO2 on the bi-polar pteropod, Limacina helicina (Phipps), have been shown to include reduced calcification (Comeau et al. Reference Comeau, Jeffree, Teyssié and Gattuso2010) as well as metabolic suppression equivalent to long-term starvation (B. Seibel unpublished data). Cummings et al. (Reference Cummings, Hewitt, van Rooyan, Currie, Beard, Thrush, Norkko, Barr, Heath, Halliday, Sedcold, Gomez, McGraw and Metcalf2011) found patterns of gene expression and respiration in the Antarctic bivalve, Laternula elliptica (King & Broderip), which indicated a negative response to past (glacial) as well as future predicted CO2 levels. Currently these studies, as well as many other OA studies from other ecosystems including our own (e.g. O'Donnell et al. Reference O'Donnell, Todgham, Sewell, Hammond, Ruggiero, Fangue, Zippay and Hofmann2010), are performed using IPCC-based emission scenarios for future levels of atmospheric pCO2. We now believe that we can use the increasing availability of in situ pCO2 and pH data to better design experiments that have a robust environmental context (Yu et al. Reference Yu, Matson, Martz and Hofmann2011).
Furthermore, deeper knowledge of the physical environment with respect to pH will contribute to exploring the extent to which local adaptation can be found in populations of Antarctic organisms as has been observed in some marine invertebrates (see Sanford & Kelly Reference Sanford and Kelly2011). Understanding the temporal and spatial dynamics is necessary to elucidate interactions between physical parameters, e.g. the complex thermal heterogeneity of intertidal environments along the western United States (Helmuth et al. Reference Helmuth, Harley, Halpin, O'Donnell, Hofman and Blanchette2002). Using temperature loggers enclosed within mussel shells, the authors found an interaction between air temperature and the time of low tide, which results in populations at some northern sites being more thermally stressed than southern populations. Such variation has been found to influence the thermal tolerance in marine invertebrates (e.g. Kuo & Sanford Reference Kuo and Sanford2009) and locally adapted populations may also exist for certain species. In Antarctica, an array of pH or pCO2 sensors could be used to identify pH ‘refugia’, areas with little variation, or pH ‘hotspots’, areas of extremes in pH variation, where populations of marine calcifiers may exist that possess the genetic resources to adapt to a changing ocean.
In summary, environmental data such as these are important to global change biology conducted on Antarctic marine invertebrates, a need that has been demonstrated by research in thermal biology (Helmuth et al. Reference Helmuth, Broitman, Yamane, Gilman, Mach, Mislan and Denny2010). Previous research indicates that Antarctic invertebrates have a limited capacity to acclimate to abiotic factors such as temperature (Peck et al. Reference Peck, Morley and Clark2010). Currently, it is not clear to what extent these organisms will be able to adjust to alterations in seawater chemistry (changes in pH and carbonate ion concentration) that are expected with future acidification of Antarctic waters. Reduced acclimatization ability could result in these species being more probably ‘losers’ in a changing climate (Somero Reference Somero2010). However, such predictions are difficult without an accurate understanding of the pH dynamics that these species experience on a regular basis.
Acknowledgements
The authors thank members of the U.S. Antarctic Program, particularly P. McNerney, J. Watson, R. Robbins, and S. Rupp, for technical support and diving operations at McMurdo Station, Antarctica. We thank Hofmann lab members, E. Hunter and E. Rivest, for assistance with seawater chemistry both in Antarctica and at UC Santa Barbara; and Brittany Peterson from the Martz lab for assistance with SeaFET construction. We thank members of the Bravo 134 field team for their field support during SeaFET deployment (Prof M. Sewell, Dr P.C. Yu, E. Hunter, L. Kapsenberg, P. Lubchenco, and E. Rivest). The authors are grateful to Dr J. Margo Dutton for many thoughtful comments that greatly improved this manuscript. This research was supported by: 1) US National Science Foundation (NSF) award ANT-0944201 to GEH from the Antarctic and Organisms and Ecosystems Program, 2) NSF grant OCE (OTIC) 0844394 to TRM (in support of the SeaFET development), and 3) by funds from the University of California in support of a multi-campus research program, Ocean Acidification: A Training and Research Consortium, (http://oceanacidification.msi.ucsb.edu/) to GEH and TRM. During the writing of this manuscript, PGM was partially supported by a Graduate Fellowship from the Interdepartmental Graduate Program in Marine Science at UCSB. The constructive comments of the reviewers are also gratefully acknowledged.