INTRODUCTION
Replacing bare fallow with cover crops may improve the control of weed species (Den Hollander et al. Reference Den Hollander, Bastiaans and Kropff2007), erosion (Bowman et al. Reference Bowman, Shirley, Cramer and Clark2000) and nitrate leaching (Gabriel et al. Reference Gabriel, Almendros, Hontoria and Quemada2012). From a biological point of view, cover crops contribute to soil disease control and act as a reservoir for beneficial insects (Mojtahedi et al. Reference Mojtahedi, Santo, Hang and Wilson1991). In addition, they provide an additional input of organic matter to the soil (Kuo et al. Reference Kuo, Sainju and Jellum1997), increasing the stability of aggregates and ameliorating the physical properties of compacted soils (Reeves Reference Reeves, Hatfield and Stewart1994). Furthermore, they are used as a source of forage in integrated agricultural systems (Hartwig & Ammon Reference Hartwig and Ammon2002) and in the future they might be exported from the system, sold and integrated in animal feeding industrial processes (Liu et al. Reference Liu, Jiang, Zhuang and Wang2008). All these potential benefits are defined as ‘ecosystem services’ (Díaz et al. Reference Díaz, Lavorel, de Bello, Quétier, Grigulis and Robson2007) and the capability of a particular cover crop to provide certain benefits might depend on characteristics of its growth pattern, nutrient exchange and chemical composition. However, these benefits are not usually required as a whole, so farmers should first determine the primary benefits desired. In addition, if cover crops are improperly managed or selected they may have a negative effect on the cash crop, either by competing for water and nutrients, enabling diseases to build up, or retarding seed germination (Thorup-Kristensen et al. Reference Thorup-Kristensen, Magid and Jensen2003). Proper management and choice of cover crops are therefore essential to maximize the advantages and minimize drawbacks, and cover crop selection should be targeted to the specific needs of the farmer and the agrosystem. Improving cover crop characterization might provide tools to the stakeholders for selecting species that are most suitable for reaching the ecosystem services required in a particular agrosystem.
The application of mathematical models to characterize relevant growth patterns of cover crop species might produce valuable quantitative data. How fast a crop covers the ground is an indicator of its ability to control soil erosion (Bowman et al. Reference Bowman, Shirley, Cramer and Clark2000). The dynamics of biomass accumulation is related to nutrient uptake and the crop potential to act as a green manure or catch crop (Gabriel et al. Reference Gabriel, Almendros, Hontoria and Quemada2012). Some models (Gompertz, logistic, exponential) have been used successfully for comparing ground cover and biomass evolution of representative cover crop species (Den Hollander et al. Reference Den Hollander, Bastiaans and Kropff2007; Bodner et al. Reference Bodner, Himmelbauer, Loiskandl and Kaul2010). The goal of these descriptive models should be the identification and quantification of parameters that might improve targeted cover crop selection and utilization.
Biomass chemical composition is another crucial factor when selecting for cover crops, as it has been shown to determine carbon (C) and nitrogen (N) mineralization (Schomberg et al. Reference Schomberg, Steiner and Unger1994), crop residue water retention (Quemada & Cabrera Reference Quemada and Cabrera2002) and fodder quality (Qiu et al. Reference Qiu, Eastridge and Wang2003). Crop residues remaining at the soil surface are important for controlling soil erosion (Langdale et al. Reference Langdale, Blevins, Karlen, McCool, Nearing, Skidmore, Thomas, Tyler, Williams and Hargrove1991). The residue chemical characteristics that determine decomposition process kinetics are mainly the C : N ratio and the residue quality, defined as the C allocation to pools of different decay rates (Quemada Reference Quemada2004). High C : N ratio and low residue quality, obtained as the sum of the labile and cellulose-like decomposable fraction of the residue, in a cover crop should be targeted when selecting for erosion control. If the goal is breeding for green manure, by transferring the N mineralized from the cover crop residue to the subsequent cash crop, a low C : N ratio and high residue quality should be aimed for. When cover crops are used as catch crops, the capability to control nitrate leaching is linked to the amount and dynamics of N uptake that depends to some extent on the species chosen (Vos & van der Putten Reference Vos and van der Putten2004). The opportunity of using cover crops as animal feed in early spring might justify the extra cost of cover cropping in some agricultural systems. Forage digestibility is also determined by chemical composition. High neutral detergent fibre (NDF) content and low lignin content is desirable for optimal digestibility (Goering & Van Soest Reference Goering and Van Soest1970).
A reasonable hypothesis is that the ability of cover crops to provide ecosystem services depends on the plant species and that the quantification of the main variables that characterize the behaviour of these species might be important for optimizing cover crop management and selection. The goal of the current work was to compare the traits that determine the suitability of five crop species (i.e. barley, rye, triticale, mustard and vetch) as cover crops. Expected differences between species were tested by analysing the ground cover evolution, biomass accumulation and residue chemical composition.
MATERIALS AND METHODS
The study was conducted during two seasons (2010/11 and 2011/12) between the months of October and April/May of the following year at the experimental farm of the Technical University of Madrid (40°26′N, 3°44′W, 605 m a.s.l.). The upper 20 cm of the soil had a pH of 8·5 (1 g soil/2·5 ml H2O) and contained 1·3 g C/kg and 0·15 g N/kg. The amount of inorganic N in the upper 30 cm soil was ~70 kg N/ha in both seasons. The concentration of available phosphorus (P) extracted with sodium bicarbonate was 60·4 mg/kg and potassium (K) extracted with ammonium acetate was 520 mg/kg.
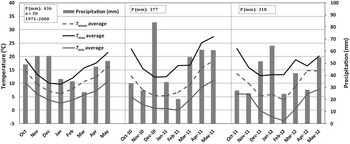
The area had a Mediterranean semi-arid climate with high inter-annual variability and a mean annual temperature of 14·6 °C; January had the lowest mean monthly temperature (6·1 °C) while July had the highest (24·8 °C). Average annual rainfall was 436 mm, being the average from October to April 306 mm. Measurements of the main climate variables were recorded throughout the experiment at the field site (Fig. 1).
Climatic data along the growth period of cover crops: (left) 30-year series from a local climatic station; (centre) the first (2010/11) and (right) the second (2011/12) season of cover crops studies from a climatic station situated at the experimental site.

Five species were arranged in a completely randomized design with three replications: barley (Hordeum vulgare L. cv. Hispanic), triticale (x Triticosecale Whim cv. Titania), rye (Secale cereale L. cv. Petkus), mustard (Sinapis alba L. subsp. mairei (H. Lindb.) Maire.) and vetch (Vicia sativa L. cv. Prontivesa). Plot size was 2·4×7 m2. Sowing was performed on 7 and 11 October in 2010 and 2011, respectively, by means of a seed drill with 20 cm between rows and a density of 240 seeds/m2. Fertilizer application was not necessary, as initial nutrient levels were sufficient. Manual weed control was carried out periodically during all experiments. The experiment was terminated sequentially, at anthesis in the grasses and at flowering in vetch and mustard (growth stage (GS) 61, Lancashire et al. Reference Lancashire, Bleiholder, Van den Boom, Langelüddeke, Stauss, Weber and Witzenberger1991).
The measured variables were ground cover, biomass accumulation, N uptake and N derived from the atmosphere in the legume (Ndfa), plant C : N ratio, dietary fibre content and crop residue quality. The ground cover and biomass were monitored during the whole crop cycle. Ground cover was always measured in a marked surface inside each plot (1·5×1·5 m2). Ground cover was analysed on 21 dates in the first season and 22 in the second, while biomass was analysed on 8 dates in the first season and 10 in the second. The other four variables were determined in homogeneous biomass sub-samples harvested at the end of the experiment.
The ground cover was determined based on digital pictures of the marked surface taken from a nadir perspective at a 1·5 m height. The images were taken with a Ricoh R8 camera with a lens resolution of three megapixels attached face-down to a tripod and processed using SigmaScan Pro 5® software. An overlay was used corresponding to green colour in the light conditions of an overcast day. The ground cover was calculated as the number of pixels of the layer divided by the total number of pixels that constitute the image of the marked surface (Ramirez-Garcia et al. Reference Ramirez-Garcia, Almendros and Quemada2012). Ground cover data before the first frost were adjusted to the Gompertz function, which assumed a sigmoid growth until an asymptotic maximum value (Pegelow et al. Reference Pegelow, Taylor, Horrocks, Buxton, Marx and Wanjura1977; Bodner et al. Reference Bodner, Himmelbauer, Loiskandl and Kaul2010):
 $$\eqalign{{\rm Ground}\,{\rm cover}_{\rm i} =& {\rm Ground}\,{\rm cover}_{{\rm max}} \cr & \times \exp \{ - \exp (k_{\rm G} (t_{\max} - t_{\rm i} ))\}} $$
where ground coveri (proportion) was the ground cover at thermal time t i (°C/day), Ground covermax (proportion) was the maximum ground cover, k G (°C/day) was the weighted mean relative growth rate and t max (°C/day) was the thermal time until maximum growth rate was reached. The curves obtained for each species allowed calculation of the characteristic t i values t 30, t 50 and t 70 (°C/day), which were defined as the thermal time until the ground cover reached i%: 30, 50 and 70%, respectively.
Above-ground biomass was acquired by destructive sampling from 0·25×0·25 m2 frames. Samples were dried for 48 h at 65 °C and subsequently weighed. The biomass data were fitted to three different models, i.e. a Gompertz (Eqn 2), a logistic (Eqn 3) and a segmented linear-exponential function (Eqn 4) expressed as:
 $${\rm BM}_{\rm i} = {\rm BM}_{{\rm maxg}} \exp \{ - \exp(k_{\rm g} (t_{\max} - t_{\rm i} ))\} $$
 $${\rm BM}_{\rm i} = \displaystyle{{{\rm BM}_{\max \log}} \over {1 + \exp ( - k_{\max} \times (t_{\rm i} - m))}}$$
 $$\eqalign{t_{\rm i} \lt t_{\rm 0} \,{\rm BM}_{\rm i} = b \times t_0 ;\quad t_{\rm i} \ges t_0 \,{\rm BM}_{\rm i} = \exp (k_{1 - {\rm e}} \times t_{\rm i} )}$$
where BMi (g/m2) was the biomass at thermal time t i (°C/day). In Eqn (2) k g (°C/day) was the weighted mean relative growth rate, t max (°C/day) was the thermal time until growth rate was maximum and BMmaxg (g/m2) was the upper asymptote, as well as BMmaxlog (g/m2) in Eqn (3). In this equation k max (°C/day) was the maximum relative growth rate and m (°C/day) was the thermal time at which BMi reached 50% of BMmaxlog. In Eqn (4) k l−e expressed the growth rate, while t 0 (°C/day) was the thermal time from which the model turned to exponential and b (g/m2) the slope of the linear model.
The C and N concentrations were measured by the Dumas method (LECO CHNS-932® Analyser, St. Joseph, MI, USA). The N derived from the atmosphere (Ndfa) in the legume was estimated by the natural abundance method (Peoples et al. Reference Peoples, Herridge and Ladha1995), based on the δ15N (‰) determination (Europa Scientific 20-20 IRMS Analyser®, Crewe, UK) on sub-samples from the legume and two reference crops (barley and mustard). Soil N uptake by the vetch was calculated as the difference between the N accumulated in the plant and the Ndfa. NDF, acid detergent fibre (ADF) and lignin (L) were assessed by the Goering & Van Soest method (Reference Goering and Van Soest1970), and dietary fibre content (mg/g) calculated as the total fibre (NDF-L). The crop residue quality was calculated as the sum of its labile (100-NDF) and cellulose like (ADF-L) decomposable fraction (Quemada & Cabrera Reference Quemada and Cabrera1995).
Statistical differences between species were compared by means of the Tukey's test (P<0·001). Estimated parameters of the sigmoid models adjusted to the ground cover and biomass data were assessed using the non-linear regression procedure of PASW Statistics Software® version 18 (formerly SPSS Statistics).
RESULTS
Climatic influence on the measured variables
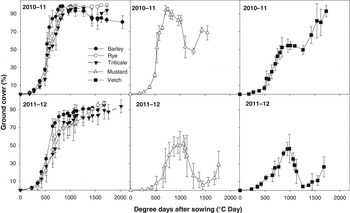
During the two seasons, rainfall was favourable for cover crop establishment and growth (Fig. 1). During the first season, a total of 316 mm fell from October to April, while 263 mm accumulated in the same period of the second season. The temperature followed a classic distribution in Mediterranean climatic areas with continental influence, mild mean winter temperatures (10·2 °C in the first season and 9·6 °C in the second) but accompanied with frosty periods that limited plant growth. In the first season, mustard suffered a decrease in ground cover after 750 °C/day, corresponding to 15 December and attributable to frosts (Fig. 2). This decay was more pronounced after reaching 1000 °C/day (end of January), and occurred also in vetch. The second winter was cooler compared to the first, and affected mustard and vetch growth more seriously after 20 January (1000 °C/day). Grasses were also affected by cold temperatures but to a lesser extent, and ground cover and biomass showed a gradual increase in the second season compared to the first. Since the frosts persisted in the second season as far as the beginning of March (1500 °C/day), the mustard and vetch growth decreased until then. Overall, grass growth was similar in both seasons, whereas mustard and vetch were strongly affected by differences in weather conditions between the 2 years.
Evolution of ground cover (mean±s.e.d.) of the five cover crop species studied during two consecutive seasons.

Ground cover
The grasses attained the largest amount of ground cover, and all of them attained values >70% at the end of the experiment in both years (Fig. 2). Barley always covered the ground faster than the other species. Mustard covered the soil as fast as the grasses in the first season, achieving 95% ground cover at 710 °C/day, but the next year ground coverage was delayed and only reached a maximum of 52%. In the first season, ground cover for vetch was always lower than for mustard, except at the end where it was similar. The vetch attained 96% ground cover at the end of the experiment in the first season, while during the second season it never exceeded 47%. Ground cover decreased both in mustard and vetch after 1012 and 989 °C/day, respectively for each season, coinciding with low temperatures at the end of January. There was a rapid recovery in the first season at 1432 °C/day, while only slight re-growth was seen at the end of the experiment in the second season.
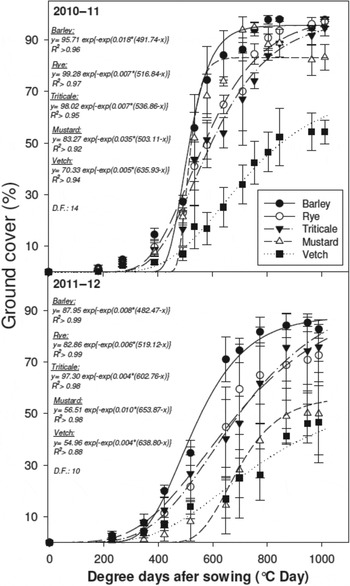
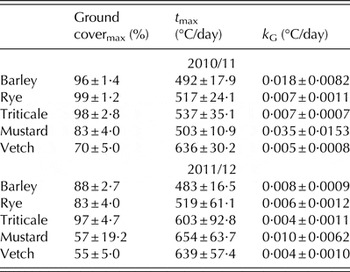
The Gompertz function was adjusted to the ground cover results until the mustard and vetch decayed (Fig. 3). The model fitted well for all cover crops in both seasons for the period considered (R 2>0·88). The estimated values of the three parameters: Ground covermax (%), t max (°C/day) and k G (°C/day) and their standard deviations are shown in Table 1. The Ground covermax for the grasses was larger than for the other species in both seasons, attaining >95% in 2011 and between 83 and 97% in 2012. Mustard presented a larger Ground covermax than vetch in the first season, while in the second both crops reached similar values. Vetch always showed the lowest values. The t max was larger for vetch than for the other species in the first season, while in the second season only barley had lower t max than vetch and mustard. In the first season, k G was larger for mustard and vetch than for the grasses, while no differences were observed in the second season.
Gompertz equations (lines) adjusted for the five cover crop species in the two seasons studied until the decay of ground cover (proportion) due to frosts (thermal time around 1000 °C/day in both seasons). Bars show s.e.d.

Estimated parameter values (mean of three replications±s.e.d.) of the Gompertz model adjusted to the ground cover curves of different cover crops in 2011 and 2012. Ground covermax (%): maximum ground cover reached; kG: relative growth rate (°C/day); tmax (°C/day): thermal time until growth rate is maximum

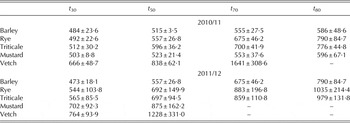
The characteristic t i values were calculated for each crop species at 30, 50 and 70% ground cover (Table 2). Grasses were always earliest to reach the intended value of ground cover, especially barley. The values for mustard were similar to those of grasses in the first season and vetch in most cases presented the highest t i values. In the second season, neither mustard nor vetch attained >70% ground cover. In both seasons, the set of species maintained the same order of achieving t i.
Characteristic ti values (mean of three replications±s.e.d.) obtained from the adjusted Gompertz curve for different cover crops in 2011 and 2012, where ti (°C/day): thermal time until ground cover=i%

Biomass
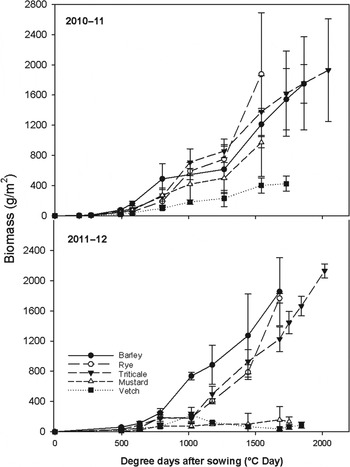
The cover crops showed no significant differences in biomass until 600 °C/day (end of November in both seasons) (Fig. 4). In the second year, after 1200 °C/day (end of February) the grasses showed higher values than vetch and mustard, and barley rapidly accumulated the highest amount of biomass in this season. The mustard showed lower values in the second season compared to the first for both biomass and ground cover, while vetch always had the lowest values.
Biomass accumulation (mean±s.e.d.) of the five cover crop species studied during two consecutive seasons.

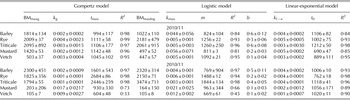
The models fitted well for almost all cover crops in both seasons for the whole growth period (R 2>0·80). Only mustard and vetch in the second season were not properly adjusted to the Gompertz and the logistic model. The estimated values of the different parameters obtained are shown in Table 3. The BMmax values attained by the Gompertz and logistic models differed widely in the cases of mustard (1420 g/m2 for BMmaxg v. 496 g/m2 for BMmaxlog) and barley (1814 g/m2 for BMmaxg v. 1022 g/m2 for BMmaxlog) in the first season and triticale in the second (1793 g/m2 for BMmaxg v. 3474 g/m2 for BMmaxlog), but all crops ranked similarly when comparing both parameter sets. The grasses always reached the highest BMmax values for both Gompertz and logistic models (between 1021 and 3474 g/m2), while vetch had the lowest (446 and 104 g/m2, respectively for the first and second seasons). The mustard values showed a substantial decrease in the second season compared to the first. In the Gompertz model, thermal time to maximum growth rate (t max) only differed in the second season, with rye and triticale attaining the highest values (2684 and 2446 °C/day, respectively) while vetch had the lowest (603 °C/day). The relative growth rate k g did not show any differences among the crops in either season, while k max only showed differences between rye, mustard and vetch in the second season. When adjusted to a linear-exponential model, mustard and rye showed the highest growth rate values in the first season (0·0047 and 0·0046 °C/day, respectively), while triticale and vetch had the lowest (0·0033 °C/day). In the second season, the grasses attained the highest growth rates (0·0037–0·0044 °C/day) while mustard and vetch had the lowest (0·0021 and 0·0011 °C/day, respectively).
Estimated parameters (mean of three replications±s.e.d.) of the Gompertz, logistic and linear-exponential models adjusted to the biomass accumulation of different cover crops in 2011 and 2012. Gompertz model: BMmaxg (g/m2): upper asymptote; kg (°C/day): weighted mean relative growth rate; tmax (°C day): thermal time until maximum growth rate. Logistic model: BMmaxlog (g/m2): upper asymptote; kmax (°C/day): maximum relative growth rate; m (°C/day): thermal time at which 50% of BMmaxlog is reached. Linear-exponential model: b (g/m2): the slope of the linear stretch; kl−e (°C/day)=growth rate; t0 (°C/day)=thermal time from which the model switches to exponential

Nitrogen uptake and Ndfa
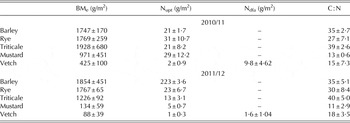
The grasses always showed the highest values of N uptake, >13 g/m2 (Table 4); however, in the first season mustard reached a similar value to the grasses. In the second season, N uptake for mustard decreased substantially compared to the first, as the biomass also decreased. Nitrogen uptake and content was always the lowest in vetch. The Ndfa represented between 0·70 and 0·80 of vetch N content in the above-ground biomass.
Results (mean of three replications±s.e.d.) at the end of the season of the variables measured in the experiment in 2010–2011 and 2011–2012. BMe(%): biomass at the end of the experiment; Nupt: N uptake (g/m2); Ndfa: N derived from the atmosphere (g/m2); C:N: C:N relationship

C : N ratio, dietary fibre content and crop residue quality
The grasses attained higher C : N ratios than mustard and vetch in both seasons (Table 4). The C : N ratios for grasses was between 27 : 1 and 40 : 1, whereas for vetch was between 15 : 1 and 18 : 1. Triticale always reached the highest C : N ratio with values around 40 : 1, while mustard had the lowest, remaining below 13 : 1.
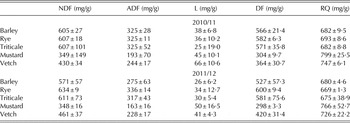
The grasses contained more NDF, between 571 and 634 mg/g of total fibre, than mustard (349 mg/g) in both seasons (Table 5). Vetch also attained a lower value than the grasses during the first season (430 mg/g), while values were not significantly different from triticale (461 and 611 mg/g, respectively) in the second season. The ADF content presented the same pattern as NDF; however, in the second season barley (275 mg/g) was not significantly different from vetch (228 mg/g) and mustard (163 mg/g). Vetch had the highest lignin content (66 mg/g) in the first season, while triticale had the lowest (25 mg/g). In the second season, mustard attained the highest value (50 mg/g) and barley the lowest (26 mg/g). The highest values of dietary fibre content were reached by the grasses in both seasons, ranging between 527 and 600 mg/g. In the second season, the values for vetch were between those of mustard and barley. Mustard always presented the lowest values, about 300 mg/g. Crop residue quality was higher for mustard in both seasons, 766 and 799 mg/g, respectively (Table 5). Values for vetch were between mustard and the grasses, without achieving significant differences compared to barley in the second season. The grasses were always <700 mg/g, and the crop that attained the lowest values was rye (~670 mg/g).
Fibre content and crop residue quality (mean of three replications±s.e.d.) at the end of the experiments in 2010–2011 and 2011–2012. NDF (mg/g): neutral detergent fibre; ADF (mg/g): acid detergent fibre; L (mg/g): lignin; DF(mg/g): dietary fibre; RQ(mg/g): crop residue quality

DISCUSSION
The early coverage of soil under diverse climatic conditions represents one important breeding objective for cover crops (Foley Reference Foley1999). In the present work, the grasses, especially barley, combined this trait with high values of ground cover throughout the whole growth period. The delay in ground coverage that was observed in the second season for vetch in particular, but also in mustard, represents a substantial disadvantage for using these species as cover crops. However, in some cases it may be advantageous to use cover crops with low frost hardiness to reduce the cost of killing, as the plants may die either as a result of winter frost, herbicide application or incorporation into the soil. In addition, cover crops that die off naturally adjust the timing of nutrient release and have less probability of competition with the following crop (Thorup-Kristensen et al. Reference Thorup-Kristensen, Magid and Jensen2003). In the current experiment, the mustard ground cover evolution during the first season followed the characteristic pattern of cover crops that die off from winter frosts.
The Gompertz model traced satisfactorily the ground cover evolution of all the species until the decay of the non-grass crops. The parameters obtained described the early stages and the potential growth of the cover crops. Bodner et al. (Reference Bodner, Himmelbauer, Loiskandl and Kaul2010) reported differences between the parameters obtained for rye, mustard and vetch crops similar to the results reported in the current experiment in the first season. The Ground covermax and t max reached lower values in Bodner et al. (Reference Bodner, Himmelbauer, Loiskandl and Kaul2010) compared to the current work, while the growth rates were higher, probably due to drier and warmer conditions. In agreement with previous studies (Den Hollander et al. Reference Den Hollander, Bastiaans and Kropff2007), a logistic model also fitted successfully the ground cover evolution of the results reported in the current experiment; however, the data are not shown because of the good cover crop characterization provided by the Gompertz model.
The characteristic t i values obtained for the five crops studied might be an important tool for cover crop comparison at both early and late stages. The highest attenuation of runoff and erosion occurs for ground cover values of up to 30% (Francis & Thornes Reference Francis, Thornes and Thornes1990; Chirino et al. Reference Chirino, Bonet, Bellot and Sánchez2006), while increases in ground cover >70% lead to a smaller effect on soil erosion reduction (Quinton et al. Reference Quinton, Edwards and Morgan1997). In the current experiment, the species that reached early ground cover (30%) were also the first to reach ground cover >70%. Thus, the estimation of t 30 might be sufficient for species or cultivar comparison as it determines the performance of the cover crop concerning erosion and runoff.
Cover crops usually grow during periods of the year where conditions are not optimal for crop growth; therefore, their growth is often limited (Thorup-Kristensen et al. Reference Thorup-Kristensen, Magid and Jensen2003). At the end of the first season in the current work, the grasses had reached twice the amount of biomass of mustard and more than four times that of vetch (Table 3). Gabriel & Quemada (Reference Gabriel and Quemada2011) reported comparable differences between barley and vetch cover crops grown in analogous Mediterranean conditions. However, as well as for the ground cover, the low minimum temperatures and precipitation in winter affected dramatically the mustard and vetch growth during the second season. In accordance with Unger & Vigil (Reference Unger and Vigil1998), the lack of reliable precipitation and early winter frosts are important constraints for crop growth in semi-arid regions with continental influence.
The fact that the Gompertz and logistic models are defined by a BMmax parameter make them unsuitable for descriptive analysis of cover crop biomass accumulation, as they usually die before reaching the maximum biomass. The linear-exponential model has the advantage of providing the growth rate k l−e, a parameter that does not require the biomass to reach a maximum and that might provide relevant information for cover crop selection. However, in the present study the results of modelling the biomass did not show clear differences between these parameters for the species analysed. Since changes in biomass and ground cover are related, and the measurement of the latter is easier to perform, a two-way approach is recommended to characterize cover crop growth. On the one hand, monitor the ground cover by non-destructive sampling and adjust mathematical models to the observed data. On the other hand, destructive biomass sampling would be of particular interest before frosts or at harvest. The current work focused on the above-ground growth of cover crops, but a proper characterization should be complemented with root system information.
Biomass at killing date was the most important variable determining mustard N uptake. The high N concentration in mustard agrees with the results of other studies (Chaves et al. Reference Chaves, De Neve, Hofman, Boeckx and Van Cleemput2004; Alcántara et al. Reference Alcántara, Sánchez, Pujadas and Saavedra2009), probably due to fast, deep rooting compared to grasses that allowed the mustard to exploit deeper soil layers (Thorup-Kristensen Reference Thorup-Kristensen2001). In the case of vetch, the low N uptake was not only related to a low biomass accumulation but also to significant N supply attributed to biological fixation (700–800 mg/g of the total N).
The higher C : N ratios of the grasses compared to mustard and vetch are in accordance with those obtained by other authors studying differences between grasses and legumes (Quemada & Cabrera Reference Quemada and Cabrera1995; Gan et al. Reference Gan, Liang, Liu, Wang and McDonald2011), or between grasses and brassicas (Chaves et al. Reference Chaves, De Neve, Hofman, Boeckx and Van Cleemput2004; Gallejones et al. Reference Gallejones, Castellón, del Prado, Unamunzaga and Aizpurua2012).
The higher dietary fibre content of grasses was consistent and relies on the larger NDF content. This is a positive characteristic to be targeted in cover crops that may be used as forage because it entails a higher digestibility for ruminants, and should be combined with the higher protein content observed in legumes (Qiu et al. Reference Qiu, Eastridge and Wang2003).
The crop residue quality gave inverse results for the plant species compared to the dietary fibre content. High residue quality corresponds to easily decomposable residue, characterized by a large labile fraction which is complementary to NDF. Mustard and vetch had higher residue quality and will decompose faster than the grasses in the field. This is in accordance with the literature (Quemada et al. Reference Quemada, Cabrera and McCracken1997; Chaves et al. Reference Chaves, De Neve, Hofman, Boeckx and Van Cleemput2004) and could lead to higher amounts of nutrients available for the next crop.
Cover crops are often grown in mixtures in an attempt to combine the advantages of different species (Tosti et al. Reference Tosti, Benincasa, Farneselli, Pace, Tei, Guiducci and Thorup-Kristiensen2012). However, the extent to which the advantages are actually combined is usually not clear. An analysis based on the variables presented in the current paper could be adapted to study the specific effects of mixing cover crop species on ecological services.
In summary, the traits that determine the suitability of five species (barley, rye, triticale, mustard and vetch) for cover cropping were compared. The quantification of eight variables showed differences in the cover crop growth (ground cover and biomass evolution) and dry matter chemical composition (C : N ratio, N uptake, Ndfa and fibres). The grasses reached maximum coverage growth rates first (means between 482 and 603 °C/day) and also the maximum ground cover (83–99%). Mustard presented different behaviour in the 2 years, according to climatic differences. In warm years it reached very similar values to the grasses (503 °C/day and 83%), but when early frosts occurred it was more in line with vetch (654 °C/day and 56%). The thermal time to reach 30% ground cover was a good indicator for detecting early coverage species. The models adjusted to the biomass were significant (P<0·01) but not suitable for describing biomass accumulation because the cover crops usually die before reaching maximum biomass or the parameters were not sensitive to the differences among species. Therefore, it is recommended that plant breeders and researchers working in cover crop characterization should monitor ground cover by non-destructive measurements during the whole growth cycle and sample the biomass at particular relevant dates. Vetch presented always the lowest N uptake (2·4 and 0·7 g/m2 respectively for each season), not only because it was fixing atmospheric N2 (~800 mg/g of N content) but also because of its low biomass accumulation. Similar N uptake and biomass values were also shown by mustard in the coldest season. The grass residues were expected to decompose more slowly in the field than other cover crop residues, as the C : N values were the highest (27 : 1–39 : 1) and the residue quality the lowest (669–693 mg/g). The grasses contained the highest amounts of dietary fibre (527–600 mg/g).
The characterization of these species allowed estimation of their suitability to provide ecosystem services. A cover crop optimized for erosion control should present rapid and high level of ground cover, and leave slowly decomposable residues remaining in the field (high C : N ratio and low residue quality). The grasses, especially barley, showed these characteristics. If the aim is to control nitrate leaching, the catch crop requires high biomass accumulation (BMmax) and N uptake. The grasses met these conditions in both years and mustard only in warmer years, when not killed by winter frosts. Vetch was more suitable for green manure because it provides the system with N through biological fixation (Ndfa) and the residues were easily decomposable (low C : N ratio and high residue quality). The optimal forage requires high dietary fibre (high NDF and low lignin content), and grasses would be the best choice in this case. Therefore, cover crop management and selection should rely on identification and quantification of variables that allow comparing their potential to provide ecological services in a particular agrosystem.
Financial support by the Spanish Commission of Science and Technology (CICYT; reference AGL2011-24732) and by Comunidad de Madrid (AGRISOST, S2009/AGR-1630).