Implications
Linseed plus nitrate supplemented to dairy cows persistently reduced methane emission for up to 4 months without affecting diet apparent digestibility and animal health. Intake and milk production tended to be lower for cows fed linseed plus nitrate compared with cows fed control diet, but feed efficiency was similar between diets. Nitrate and nitrite were not detected in milk and processed milk products, suggesting that milk from cows fed nitrate is safe for human consumption. These results show that linseed plus nitrate is a viable long-term methane-mitigating feeding strategy for dairy cows.
Introduction
Linseed and nitrate are both proven dietary treatments for reducing enteric methane (CH4) emission in ruminants (Doreau et al., Reference Doreau, Bamière, Pellerin, Lherm and Benoit2014) and their combination as a CH4-mitigating strategy appears promising. In a short-term experiment on non-lactating cows, linseed oil (4% of dry matter; DM) plus nitrate (2.25% of DM) reduced methanogenesis by 32% without affecting apparent diet digestibility (Guyader et al., Reference Guyader, Silberberg, Popova, Seradj, Morgavi and Martin2015). Compared to linseed oil and nitrate fed individually, the effect of this combination on CH4 production was additive because these two strategies share different modes of action in the rumen: polyunsaturated lipids from linseed are thought to act as inhibitors of H2 producers such as protozoa, whereas nitrate is thought to act as a H2 sink, competing with methanogenesis. Nitrate and nitrite are also toxic to methanogens (Guyader et al., Reference Guyader, Eugène, Meunier, Doreau, Morgavi, Silberberg, Rochette, Gérard, Loncke and Martin2014).
Before practical application at the farm scale, the long-term effect of dietary linseed plus nitrate on CH4 emission in dairy cows requires further investigation. Another issue to evaluate is the potential adverse effects of nitrate supplementation on human and animal health. To our knowledge, the effect of dietary nitrate on milk quality, including the absence of nitrate and nitrite residuals in milk, has never been tested, whereas excess nitrite from nitrate reduction in the mouth may promote gastric irritation in humans (Weitzberg and Lundberg, Reference Weitzberg and Lundberg2013). Nitrate may also alter animal health by increasing the concentration of blood methemoglobin (metHb; Lewis, Reference Lewis1951). Without adaptation, nitrite from nitrate reduction can accumulate in the rumen, passing through the blood and leading to subclinical methemoglobinemia (30% to 40% of metHb; Lee and Beauchemin, Reference Lee, Araujo, Koenig and Beauchemin2014).
The main objective of this experiment was to investigate the long-term effect of linseed plus nitrate on CH4 emission and lactating performance in dairy cows. As a secondary objective, nitrate metabolism was assessed by measuring metHb levels in blood and nitrate and nitrite levels in milk and processed milk products. We also evaluated the effect of linseed plus nitrate on total tract apparent digestibility, nitrogen (N) balance and rumen fermentation parameters.
Material and methods
The experiment was conducted at the dairy cows’ experimental facilities at the INRA’s Saint-Genès-Champanelle research centre in France from January to May 2014. All procedures involving animals were performed in accordance with French Ministry of Agriculture and European guidelines and regulations for animal research and experimentation.
Animals, diets and feeding
A total of 16 lactating (including seven primiparous) Holstein cows accustomed to handling were used. At the start of the experiment, cows were 61±23 days in milk, with an average milk yield of 33.4±7.1 kg/day and BW of 706±67 kg. The experiment was conducted for 17 weeks as a randomised block design where cows were separated into two groups balanced for calving date and milk production. Cows were housed in a free stall barn in which they had an individual trough accessed via an electronic tag. Cows were adapted for 4 days to a tie stall barn before the start of the two measurement periods (week 5 and weeks 16 to 17) that required tying cows.
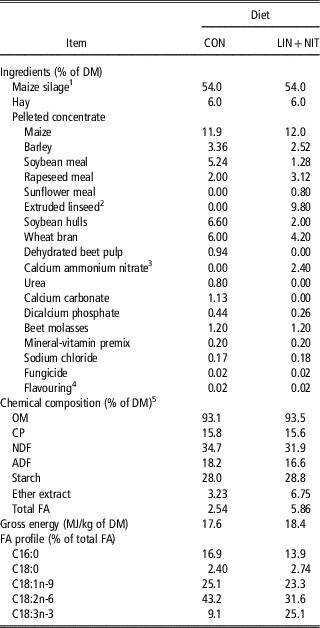
The first group of cows (n=8 of which four primiparous) was fed the control diet (CON), and the second group of cows (n=8 of which three primiparous) was fed CON with 9.8% extruded linseed and 2.4% calcium ammonium nitrate (75% nitrate in DM) on a DM basis (LIN+NIT). The doses of extruded linseed and nitrate were estimated to reduce CH4 emission by 10% to 15% when fed alone (Doreau et al., Reference Doreau, Bamière, Pellerin, Lherm and Benoit2014) and by 20% to 30% when fed together. Diets were formulated to meet the requirements of lactating dairy cows (30 kg daily milk production without BW change) and to be equivalent in terms of CP, gross energy (GE) and starch proportions (INRA, 2010; Table 1). On a DM basis, diets were composed of 54% maize silage, 6% natural grassland hay and 40% concentrate given as pellets (InVivo NSA, Longué Jumelles, France).
Ingredients and chemical composition of the experimental diets

CON=diet control; LIN+NIT=diet control containing 10% extruded linseed and 1.8% nitrate on a DM basis; DM=dry matter; OM=organic matter; FA=fatty acid.
1 Fermentation characteristics of fresh silage juice: pH=3.57; acetic acid=0.74 g/100 g; lactic acid=3.01 g/100 g; N-NH3=0.02 g/100 g.
2 Extruded linseed (InVivo NSA, Longué Jumelles, France).
3 Calcium ammonium nitrate (5Ca(NO3)2.NH4NO3.10H2O; Phytosem, Pont-du-Château, France) contained 75% nitrate on a DM basis.
4 Gusti, Nutriad, Chester, England.
5 Average chemical composition from samples (n=3) taken in weeks 5, 16 and 17.
Two weeks before starting the experiment, all cows were fed CON diet ad libitum. Then, animals fed LIN+NIT were progressively adapted by replacing CON concentrate with LIN+NIT concentrate over a 2-week period to achieve the dose of 2.4% calcium ammonium nitrate at the beginning of week 3. Hay was offered once daily (0800 h) and before other feeds to ensure ingestion of fibre and prevent ruminal acidosis. Maize silage mixed with concentrates was offered twice daily (66% at 0930 h and 34% at 1600 h). All cows were fed ad libitum except during measurement weeks in which feed offered was restricted to 95% of individual voluntary feed intake to ensure complete consumption of the diet. Forage-to-concentrate ratio was kept as close as possible to the target ratio by adjusting the amounts of feed offered every week based on quantity and composition of the refusals of the previous week. Cows had free access to water throughout the experiment.
Measurements and analyses
Liveweight and blood metHb
Animals were weighed the week before starting the experiment (week 0) then in weeks 5, 10, 14 and 20. Blood metHb levels were measured 3.5 h after morning feeding on cows fed LIN+NIT and compared with levels of control samples taken on these same animals in week 0. Blood was then sampled twice a week from week 1 to 3 (adaptation to nitrate) and once a week from week 4 to the end of the experiment (week 17). Blood (10 ml) was sampled from the tail vein into K2-EDTA collection tubes and stored on ice (Venosafe; Terumo, Guyancourt, France) until measurement of metHb concentrations by spectrophotometry (UV-160; Shimadzu, Marne-La-Vallée, France; Kaplan, Reference Kaplan1965) within 1 h (CHU Gabriel Montpied, Clermont-Ferrand, France).
Intake
Offered feed and refusals were weighed and recorded daily throughout the experiment. During the two measurement periods (week 5 and weeks 16 to 17), samples (200 g) of hay and concentrates were taken once a week, and samples (200 g) of maize silage were taken twice a week. For each feed and refusals sample, one aliquot was used to determine DM content (103°C for 24 h) and the other aliquot was stored at 4°C (hay and concentrates) or −20°C (maize silage) until further analyses. Chemical composition analyses (ash, N, NDF, ADF, starch, GE, ether extract and fatty acid) were carried out on fresh (hay, concentrates) or freeze-dried (maize silage) samples after grinding (1 mm) (InVivo Labs, Chierry, France) and as previously described (Guyader et al., Reference Guyader, Silberberg, Popova, Seradj, Morgavi and Martin2015). Juice from fresh maize silage was obtained by maceration to analyse pH, ammonia (N-NH3; Kjeldahl method 2001.11; AOAC, 2005), acetic and lactic acid (gas chromatography with a flame ionization detector) concentrations (InVivo Labs).
Methane emission
Daily enteric CH4 emission of each animal was continuously measured for 2 consecutive days using open circuit respiration chambers (one animal per chamber) after 5 and 16 weeks of distribution of dietary treatments (Guyader et al., Reference Guyader, Silberberg, Popova, Seradj, Morgavi and Martin2015). During measurement periods, chamber rear doors were opened in the morning for milking and to remove faeces and urine, and in the afternoon for milking. Chamber front doors were opened three times a day for feeding. In total, the doors of each chamber were opened for 30 min/24 h. Data collected while doors were open were deleted. To recover 24-h CH4 emission, missing data were estimated as being similar to the last measurement data before chamber disturbance. Real-time gas emissions in a chamber were calculated by the difference between chamber and ambient gas concentrations multiplied by the airflow corrected for temperature, relative humidity and pressure (Pinares-Patiño et al., Reference Pinares-Patiño, Hunt, Martin, West, Lovejoy and Waghorn2012).
Diet apparent digestibility and N balance
Total tract apparent digestibility and N balance were determined from total and separate collection of faeces and urine for 5 days during week 17 (Guyader et al., Reference Guyader, Silberberg, Popova, Seradj, Morgavi and Martin2015). At the end of week 16, cows were moved from CH4 chambers to individual digestibility crates to give animals a 3-day adaptation period to new housing conditions before the first collection. To separate urine from faeces, cows were fitted with a urine collection device connected by a flexible tube to a 30-l flask containing 500 ml of 3 M sulphuric acid to keep a urine pH lower than 3 and thereby avoid N volatilisation. Faeces and urine were removed once daily. Every day, after weighing and mixing of faeces, a 1% fresh aliquot was used to determine DM (103°C for 24 h), and another 1% fresh aliquot was pooled across days for each animal and frozen (−20°C). At the end of the experiment, pooled samples were thawed, freeze-dried and ground (1 mm) to determine organic matter (OM), N, NDF and ADF content as for feed (InVivo Labs). For urine, every day after weighing, a 1% fresh aliquot was pooled across days for each animal and frozen (−20°C). At the end of the experiment, after thawing, the N concentration of faeces and urine was, respectively, determined by the Dumas (method 968.06; AOAC, 2005) and the Kjeldahl (method 2001.11; AOAC, 2005) methods (InVivo Labs), as the Dumas analyser was not adapted to handle liquid samples. The Kjeldahl method does not take into account N-nitrate, but it was assumed that the influence of N-nitrate in urine on the overall N balance was minimal: Lee et al. (Reference Lee and Beauchemin2015) reported that beef heifers fed 2% nitrate lost 0.17 g/day of N-nitrate in urine (0.39% of total N excretion in urine). Therefore, the use of the Kjeldahl method did not mask the potential effect of treatments on N balance.
Milk yield and composition
Throughout the experiment, milk yield was determined daily. For determination of milk composition (fat, protein, lactose and urea concentration), individual milk samples (30 ml) mixed with potassium bichromate (Merck, Fontenay-Sous-Bois, France) were taken and stored at 4°C before analysis within 2 days (Galilait, Theix, France). Samples were taken at morning and afternoon milking 2 days/week when animals were in the CH4 chambers (weeks 5 and 16). Milk fat, protein and lactose concentrations were analysed by IR spectrometry with a 3-channel spectrophotometer (MilkoScan; Foss Electric, Hillerod, Denmark; method 972.16; AOAC, 2005). Milk urea concentration was analysed by the dimethylamino-4-benzaldehyde colorimetric method (Potts, Reference Potts1967). From data collected in weeks 5 and 16, milk production was converted to fat- and protein-corrected milk (FPCM, kg/day) with 4.0% fat and 3.3% protein (Gerber et al., Reference Gerber, Vellinga, Opio and Steinfeld2011) and feed efficiency was calculated as the ratio between FPCM and dry matter intake (DMI).
For analysis of nitrate and nitrite residuals in individual milk, samples (300 ml) from the morning milking were taken once a week in weeks 5, 9, 13 and 17. For analysis of nitrate and nitrite residuals in pooled milk and milk products, the morning milk of all animals was pooled by diet in weeks 9 and 17. Pooled milk was sampled (100 ml) and local farmhouse-style products were made (yoghurts, whey, curd and 6-week ripened Saint-Nectaire cheese). All samples were stored at 4°C before analysis within 2 days (Eurofins Analytics, Nantes, France). Nitrate and nitrite residuals in individual milk samples were analysed by ion chromatography (method 993.30; AOAC, 2005) with a limit of quantification of 10 mg/kg for nitrate and 5 mg/kg for nitrite. In pooled milk samples and processed milk products, nitrate and nitrite residuals were analysed by spectrometry after nitrate reduction with cadmium (ISO 14673; ISO, 2004) with a limit of quantification of 5 mg/kg for nitrate and 0.5 mg/kg for nitrite.
Rumen fermentation parameters
On the last day of week 17, rumen samples were collected 3.5 h after the morning feeding by stomach tubing (Shen et al., Reference Shen, Chai, Song, Liu and Wu2012). Samples were strained through a polyester monofilament fabric (250 μm pore size) and the filtrate was subsampled for volatile fatty acids (VFA; 0.8 ml of filtrate in 0.5 ml of a 0.5 M HCl solution containing 2% (w/v) metaphosphoric acid and 0.4% (w/v) crotonic acid) and NH3 (1 ml of filtrate in 0.1 ml of 5% orthophosphoric acid) concentration analyses. These samples were stored at −20°C until analysis. For protozoa counting, 2 ml of filtrate was mixed with 2 ml of methyl green-formalin saline solution, and stored at room temperature in the dark until counting.
Concentrations of VFA and NH3 were analysed by gas chromatography with a flame ionization detector and colorimetry, respectively (Morgavi et al., Reference Morgavi, Jouany and Martin2008). Protozoa were counted by microscopy and data were log10-transformed before statistical analyses.
Statistical analyses
Data were analysed using the MIXED procedure of SAS (Version 9.4; SAS Institute, 2009). All statistical models included the animal nested within diet as random effect. Data collected throughout the experiment (intake, milk production and composition) or on two occasions (CH4 emission) were averaged per individual cow and per week as there was no statistical difference between days within a week. The statistical model included diet (n=2), week (n=17 for intake and milk and n=2 for CH4) and diet×week interaction as fixed effects. Week was treated as a repeated measurement. For intake, milk production and composition (except for urea), data collected in week 0 were used as covariates, as these parameters were different between groups at the start of the experiment. For continuous measures of CH4 emission, the model included diet (n=2), week (n=2), hour (n=24), diet×week and diet×hour interactions as fixed effects. Hour was treated as a repeated measurement. As the interaction diet×week was not statistically significant, averaged data of the 2 weeks are presented in the last figure. For the repeated measurements, several covariance structures were tested (variance component, autoregressive, compound symmetry, unstructured and toeplitz) and structure with the lowest Akaike’s information criteria was chosen. Then, variance component was always used as covariance structure, except for daily CH4 emission where compound symmetry was used. Data collected at the end of the experiment (apparent digestibility, N balance, rumen fermentation and microbial parameters) were analysed with diet (n=2) as fixed factor. Differences between diets were considered significant at P⩽0.05, and trends were discussed at 0.05<P⩽0.1. Least squares means are reported throughout.
Results
Liveweight and blood metHb
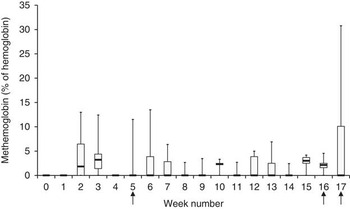
During the 17-week experiment, cows fed CON or LIN+NIT lost on average 32 and 22 kg BW to reach a final BW of 697±62 and 662±67 kg, respectively. During the 3-week period of adaptation to nitrate, the maximum metHb level was 13.0% (Figure 1). From week 4 to 17, average metHb level was 1.2%. Maximum metHb level peaked at 30.8% for one cow in week 17, whereas average metHb level for all other cows in that week averaged 4.4%.
Boxplot of blood methemoglobin levels of lactating cows fed 10% extruded linseed plus 1.8% nitrate (n=8) during 17 weeks. In week 0, animals were fed a control diet. Linseed and nitrate were first incorporated in week 1. Blood was analysed in week 0 and then twice a week during weeks 1, 2 and 3 and once a week from weeks 4 to 17. The box represents the quartiles with the median within the box, and the vertical lines represent the maximum and minimum value, respectively. Arrows indicate measurement weeks.

Intake and milk yield
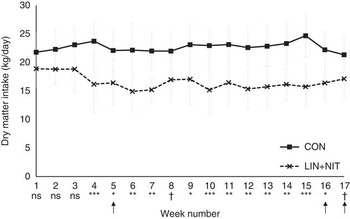
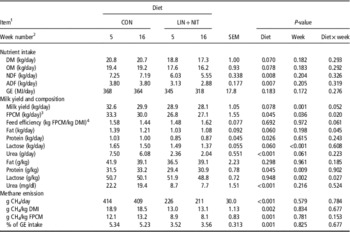
Daily DMI was similar between diets in weeks 1, 2, 3 and 17 and tended to be lower with LIN+NIT from week 4 to 16 (−5.1 kg/day on average; P⩽0.10; Figure 2). This tendency between diets was also observed for DM and OM intake (P=0.070 and P=0.078, respectively) when cows were in chambers (Table 2). Fibre intakes were lower with LIN+NIT (P=0.008 for NDF and P=0.007 for ADF) whereas dietary treatments did not affect GE intake.
Dry matter intake of lactating cows fed a control diet (CON; n=8) or CON supplemented with 10% extruded linseed plus 1.8% nitrate (LIN+NIT; n=8) during 17 weeks (averages of 4 days/week). Error bars indicate SD. Symbols indicate weekly statistical comparison between CON and LIN+NIT (†P⩽0.10; *P⩽0.05; **P⩽0.01; ***P⩽0.001). Arrows indicate measurement weeks.

Daily nutrient intake, milk yield and composition, and methane emission of lactating cows fed a control diet (n=8) or a diet supplemented with a combination of linseed and nitrate (n=8)

CON=diet control; LIN+NIT=diet control containing 10% extruded linseed and 1.8% nitrate on a DM basis; DM=dry matter; OM=organic matter; GE=gross energy; FPCM=fat- and protein-corrected milk; DMI=dry matter intake.
1 Average of 2 days in chambers in weeks 5 and 16. For intake, milk yield and composition, a covariate (data obtained in week 0) was included in the statistical model.
2 Number of weeks of distribution of dietary treatment.
3 FPCM=milk yield (kg/day)×[0.337+0.116× fat (%)+0.06× protein (%)] (Gerber et al., Reference Gerber, Vellinga, Opio and Steinfeld2011).
4 Feed efficiency=FPCM/DMI.
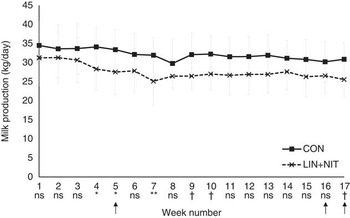
We found no difference between diets in milk production over two-thirds of the experiment (11 weeks out of 17), whereas in weeks 4, 5, 7, 9, 10 and 17, milk production was lower with LIN+NIT (−2.5 kg/day on average; P<0.05; Figure 3). In chambers, cows fed LIN+NIT produced less milk (−2.8 kg milk/day on average, P=0.078; −4.7 kg FPCM/day on average, P=0.045; Table 2). Feed efficiency was similar between diets in week 5 and tended to be higher for LIN+NIT in week 16 (diet×week, P=0.061).
Milk yield of lactating cows fed a control diet (CON; n=8) or CON supplemented with 10% extruded linseed plus 1.8% nitrate (LIN+NIT; n=8) during 17 weeks (averages of 4 days/week). Error bars indicate SD. Symbols indicate weekly statistical comparison between CON and LIN+NIT (†P⩽0.10; *P⩽0.05; **P⩽0.01; ***P⩽0.001). Arrows indicate measurement weeks.

In chambers, milk fat and lactose concentrations were similar between diets, whereas LIN+NIT reduced milk protein (P=0.045) and urea (P<0.001) concentrations by 6.8% and 60.6%, respectively. For both diets, nitrate and nitrite concentrations in individual milk samples, pooled milk samples and milk products were lower than the limit of quantification, except for curd from CON in week 17 and cheese from CON and LIN+NIT in week 9 in which low nitrite concentrations were detected (1.5 mg/kg).
Methane emission
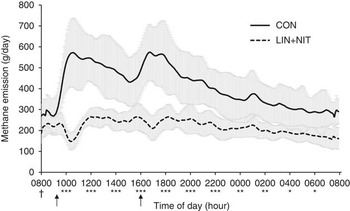
Diet LIN+NIT decreased daily CH4 emission by 47% (g/day; P<0.001), 30% (g/kg DMI; P=0.002) and 33% (g/kg FPCM; P=0.001) on average for weeks 5 and 16, without significant effect of week or diet×week interaction (Table 2). This shows that CH4 emissions after 5 and 16 weeks were similar for cows fed CON and also for cows fed LIN+NIT. Except for a 2-h period before morning feeding, LIN+NIT decreased CH4 emission all along the day (P⩽0.05; Figure 4).
Daily CH4 production pattern of lactating cows fed a control diet (CON; n=8) or CON supplemented with 10% extruded linseed plus 1.8% nitrate (LIN+NIT; n=8) during 17 weeks (averages of 2 days and 2 weeks of CH4 measurement; weeks 5 and 16). Error bars indicate SD. Symbols indicate hourly statistical comparison between CON and LIN+NIT (†P⩽0.10; *P⩽0.05; **P⩽0.01; ***P⩽0.001). Arrows indicate feeding time.

Diet apparent digestibility and N balance
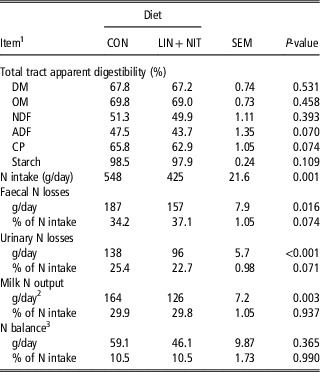
Apparent digestibility of DM, OM and NDF was similar between diets, and averaged 67.5%, 69.4%, and 50.6%, respectively (Table 3). The LIN+NIT diet tended to reduce ADF (−3.8%; P=0.070) and CP (−2.9%; P=0.074) apparent digestibility. N intake was 22% lower with LIN+NIT (P=0.001). Consequently, LIN+NIT led to lower faecal N losses, urinary N losses and N retained in milk (P=0.016, P<0.001 and P=0.003, respectively). However, N distribution was unaffected by diet. On average for both diets, 35.7% (P=0.074), 24.1% (P=0.071) and 29.9% (P=0.937) of N intake was directed towards faeces, urine and milk, respectively. Finally, N balance was positive and similar between diets and averaged 52.6 g/day or 10.5% of N intake.
Total tract apparent digestibility and nitrogen balance of lactating cows after 17 weeks feeding a control diet (n=8) or a diet supplemented with a combination of linseed and nitrate (n=8)

CON=diet control; LIN+NIT=diet CON containing 10% extruded linseed and 1.8% nitrate on a DM basis; DM=dry matter; OM=organic matter; N=nitrogen.
1 Average of 5 days of total tract apparent digestibility and N balance measurement in week 17.
2 Milk N output=(milk yield×milk protein concentration)/average N concentration in milk (6.38 g N/g milk protein).
3 N balance=N intake−faecal and urinary N losses−milk N output.
Rumen fermentation and microbial parameters
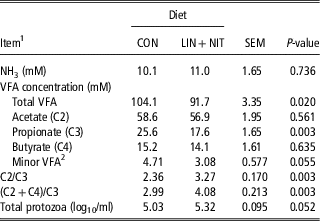
Concentration of NH3 in the rumen did not change with diets (Table 4). Diet LIN+NIT reduced total VFA (−12 mM; P=0.020) and propionate concentrations (−8 mM; P=0.003) without affecting acetate and butyrate concentrations. These differences in VFA profile induced an increase in C2/C3 and (C2+C4)/C3 ratios (P=0.003) with LIN+NIT. Total concentration of protozoa in the rumen tended to increase with LIN+NIT (+53%; P=0.052).
Fermentation parameters and protozoa concentration in the rumen of lactating cows after 17 weeks feeding a control diet (n=8) or a diet supplemented with a combination of linseed and nitrate (n=8)

CON=diet control; LIN+NIT=diet CON containing 10% extruded linseed and 1.8% nitrate on a DM basis; VFA=volatile fatty acid.
1 Data from rumen samples taken the last day of week 17.
2 Minor VFA=sum of isobutyrate, isovalerate, valerate and caproate.
Discussion
Intake, milk production and N balance
Throughout the experiment, intake and milk production tended to be lower for dairy cows supplemented with LIN+NIT. As feed efficiency (kilograms of FPCM per kilograms of feed) was similar between diets, the lower intake may explain the lower milk production. The lower intake with LIN+NIT is difficult to explain because diets had similar net energy content. Individual nitrate supplementation at higher doses than here (1.8%) did not reduce intake of restricted-fed dairy cows (2.1%, Van Zijderveld et al., Reference Van Zijderveld, Gerrits, Apajalahti, Newbold, Dijkstra, Leng and Perdok2011b; 2.0%, Veneman et al., Reference Veneman, Muetzel, Hart, Faulkner, Moorby, Molano, Perdok, Newbold and Newbold2014), but tended to reduce DMI of dairy cows (2.0%, Veneman et al., Reference Veneman, Muetzel, Hart, Faulkner, Moorby, Molano, Perdok, Newbold and Newbold2014) and steers (2.3%, Hulshof et al., Reference Hulshof, Berndt, Gerrits, Dijkstra, Van Zijderveld, Newbold and Perdok2012) fed ad libitum. Linseed applied at doses higher than here (3.5% added fat) did not have a negative effect on the intake or milk production of dairy cows (5.1% added fat, Ferlay et al., Reference Ferlay, Doreau, Martin and Chilliard2013; 4% added fat, Veneman et al., Reference Veneman, Muetzel, Hart, Faulkner, Moorby, Molano, Perdok, Newbold and Newbold2014) fed ad libitum or restricted. One study reported a lower DMI (−7%) by lactating cows fed a grass silage-based diet supplemented with linseed (3% added fat, Martin et al., Reference Martin, Pomiès, Ferlay, Rochette, Martin, Chilliard, Morgavi and Doreau2011). The only study that simultaneously used linseed plus nitrate (4% added fat plus 2.3% nitrate) on cows did not result in intake changes, but the cows were non-lactating and restricted-fed (Guyader et al., Reference Guyader, Silberberg, Popova, Seradj, Morgavi and Martin2015). We hypothesise that LIN+NIT fed together ad libitum may have an inhibitory effect on voluntary intake linked to a tendency for lower ADF digestibility. Allen (Reference Allen1996) highlighted the negative correlation between fibre digestibility and voluntary intake through a lower passage rate of particles from the rumen and greater rumen filling.
The LIN+NIT diet had no effect on concentration and production of fat and lactose in milk. This result confirms previous experiments with dairy cows supplemented with nitrate (2.1%, Van Zijderveld et al., Reference Van Zijderveld, Gerrits, Apajalahti, Newbold, Dijkstra, Leng and Perdok2011b) or extruded linseed (up to 5.1% added fat, Ferlay et al., Reference Ferlay, Doreau, Martin and Chilliard2013). The LIN+NIT diet reduced milk protein concentration and production by 7% and 15%, respectively. In dairy cows fed 2.1% nitrate, Van Zijderveld et al. (Reference Van Zijderveld, Gerrits, Apajalahti, Newbold, Dijkstra, Leng and Perdok2011b) also reported reduced milk protein concentrations (−5%) but no effect on milk protein production whereas milk yield was stable. The reduced milk protein concentration may not be linked to linseed supplementation, as it was not affected by 3.5% added fat from extruded linseed in hay- or maize silage-based diets (Ferlay et al., Reference Ferlay, Doreau, Martin and Chilliard2013).
N balance was positive and similar between diets with the same N distribution between milk, faeces and urine. In addition, average N efficiency (N in milk/N intake) was similar between CON and LIN+NIT (30%) and close to the data given in the literature (25%, with a range between 15% and 40%, Calsamiglia et al., Reference Calsamiglia, Ferret, Reynolds, Kristensen and van Vuuren2010). This result shows that dairy cows use nitrate in the same way as they use other N sources. The marked decrease in milk urea from cows fed LIN+NIT was surprising and in contradiction with previous experiments on dairy cows fed extruded linseed (1.1% added fat, Pezzi et al., Reference Pezzi, Giammarco, Vignola and Brogna2007) or nitrate (2.1% nitrate, Van Zijderveld et al., Reference Van Zijderveld, Gerrits, Apajalahti, Newbold, Dijkstra, Leng and Perdok2011b). We assume that this difference comes from the lower N intake of animals fed LIN+NIT, as N intake is known to correlate positively with milk urea (Spek et al., Reference Spek, Dijkstra, van Duinkerken and Bannink2013).
The main concern when using nitrate in animal nutrition is its potential negative effect on animal and human health. To avoid increase of blood metHb in animals, progressive adaptation to nitrate is essential (Lee and Beauchemin, Reference Lee, Araujo, Koenig and Beauchemin2014). In this study, we did not observe rises in metHb levels in animals fed LIN+NIT, similarly to a previous experiment on dairy cows fed 2.1% nitrate (Van Zijderveld et al., Reference Van Zijderveld, Gerrits, Apajalahti, Newbold, Dijkstra, Leng and Perdok2011b). However, we cannot explain the greater metHb level observed in the last week of the experiment. Analyses were carried out by an external lab and could not be repeated as metHb needs to be analysed quickly after sampling. In terms of human health, nitrate and nitrite are common food additives used for their anti-bacterial properties against lethal pathogens (European Food Safety Authority, 2009). However, excessive consumption of nitrate from several food sources may promote gastric inflammation linked to the production of nitrite from nitrate reduction in the mouth (Weitzberg and Lundberg, Reference Weitzberg and Lundberg2013). Regulations have been adopted to keep concentrations of nitrate and nitrite residuals within recommended daily allowances for nitrate and nitrite intake (3.75 and 0.13 mg/kg BW per day, respectively; European Food Safety Authority, 2009), and Europe has limited nitrate concentration in drinking water (50 mg/l, Benjamin, Reference Benjamin2000). Here, nitrate and nitrite residuals in milk products were lower than the limit of quantification of the technique (5 mg/kg for nitrate and 0.5 mg/kg for nitrite), except in cheese from CON and LIN+NIT (1.5 mg/kg nitrite). These novel data confirm previous work on lamb meat (El-Zaiat et al., Reference El-Zaiat, Patiño, Soltan, Morsy, Araujo, Louvandini and Abdalla2013), and show that animals can metabolise nitrate and nitrite without transferring residuals into animal products. Consequently, long-term supplementation with nitrate (4 months) can be safely proposed in ruminant nutrition without risks for human health and as a source of non-protein N.
Methane emission and associated digestive mechanisms
Methane emission (% of GE intake) observed in cows fed CON was low compared to the literature for dairy cows fed similar diets. Nonetheless, methanogenesis was decreased by 30% (g/kg DMI) when dairy cows were supplemented with 1.8% nitrate plus 3.5% added fat from extruded linseed, corresponding to our expected theoretical CH4 reduction. This confirms our previous results (32%) obtained on non-lactating cows fed a hay-based diet supplemented with 2.2% nitrate plus 4% added fat from linseed oil (Guyader et al., Reference Guyader, Silberberg, Popova, Seradj, Morgavi and Martin2015) and shows that LIN+NIT can efficiently reduce CH4 emission under various physiological animal conditions and for different diets. However, LIN+NIT may fail to reduce methanogenesis under some specific conditions. Indeed, nitrate (2.2%) did not reduce CH4 emissions in finishing beef cattle fed a high concentrate-based diet as these animals were already low CH4-emitters (Troy et al., Reference Troy, Duthie, Hyslop, Roehe, Ross, Wallace, Waterhouse and Rooke2015). The CH4-mitigating effect of linseed was also not observed in studies in which the level of FA in diets was low (1% to 2% of DM; Livingstone et al., Reference Livingstone, Humphries, Kirton, Kliem, Givens and Reynolds2015) or not different from their control diet, which contained a rumen inert fat source (Van Zijderveld et al., 2011Reference Van Zijderveld, Dijkstra, Perdok, Newbold and Gerritsa; Veneman et al., Reference Veneman, Muetzel, Hart, Faulkner, Moorby, Molano, Perdok, Newbold and Newbold2014).
We observed a severe CH4-mitigating effect of LIN+NIT just after feeding, which was most probably linked to the effect of quickly metabolised nitrate in the rumen. This result agrees with Van Zijderveld et al. (Reference Van Zijderveld, Gerrits, Dijkstra, Newbold, Hulshof and Perdok2010) and Guyader et al. (Reference Guyader, Silberberg, Popova, Seradj, Morgavi and Martin2015). Methane reduction with LIN+NIT corresponds to a saving of 1.8% of GE intake, without positive responses on apparent digestibility, BW gain or condition score (data not shown). The absence of relationship between CH4 reductions and dairy cows performance has also been reported previously (Van Zijderveld et al., Reference Van Zijderveld, Gerrits, Apajalahti, Newbold, Dijkstra, Leng and Perdok2011b).
The CH4-mitigating effect of LIN+NIT was maintained throughout the 4 months of the experiment, indicating that this dietary strategy could be applied on farms. The long-term CH4-mitigating effect of nitrate (2.1%) and extruded linseed (up to 3% added fat) fed individually to dairy cows was also maintained during 3 months (Van Zijderveld et al., Reference Van Zijderveld, Gerrits, Apajalahti, Newbold, Dijkstra, Leng and Perdok2011b) and 1 year (Martin et al., Reference Martin, Pomiès, Ferlay, Rochette, Martin, Chilliard, Morgavi and Doreau2011), respectively.
The LIN+NIT diet did not change rumen protozoa concentration as previously observed with non-lactating cows (Guyader et al., Reference Guyader, Silberberg, Popova, Seradj, Morgavi and Martin2015). Diet LIN+NIT increased the acetate/propionate and (acetate+butyrate)/propionate ratios due to a decrease in ruminal propionate, which is normally a competitive pathway of methanogenesis. This contrasts with our previous work in which LIN+NIT did not change rumen fermentation parameters (Guyader et al., Reference Guyader, Silberberg, Popova, Seradj, Morgavi and Martin2015). However, in the present work, the relationship between CH4 production and rumen fermentation and microbial parameters should be interpreted with caution given the large differences in time scale between CH4 measurement periods and rumen samplings through stomach tubing. Consequently, the CH4-mitigating effect of LIN+NIT would not be explained by a reduction in acetate and butyrate synthesis, or by a reduction in number of protozoa, which are important H2 producers. Instead, both supplements may act as H2 sinks. Based on stoichiometric calculation and assuming complete reduction of nitrate to nitrite and ammonia, and complete biohydrogenation of polyunsaturated fatty acids, 325.8 g/day of nitrate and 600.9 g/day of fatty acid (23%, 32% and 25% of C18:1, C18:2 and C18:3, respectively) ingested by dairy cows could have reduced CH4 by 90.1 and 14.9 g/day, respectively. In total, H2 consumption by LIN+NIT could have reduced CH4 emission by 105.0 g/day, explaining 54% of the observed CH4 reduction. The remaining decrease must therefore be explained by non-stoichiometric processes as LIN+NIT may also act on rumen microbiota: nitrate reduced both quantity (2.6% nitrate to sheep, Van Zijderveld et al., Reference Van Zijderveld, Gerrits, Dijkstra, Newbold, Hulshof and Perdok2010) and activity (2.3% nitrate to non-lactating cows, Guyader et al., Reference Guyader, Eugène, Meunier, Doreau, Morgavi, Silberberg, Rochette, Gérard, Loncke and Martin2014) of methanogens. The anti-methanogenic effect of polyunsaturated fatty acids from linseed has also been demonstrated in cattle (2.6% added fat from linseed oil, Guyader et al., Reference Guyader, Eugène, Meunier, Doreau, Morgavi, Silberberg, Rochette, Gérard, Loncke and Martin2014; 3.5% added fat from extruded linseed, C. Martin, unpublished results). In addition, H2 production must have been lowered with LIN+NIT owing to a lower quantity of fermentable substrates in the rumen (lower DMI, quantity of carbohydrates due to lipids substitution and fibre digestibility), which directly reduced CH4 emission.
Linseed plus nitrate is an efficient feeding strategy to reduce CH4 emission in the long-term without altering diet apparent digestibility, N efficiency or animal health. However, to make this dietary strategy acceptable by farmers, further work is required to optimise the doses of linseed plus nitrate in an effort to avoid concomitant reduction in intake and milk production. Additional data is needed on changes in rumen microbiota in order to fully understand the CH4-mitigating effect of the association of linseed plus nitrate. A life cycle assessment will also be needed to evaluate the environmental benefit and economic cost of this dietary strategy in order to raise the prospects of using this strategy at farm level.
Acknowledgements
J. Guyader is the recipient of an INRA-Région Auvergne PhD scholarship. The authors thank L. Genestoux for laboratory analysis and transport of blood samples, and L. Mouly, D. Roux, S. Rudel and V. Tate for animal care.